

Introduction
Ten years on from devolution the extent to which divergence has become apparent within Scotland, relative to the other parts of the United Kingdom, is becoming a more pressing question to answer. Devolution is typically understood in terms of the degree to which unique, or more responsive, policy development may emerge (Drakeford, Reference Drakeford2005: 501–4). National or regional differences may be suggested to give rise to differences in policy itself (Keating, Reference Keating2005). Yet Rodríguez-Pose and Gill (Reference Rodríguez–Pose and Gill2004) more critically find that devolution has increased, rather than decreased, regional disparities and Morelli and Seaman (Reference Morelli and Seaman2007) suggest devolution within the UK has, to date, played no role in increasing equality. The United Kingdom government's experiment with devolution in Scotland, Wales and Northern Ireland continues then to lead to debates over its effectiveness and over the balance of powers between the central and devolved administrations with tax and welfare provision being two of the most important policy areas in which these debates are emerging.
The Scottish Government (2008) has identified household poverty, defined in relation to the bottom three deciles of the income distribution, as a key focus for its policy initiatives. This is set out in Taking Forward the Government Economic Strategy: A Discussion Paper on Tackling Poverty, Inequality and Deprivation. The government's ‘Solidarity Target’ seeks to both increase wealth and increase the share of total income gained by these three deciles. In seeking to alleviate poverty and placing it as a key policy objective, the Scottish Government has placed the distribution of welfare powers between the UK and Scottish governments as central to future debates over the extent and effectiveness of devolution.
This paper seeks to provide evidence on one aspect of this debate in relation to Scotland; the degree to which Scotland differs from the rest of the UK over levels of entrenched poverty during the period from 1991 to 2005. By entrenched poverty we refer to the inability of households to move out of the bottom three deciles of the income distribution. The Scottish Government's focus on the bottom three deciles of the income distribution would indeed be justified if household poverty is a persistent experience for the same households. Alternatively, if mobility is high, such that households have extensive movement up and down the income distribution, then policies focusing upon the bottom three deciles may not adequately address the transitory nature of household poverty.
The paper demonstrates that not only does Scotland have greater entrenched poverty but that the changes in mobility since the 1990s have impacted on Scotland to a lesser degree than the rest of the UK. In conclusion, the paper suggests that if the Scottish Government is seeking to reach its ‘Solidarity Target’ of increasing the share of income received by households in the bottom three deciles, it not only needs to increase the extent of its powers to influence welfare provision, but also needs to examine barriers to the effectiveness of previous, and future, policy impacting on this disadvantaged group.
Household poverty and mobility
The UK Labour government's policies to reduce poverty have come under increasing criticism for their failure to build on the improvement that it had begun to achieve after its first election in 1997. The rapid rise in poverty, and especially childhood poverty, through the 1980s and early 1990s led to a new focus on combating poverty from 1997 onwards (Greg et al., Reference Gregg, Harkness and Machin1999). The emergence of high levels of poverty was not simply a reflection of changes in the measurement of relative poverty, but reflected the stagnation of absolute income for many households, especially those with children. Thus the renewed focus on poverty was broadly welcomed by non-governmental organisations and academic commentators (Bradshaw, Reference Bradshaw and Fimister2001) with only limited criticism being directed towards the changes for their focus on market orientated solutions (Mooney and Johnstone, Reference Mooney and Johnstone2000). Indeed, it is argued that significant changes took place which were ‘highly progressive’ leading to reduced poverty rates in the early years of the ‘New’ Labour government under Tony Blair. These changes, again in relation to the reduction in child poverty from the levels prior to 1997, are understood as a marked achievement (Clark et al., Reference Clark, Dilnot, Goodman and Myck2002: 187). However, more recently the tone of much of the academic debate has changed. Increasingly, criticism has emerged for the slowing rate of progress and the increasing reliance upon work as the route out of poverty as the main thrust of government policy (Dornan, Reference Dornan2004; Horgan, Reference Horgan2005). In particular, the emphasis upon encouraging women into the workforce through the introduction of Child Tax Credits (CTC) and Working Family Tax Credits (WFTC) has been criticised (Horgan, Reference Horgan2005). As Chzhen and Middleston's (Reference Chzhen and Middleston2007: 46) study highlights, CTC and WFTC appear to have had no discernable impact on the number of hours worked by women who were already working 16 hours or more a week or on the likelihood of women moving from part-time to full-time work, or in the other direction. Indeed they suggest the CTC may even have discouraged some women from entering the workforce. The disappointment and criticism of UK government policy is summed up by Palmer et al. (Reference Palmer, MacInnes and Kenway2008: 18) when they suggest that ‘the evidence shows that it was not just progress on child poverty which slowed after 2004 but also a range of statistics to do with unemployment and worklessness’.
The problem of a slowing of progress in dealing with poverty is particularly acute in Scotland with its higher levels of recipients receiving Income Support (Kelly and McKendrick, Reference Kelly, Mckendrick, Mckendrick, Mooney, Dickie and Kelly2007: table 2.7). England and Wales, with the exception of the South East of England, is suggested to have both lower average household income compared to Scotland and lower inequality (Morelli and Seaman, Reference Morelli and Seaman2007). Not surprisingly poverty and measures to reduce it have been centre stage in debates over the role of the Scottish Parliament. Despite the exclusion of social security and limited taxation powers, the Scottish Parliament's decision-making influence in health, education and regional development provides the Scottish Government with significant scope for action, even within the current devolution settlement.
Ten years on from the initial Scottish Parliament, the devolution settlement and the extent of devolved powers are returning into political debate. The Scottish National Party is seeking to reignite debate over the extensiveness of the devolution settlement through the creation of a national conversation on independence. In relation to levels of poverty and the Solidarity Target one key question to examine is how structurally entrenched is poverty in Scotland relative to the rest of the UK? The analysis below seeks to examine this one aspect of poverty in Scotland, namely the entrenchment of poverty for the lowest three income deciles. The emphasis on employment routes out of poverty pursued by government at both the UK and devolved levels assumes that poverty may be a transient state for households undergoing stress. Where households are able to gain employment, they should be able to move up the income distribution either directly as a result of income from employment or alternatively with additional assistance from in-work state benefits and tax credits.
However, such an employment route out of poverty may not work. There may be what can be described as ‘structural barriers’ to accessing work. A geographical mismatch may exist between employment opportunities and the workless. Houston (Reference Houston2005) suggests that such geographical mismatches can exist across small spatial distances. Even where work is available it may be low paid or temporary. Adults in work may not have access to, or may not claim, in-work benefits. Poverty traps may exist whereby high marginal taxation rates reduce the opportunity for those at the bottom of the income distribution to increase their net income. The impact of such structural barriers to employment routes out of poverty may therefore result in the entrenchment of poverty; with a section of households unable to escape from the bottom of the income distribution. In two limited studies of the entrenchment hypothesis using the British Household Panel Survey, we find some confirmation of this hypothesis. Taylor et al.'s (Reference Taylor, Berthoud and Jenkins2004: 98–113) study comparing persistent worklessness in households between 1991–1996 and 1996–2001 found that the number of working age adults found in workless households for five or six consecutive years remained almost constant over the two periods. In a second study by Bell and Jack (Reference Bell, Jack, Ermisch and Wright2005), lack of mobility within the income distribution was suggested to be less acute within Scotland compared to the rest of the UK. However what is unknown is how this pattern and extent of entrenched poverty has changed over time.
The rest of this paper examines this entrenchment hypothesis. We seek to test if Scotland has less mobility within its income distribution in comparison to the rest of the UK. Specifically, our interest is in that section of the income distribution that faces poverty as a result of this lack of mobility and is the focus for the Scottish Government's Solidarity Target: the bottom three deciles. In the following sections, we first examine the data and methodology before moving to the results. In conclusion, we examine the impact these findings have for questions of increasing powers for the Scottish Government and devolution more generally.
Data and methodology
This study uses the annual UK British Household Panel Survey (BHPS) for the years 1991 to 2005. In doing so we are concerned to examine the extent of differences in experience between Scotland and the rest of the UK for household mobility of the lowest three deciles. The BHPS is a major panel survey of households within the UK. Its key feature and advantages over other data sets is the extent of its repeated interviews with the same households over time, its regularity being an annual survey and the longevity of the survey with 15 repeated waves. Therefore, unlike the much larger quarterly Labour Force Survey, which has a revolving sample every five consecutive quarters, we are able to trace changes in household circumstances over a considerably longer period. Similarly, its annual nature permits more temporary or short-term changes in household circumstances to be identified, something not possible with the repeated cohort studies undertaken over longer time periods.
In using the BHPS, we follow both the Taylor et al. (Reference Taylor, Berthoud and Jenkins2004) study and the Bell and Jack (Reference Bell, Jack, Ermisch and Wright2005) studies. However, unlike Taylor et al. (Reference Taylor, Berthoud and Jenkins2004), we study a longer time frame by using more recent waves of the BHPS up to 2005. This has the advantage of providing us with three periods of comparison and larger sample sizes for Scotland in the later years and so permits a disaggregating of the data for our comparison between Scotland and the rest of the UK. We also, importantly, focus upon the entrenchment hypothesis by examining the household's relative position within the income distribution rather than the incidence and persistence of worklessness within households. As a result our approach is closer to that of Bell and Jack (Reference Bell, Jack, Ermisch and Wright2005), although their approach using just two consecutive waves of the BHPS makes their results limited.
In this study we examine differences for households with and without children. Household income is adjusted for the composition of households using an equivalence scale, which in this case uses the McClements scale (Lambert, Reference Lambert2001). In so doing we are using data after housing costs. The following graphs track households found in the bottom three deciles of the income distribution to chart the extent of entrenchment over the following four years. First, we contrast Scotland with the rest of the UK for all households and then the analysis focuses more narrowly upon households with and households without children.
Note that we are examining mobility within the income distribution rather than reductions in poverty or inequality. For every household escaping the bottom three deciles in any one year another household must, by definition, fall into the bottom three deciles. Thus we are examining entrenchment as an indicator of the extent to which government policy may encourage mobility within the income distribution. Where higher mobility is apparent the incidence of poverty may be higher, for any given defined poverty line, but where higher entrenchment exists we expect that the experience of poverty may be more acute. Where mobility is high and households experience poverty as a temporary phenomena some adjustment or smoothing of consumption may be possible through the running down of savings derived from periods where households were higher up the income distribution. The impact of poverty may then be reduced on households in societies with higher mobility. In contrast, where lower mobility is apparent the experience of poverty will be felt more directly with households unable to compensate for loss of income through the use of savings.
One may expect households to face significant mobility through their life-cycle. As far back as the 1930s, William Beveridge highlighted the extent to which the incidence of poverty was linked to an individual's life-cycle, including during childhood, when bringing up children, during periods of sickness and ill health and finally during old age (Fraser, Reference Fraser1984; Lowe, Reference Lowe1993). Lower levels of mobility would be associated with an entrenchment of poverty within the same households within the lowest sections of the income distribution. This may be due to either characteristics of the individual households or alternatively structural barriers to mobility. As described above, UK government policy has focused upon incentivizing individual change. If structural barriers were evident, one would expect the impact of government policy on reducing inequality, if focused upon changing individual behaviour, to have a more limited impact.
Results
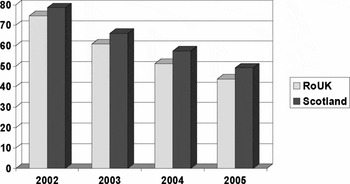
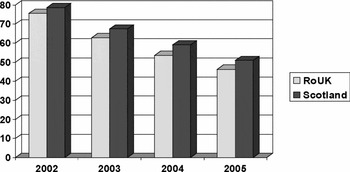
Figure 1 shows the extent to which households in the bottom three deciles of the income distribution in 2001, continued to be located in the bottom three income deciles in subsequent years.Footnote 1 So, in Figure 1, of those households who were in the bottom three deciles in 2001, 78.6 per cent of those households in Scotland remained within the bottom three deciles a year later, while for the rest of the UK the corresponding figure was 74.6 per cent. This differential grows to almost 6 per cent in the following year and continues such that four years later, in 2005, 49.2 per cent of Scottish households who were in the bottom three deciles of the income distribution in 2001were still within the same income deciles. This contrasts with 43.7 per cent for the rest of the UK. Selecting a cohort and tracing it for four years was also undertaken for cohorts starting in 1991 and again in 1996. While the 1991 cohort followed a similar pattern of differential to that of the 2001 cohort the absolute levels were higher with 81 per cent of Scottish households remaining in the bottom three deciles after one year and 77.9 per cent for the rest of the UK. Similarly, after four years the proportion of households remaining in the bottom three deciles was 54.8 per cent in Scotland and 48.7 per cent for the rest of the UK. The 1996 cohort shows a worsening of the position for the rest of the UK to levels similar to that of Scotland in the 1991 cohort.Footnote 2 The worsening picture for entrenched poverty from the 1991 to the 1996 cohort coincides with the Conservative government's period of office prior to the election of the first Labour government. Therefore, this worsening picture fits with our understanding of worsening poverty levels before 1997. Similarly, improvement identified in the 2001 cohort coincides with the Labour government's period of improvement in the poverty data. However, an optimistic interpretation of the data would be misleading. These results suggest there are indeed significant and consistently high levels of entrenched poverty within the UK. Over three quarters of households who are in the bottom three deciles of the income distribution remain so one year after.
Percentage of 2001 households remaining within the bottom three deciles of the income distribution during subsequent four years.
Source: BHPS 2001–2005.

Further, this entrenchment is more pronounced in Scotland than for the rest of the UK. While there are small differences in the extent of mobility between Scotland and the rest of the UK, after one year the relative outcome for Scotland deteriorates rapidly. Almost 50 per cent of those Scottish households initially in the bottom three deciles suffer prolonged periods of poverty by remaining within the bottom three deciles for four years, compared to just over 40 per cent of households for the rest of the UK. The results are similar if only the first decile or the first two deciles are chosen as the section of the income distribution, defined as being poor, but given the focus of the Scottish Government's Solidarity Target is the bottom three deciles we have chosen to focus on the three decile results only. Importantly, this result is opposite to the one found by Bell and Jack (Reference Bell, Jack, Ermisch and Wright2005: 135–6) who suggest, using two waves of BHPS data for 1999 and 2000, that the prevalence of entrenchment is greater in the rest of the UK in comparison to that of Scotland.Footnote 3 However, as our second cohort study shows the results between 1996 and 2001 suggest a closing of the gap in entrenchment between Scotland and the rest of the UK, a temporary phenomena as our later cohort following households from 2001 to 2005 indicates. We therefore believe Bell and Jack's (Reference Bell, Jack, Ermisch and Wright2005) findings to be specific to the narrow period chosen rather than a general finding.
While the extent of entrenched poverty is high across the UK throughout the period from 1991 until 2005 the composition of the bottom three deciles has not remained the same. An examination of the patterns of mobility between households with and households without children shows that entrenchment has become a more significant problem over time for households without children.
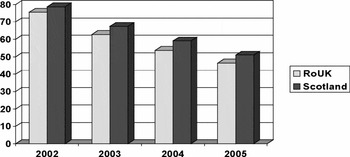
Figure 2 shows the pattern of entrenchment for households without children in a manner similar to that adopted in Figure 1; that is, it shows the percentage of those households (without children) who were located within the bottom three income deciles in 2001 and who remained in those same three deciles over the four subsequent years. As the figure indicates Scotland performs consistently worse than the rest of the United Kingdom with higher levels of entrenchment across all years.Footnote 4 While in Scotland 78.7 per cent of households remained after one year, the figure for the rest of the UK was 75.6 per cent. After four years the levels of entrenchment were 50.9 per cent and 46.3 per cent respectively. While entrenchment in Scotland was consistently worse than that for the rest of the UK, with levels of entrenched poverty similar to all households in Figure 1, the differential between Scotland and the rest of the UK is lower. In conclusion, we can suggest that measures to reduce entrenched poverty in households without children had a weak effect, but that the effect was relatively even across all parts of the UK. This is not, however, the same for households with children.
Percentage of 2001 households (without children) remaining within the bottom three deciles of the income distribution during subsequent four years.
Source: BHPS 2001–2005.

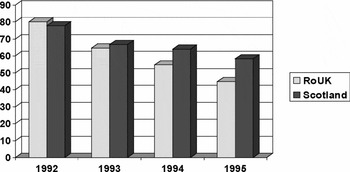
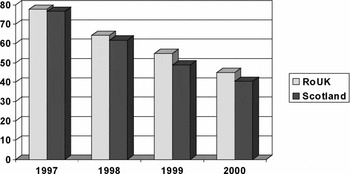
Figures 3, 4 and 5 show the results of an identical estimation for the three cohorts starting in 1991, 1996 and 2001 respectively, but in these cases for households with children.Footnote 5 Looking one year into each of these three cohorts yields results that suggest little change in the propensity to exit poverty in Scotland – the entrenchment rates were 77.8 per cent (1992), 76.6 per cent (1997) and 78.5 per cent (2002). This is in sharp contrast to the steadily improving results for the rest of the UK (80.1 percent, 77.7 per cent and 72.5 per cent, respectively, for these three years). As a result, entrenchment in Scotland had gone from 2.3 per cent less than the rest of the UK rate in 1992 to 6 per cent more than the rest of the UK rate in 2002.
Percentage of 1991 households (with children) remaining within the bottom three deciles of the income distribution during subsequent four years.
Source: BHPS 1991–1995.

Percentage of 1996 households (with children) remaining within the bottom three deciles of the income distribution during subsequent four years.
Source: BHPS 1996–2000.

Percentage of 2001 households (with children) remaining within the bottom three deciles of the income distribution during subsequent four years.
Source: BHPS 2001–2005.

With Figures 3, 4 and 5 we can also see how effective policies have been in reducing poverty entrenchment (in households with children) over a longer, four year timeframe. The picture here, however, is less clear cut than when considering just a one-year timeframe. The entrenchment rates for Scotland (58.3 per cent for 1995, 40.4 per cent for 2000 and 44.9 per cent for 2005) suggest a marked, but only temporary, improvement in the middle of these three cohorts. The relevant figures for the rest of the UK are 44.8 per cent, 45.1 per cent and 38.3 per cent respectively. Over the course of our data, the long-term entrenchment rate in Scotland has fallen from 13.5 per cent more than the rest of the UK rate to 6.6 per cent more than the rest of the UK rate.
Thus, over the period we examine, although Scotland has not seen a higher propensity for households with children to leave the bottom three deciles within a relatively short, one year timeframe (either in absolute terms or relative to the rest of the UK), there is evidence to suggest that the relative disadvantage experienced by Scottish households with children (compared to their rest of the UK counterparts), when using a longer, four year timeframe, has diminished somewhat over the period examined.
Conclusions
This paper started with an appreciation of the importance of welfare for future debates over devolution. The current SNP-led Scottish Government has set itself a Solidarity Target to address household poverty, specifically identifying poverty levels within the bottom three income deciles. What this paper has sought to do is to encourage a closer examination of the exact nature of poverty faced by households in these deciles. In particular, we have focused upon entrenched poverty for households in these three deciles. If mobility is low, then the experience of poverty for these disadvantaged households will be acute. However, it will be felt by fewer numbers of individual households in comparison to a more mobile income distribution. In less mobile income distributions anti-poverty strategies would be more prone to failure if the focus is simply on changing individual behaviour. Most notably this suggests that welfare-to-work policies, as a key element in government strategies, will under-perform. Thus government policy needs to examine how they can overcome the barriers to mobility that exist for these specific households in contrast to ensuring mobility is protected for a more mobile income distribution. Further government needs to consider how income maximisation strategies, through the benefit system, can help these households.
Our fundamental finding is that significant levels of entrenchment exist in both Scotland and the rest of the UK and that these levels have remained high throughout the 15 years of the survey data. This is particularly the case for the 1991 and 2001 cohorts, which is consistent with the view that the interventions made at the beginning of the UK Labour government's first term (1997–2001) fell away by their second term of office, and as such ties in with much of the criticism of the UK government's failure to build on the limited achievements made before 2004 discussed earlier. We also find that mobility varies between Scotland and the rest of the UK with ‘all household’ mobility in Scotland being lower than that in the rest of the UK (Figure 1).
The lower levels of mobility, for households without children, are a consistent finding for all the three cohorts examined (Figure 2). With much of the UK government's focus for anti-poverty strategy being to encourage the movement back into work for those in poverty, it is disappointing that Scottish households without children remain less mobile than their counterparts in the rest of the UK. Here greater research is required to examine whether or not the continued high levels of entrenchment is a characteristic of household composition, with pensioners and or disabled people for example over-represented in these groups in Scotland relative to the rest of the UK, or whether or not structural barriers to mobility exist, such as a lack of paid employment. It should be noted that the fact that the differential between entrenchment for Scotland and the rest of the United Kingdom did not change during these years suggests a priori that whatever household characteristics or structural factors exist they played the same role in Scotland as they did for the rest of the UK.
Finally, when we examine households with children we see the most worrying aspects of Scotland's entrenched household poverty (Figures 3, 4 and 5). Scotland has an initial, modest advantage with higher levels of mobility over the rest of the UK in the 1991 and 1996 cohorts when using a short-term, one year timeframe. However, by 2001 the situation had reversed itself. Whatever improvement was occurring with entrenched household poverty for households with children was happening to households within the rest of the UK and left Scottish households with children largely unchanged from 1991 to 2005. Scottish households with children remained firmly rooted in entrenched poverty. Indeed, Scotland's relative disadvantage becomes more marked over a longer, four year timescale, though at least it would appear that the scale of this additional disadvantage has narrowed by the end of the third cohort. Here again we need to examine the extent to which differences, such as family size or levels of disability for example, are over-represented characteristics of households with children in Scotland and provide an explanation for this higher level of entrenched poverty.
Finally, the Scottish Government's Solidarity Target seeks to increase wealth and increase the proportion of national income gained by the bottom three deciles. Our findings suggest that for the redistributive element of the Solidarity Target to be reached the Scottish Government will require a commitment to significant redistributive policies. Entrenched poverty is a consistent and long-term feature of Scottish society. Changes to entrenched household poverty taking place across the rest of the UK have had a more limited effect in Scotland. As a result, more thorough-going changes will be required if entrenched poverty is to be addressed. Policies are required which seek to increase income for these households, either through removing barriers to mobility or maximising household income. The Scottish Government's approach to Council Tax reform is one such change. The proposed replacement of the Council Tax by a local income tax aims to make local taxation more progressive. However, the Scottish Government's decision to opt for a flat-rate local income tax rather than a progressive local income tax will act to mitigate the redistributive effects of the change.