
1. Introduction
Resolvent analysis (also known as input/output analysis) determines a volumetric distribution of forcing in the frequency domain that gives rise, when acting in a time-invariant flow, to the most amplified linear response, typically measured in terms of its total kinetic energy. It is an important tool in stability and transition analysis (Farrell & Ioannou Reference Farrell and Ioannou1993; Trefethen et al. Reference Trefethen, Trefethen, Reddy and Driscoll1993; Schmid, Henningson & Jankowski Reference Schmid, Henningson and Jankowski2002; Jovanović & Bamieh Reference Jovanović and Bamieh2005), and has more recently been proposed as a reduced-order model of coherent structures in fully developed turbulence (Hwang & Cossu Reference Hwang and Cossu2010b; McKeon & Sharma Reference McKeon and Sharma2010). In the latter context, resolvent analysis can be derived by partitioning the Navier–Stokes equations into terms that are linear and nonlinear with respect to perturbations. Such a rearrangement of the equations is exact, and the equations may be explored without recourse to any further modelling. With varying degrees of formality, similar approaches were proposed in the past (Malkus Reference Malkus1956; Michalke Reference Michalke1971; Crighton & Gaster Reference Crighton and Gaster1976; Butler & Farrell Reference Butler and Farrell1992), but increases in computer power that speed up the singular value decomposition of the linear operator using direct lower-upper (LU) decomposition (multi-frontal algorithms for sparse systems) have allowed a detailed characterization of the resolvent spectrum in several turbulent, canonical wall-bounded (Hwang & Cossu Reference Hwang and Cossu2010a,Reference Hwang and Cossub; McKeon & Sharma Reference McKeon and Sharma2010; Moarref et al. Reference Moarref, Sharma, Tropp and McKeon2013; Sharma & McKeon Reference Sharma and McKeon2013) and free shear flows (Jeun, Nichols & Jovanović Reference Jeun, Nichols and Jovanović2016; Schmidt et al. Reference Schmidt, Towne, Rigas, Colonius and Brès2018).
At those frequencies where the dominant singular value is significantly larger than the subdominant ones (which we refer to as low-rank behaviour), the dominant modes are qualitatively similar to coherent modes extracted from data (Schmidt et al. Reference Schmidt, Towne, Rigas, Colonius and Brès2018). However, when the response is not low rank, a non-trivial structure of the nonlinear forcing terms may lead to discrepancies between resolvent and observed modes. Thus, it is necessary to model the nonlinear forcing to attain resolvent analyses that are quantitatively predictive. Previous studies have considered several approaches for modelling the nonlinear forcing in linear analyses. These include empirical models (Bechara et al. Reference Bechara, Bailly, Lafon and Candel1994; Tam & Auriault Reference Tam and Auriault1999; Cavalieri et al. Reference Cavalieri, Jordan, Agarwal and Gervais2011; Cavalieri & Agarwal Reference Cavalieri and Agarwal2014; Towne, Bres & Lele Reference Towne, Bres and Lele2017), estimation given partial statistics of the response (Zare, Jovanović & Georgiou Reference Zare, Jovanović and Georgiou2017; Martini et al. Reference Martini, Cavalieri, Jordan, Towne and Lesshafft2020; Towne, Lozano-Durán & Yang Reference Towne, Lozano-Durán and Yang2020) and/or the use of a turbulent, or eddy, viscosity. An eddy viscosity may be motivated by concepts underlying the triple decomposition (Reynolds & Tiederman Reference Reynolds and Tiederman1967; Reynolds & Hussain Reference Reynolds and Hussain1972), which identifies the Reynolds stresses as acting on the coherent fluctuations (from both the coherent and incoherent fluctuations), even though the phase average used to define the coherent part of the turbulent viscosity field is ambiguous in unforced turbulent flows. Many studies have applied eddy-viscosity models in the wall-bounded turbulence literature (Del Alamo & Jimenez Reference Del Alamo and Jimenez2006; Cossu, Pujals & Depardon Reference Cossu, Pujals and Depardon2009; Pujals et al. Reference Pujals, García-Villalba, Cossu and Depardon2009; Hwang & Cossu Reference Hwang and Cossu2010a,Reference Hwang and Cossub; Hwang Reference Hwang2016; Vadarevu et al. Reference Vadarevu, Symon, Illingworth and Marusic2019; Hwang & Eckhardt Reference Hwang and Eckhardt2020) either through implementation of the Cess (Reference Cess1958) model or by estimating the eddy-viscosity field via the Reynolds stresses and the mean shear rate of strain. Similarly, global stability analyses have applied eddy-viscosity models to identify and/or control forced or self-sustained resonances in transitional and turbulent flows (Crouch, Garbaruk & Magidov Reference Crouch, Garbaruk and Magidov2007; Meliga, Pujals & Serre Reference Meliga, Pujals and Serre2012; Mettot, Sipp & Bézard Reference Mettot, Sipp and Bézard2014; Oberleithner, Paschereit & Wygnanski Reference Oberleithner, Paschereit and Wygnanski2014; Sartor, Mettot & Sipp Reference Sartor, Mettot and Sipp2014; Rukes, Paschereit & Oberleithner Reference Rukes, Paschereit and Oberleithner2016; Semeraro et al. Reference Semeraro, Jaunet, Jordan, Cavalieri and Lesshafft2016a; Tammisola & Juniper Reference Tammisola and Juniper2016). These studies implemented eddy viscosity on an ad hoc basis, citing improved qualitative agreement or improved integrated energy densities.
In a more quantitative sense, eddy-viscosity enhanced linear models have also proven useful for assimilating known data to reconstruct observed energy spectra and mean-flow quantities. Moarref & Jovanović (Reference Moarref and Jovanović2012) showed that a data-driven, white-in-time forcing could reproduce the turbulent energy spectrum found via direct numerical simulation (DNS) and, similarly, Illingworth, Monty & Marusic (Reference Illingworth, Monty and Marusic2018) could match DNS energy spectra using time-resolved velocity measurements. More recently, Towne et al. (Reference Towne, Lozano-Durán and Yang2020) showed that incorporating an eddy-viscosity model led to accurate estimates of space–time statistics using partially known data from DNS. Finally, Pickering et al. (Reference Pickering, Towne, Jordan and Colonius2020b) used an eddy-viscosity enhanced resolvent model to reconstruct the large-eddy simulation (LES) acoustic field of transonic and supersonic turbulent jets at a significantly lower rank when compared to their non-eddy-viscosity enhanced computations. Other approaches have implemented eddy-viscosity fields to develop self-consistent models, such as Yim, Meliga & Gallaire (Reference Yim, Meliga and Gallaire2019) or Hwang & Eckhardt (Reference Hwang and Eckhardt2020), where the former study coupled a harmonically forced, quasi-linear resolvent analysis with Reynolds-averaged Navier–Stokes (RANS) equations, citing eddy viscosity as a necessary link between the coherent and incoherent perturbation dynamics.
Although the utility of eddy-viscosity enhanced linear models for turbulent modelling and control has become increasingly apparent, a quantitative assessment of their effect on turbulent structures is lacking; even more, it is unclear which statistics turbulence models should seek to predict. One appealing target is modes educed by spectral proper orthogonal decomposition (SPOD), as these modes optimally reconstruct the turbulent kinetic energy and represent space–time coherent structures (Towne, Schmidt & Colonius Reference Towne, Schmidt and Colonius2018). In fact, the SPOD has a theoretical connection with resolvent analysis. Towne et al. (Reference Towne, Schmidt and Colonius2018) showed that if the resolvent forcing modes, at a given frequency and wavenumber, are mutually uncorrelated, then the resolvent response modes are identical to the SPOD modes. Likewise, discrepancies between the SPOD and resolvent modes imply correlated forcing modes. Morra et al. (Reference Morra, Semeraro, Henningson and Cossu2019) applied a similar line of thinking by including an eddy viscosity in their resolvent analysis of turbulent channel flow, showing that the resulting resolvent modes were in greater agreement with the SPOD modes educed from high-fidelity simulation data than resolvent analysis using only molecular viscosity. We extend this approach to turbulent jets, but consider a more general framework. The central question we ask is: How well can the inclusion of an eddy-viscosity model in the resolvent operator approximate the correlations of the forcing cross-spectral density tensor? In this approach, an ideal model would render any remaining forcing as uncorrelated, meaning that the resolvent and SPOD modes coincide. We therefore define a data-informed variational problem that seeks an optimal eddy-viscosity field that maximizes the projection of the first SPOD mode on the first resolvent mode. We then show that we can achieve nearly optimal projections using standard eddy-viscosity models, including one directly inferred from a corresponding RANS simulation.
The work presented here is also relevant to a broader debate taking place regarding the interpretation of resolvent analysis. Since we can define the resolvent operator from the full nonlinear equations without introducing approximations or closures, it is attractive to proceed without introducing ad hoc models such as eddy viscosity, since we can still consider the framework exact. With a minor caveat (i.e. while exact, the resolvent decomposition is not necessarily unique as it can depend on the choice of dependent variables used to express the governing equations, see Karban et al. Reference Karban, Bugeat, Martini, Towne, Cavalieri, Lesshafft, Agarwal, Jordan and Colonius2020), this implies that the forcing terms are physically interpretable (i.e. measurable) quantities. This perspective is, in our opinion, valuable, and may be pursued alongside efforts (such as the present work) aimed at empirically modelling the forcing. However, there is a subtlety that confounds the separation between ‘exact’ and ‘modelled’ resolvent analyses: namely, it may not be possible to compute, with meaningful accuracy, the exact resolvent modes in high Reynolds number flows, particularly when the mean flow is two- or three-dimensional. The fine-scale structure of the modes can require resolutions similar to DNS, and inversion of the resulting linear systems for singular value decomposition can be prohibitive. A survey of resolvent analyses conducted to date on multidimensional base flows shows that a variety of regularizations of the resolvent operator have been used to reduce the computational burden. By regularizations, we mean linear modifications to the operator that, whether through physical or numerical justification, provide results that are free from numerical artefacts or which more closely resemble observed quantities. These include the use of eddy-viscosity models (as discussed at length above), fourth-order numerical filters (Jeun et al. Reference Jeun, Nichols and Jovanović2016), effective Reynolds numbers (Schmidt et al. Reference Schmidt, Towne, Rigas, Colonius and Brès2018) and linear damping (Yeh & Taira Reference Yeh and Taira2019).
From a more general perspective, the present work also has a connection to the building of data-augmented turbulence models (Duraisamy, Iaccarino & Xiao Reference Duraisamy, Iaccarino and Xiao2019). Here, we specifically target the modelling of unsteady features (Wang et al. Reference Wang, Luo, Li, Tan and Fan2018; Maulik et al. Reference Maulik, San, Jacob and Crick2019) and the optimal eddy-viscosity fields found, at each frequency–wavenumber pair, which are analogous to field-inversion steps (also based on variational data-assimilation methods, Foures et al. Reference Foures, Dovetta, Sipp and Schmid2014; Parish & Duraisamy Reference Parish and Duraisamy2016) that assist machine learning techniques in generating eddy-viscosity models from mean-flow quantities.
We organize the paper as follows. In § 2 we outline the governing equations, resolvent analysis and SPOD. In § 3 we discuss the optimization framework developed to match, or align, SPOD and resolvent modes, and the specific eddy-viscosity models examined. Section 4 provides the resulting resolvent mode shapes found via the four eddy-viscosity models and § 5 analyses the associated optimal eddy-viscosity fields. In § 6 we show a favourable impact of the eddy-viscosity models on the subdominant resolvent modes and then conclude the analysis in § 7 by assessing the sensitivity of the RANS eddy-viscosity model. In this final section, we ultimately find a frequency-independent RANS eddy-viscosity field that performs well for three turbulent jets (i.e. subsonic, transonic, and supersonic) and their most energetic frequencies ( $St \in [0.05,1]$) and azimuthal wavenumbers (
 $m \in \mathbb {N} \subset [0,5]$).
2. Methods
The LES database, resolvent analysis and SPOD were described in Schmidt et al. (Reference Schmidt, Towne, Rigas, Colonius and Brès2018) and Towne et al. (Reference Towne, Schmidt and Colonius2018). For brevity, we only recall the main details here.
2.1. Large-eddy simulation database
The flow solver Charles was used to compute the LES databases, including subsonic (Mach 0.4), transonic (Mach 0.9) and supersonic (Mach 1.5) cases; Brès et al. (Reference Brès, Ham, Nichols and Lele2017) contains the details on the numerical method, meshing and subgrid models. Experiments conducted at PPRIME Institute, Poitiers, France were used to validate the Mach 0.4 and 0.9 jets (Brès et al. Reference Brès, Jordan, Jaunet, Le Rallic, Cavalieri, Towne, Lele, Colonius and Schmidt2018). Table 1 provides a summary of parameters for the three jets considered. Parameters include the Reynolds number based on diameter  $Re_j = \rho _j U_j D / \mu _j$ (where subscript
 $j$ specifies the value at the centreline of the jet nozzle exit,
 $\rho$ is density,
 $\mu$ is viscosity) and the Mach number,
 $M_j = U_j/a_j$, where
 $a_j$ is the speed of sound. The simulated
 $M_j = 0.4$ jet corresponds to the experiments in Cavalieri et al. (Reference Cavalieri, Rodríguez, Jordan, Colonius and Gervais2013), Jaunet, Jordan & Cavalieri (Reference Jaunet, Jordan and Cavalieri2017) and Nogueira et al. (Reference Nogueira, Cavalieri, Jordan and Jaunet2019) with the same nozzle geometry and similar boundary-layer properties at the nozzle exit. Throughout the manuscript, reported results are non-dimensionalized by the mean jet velocity
 $U_j$, jet diameter
 $D$ and dynamic pressure
 $\rho _j U_j^2$. We report frequencies in Strouhal number,
 $St = f D / U_j$, where
 $f$ is the frequency.
Parameters, sampling rate and frequency resolution for the LES.  $p_0/p_\infty$ is the nozzle pressure ratio,
 $T_0/T_\infty$ is the temperature ratio, and
 $n_{cells}$ is the number of cells for each simulation.

Each database comprises 10 000 snapshots separated by  ${\rm \Delta} t a_\infty / D$, where
 $a_\infty$ is the ambient speed of sound, and is interpolated onto a structured cylindrical grid
 $x,r,\theta \in [0,30] \times [0,6] \times [0, 2{\rm \pi} ]$, where
 $x$,
 $r$,
 $\theta$ are streamwise, radial and azimuthal coordinates, respectively. Variables are reported by the vector
 \begin{equation} \boldsymbol{q} = [\rho, u_x, u_r, u_\theta, T]^{\rm T}, \end{equation}
where  $u_x$,
 $u_r$,
 $u_\theta$ are the three velocity components, and a standard Reynolds decomposition separates the vector into mean,
 $\bar {\boldsymbol {q}}$, and fluctuating,
 $\boldsymbol {q}'$, components
 \begin{equation} \boldsymbol{q}(x,r,\theta,t) = \bar{\boldsymbol{q}}(x,r) + \boldsymbol{q}'(x,r,\theta,t).\end{equation}
2.2. Resolvent analysis
We start with the nonlinear flow equations of the form
 \begin{equation} \frac{\partial \boldsymbol{q}}{\partial t} = \boldsymbol{F}(\boldsymbol{q}), \end{equation}
where  $\boldsymbol {F}$ is the time-independent compressible Navier–Stokes operator (plus continuity and energy). Substituting (2.2) for
 $\boldsymbol {q}$ and separating terms linear in state perturbations,
 $\boldsymbol {q}'$, to the left-hand side gives
 \begin{equation} \frac{\partial \boldsymbol{q}'}{\partial t} - \boldsymbol{A}(\bar{\boldsymbol{q}})\boldsymbol{q}' = \boldsymbol{f}(\bar{\boldsymbol{q}},\boldsymbol{q}'), \end{equation}
where
 \begin{equation} \boldsymbol{A}(\bar{\boldsymbol{q}}) = \frac{\partial \boldsymbol{F}}{\partial \boldsymbol{q}}(\bar{\boldsymbol{q}}), \end{equation}
is the linearized flow operator (provided in Appendix B) and  $\boldsymbol {f}$ contains the nonlinear terms and any additional external inputs (e.g. environmental noise or perturbations at the boundary).
For the round, statistically stationary turbulent jets we consider, (2.4) is Fourier transformed both temporally and azimuthally to the compact expression
 \begin{equation} (\textrm{i}\omega\boldsymbol{I} - \boldsymbol{A}_m) \boldsymbol{q}_{m, \omega} = \boldsymbol{f}_{m, \omega},\end{equation}
where  $\omega = 2 {\rm \pi}St$ is the frequency and
 $m$ represents the azimuthal wavenumber. We can then rewrite (2.6) by defining the resolvent operator,
 $\boldsymbol {R}_{\omega ,m} = (\textrm {i}\omega \boldsymbol {I} - \boldsymbol {A}_m)^{-1}$,
 \begin{equation}
\boldsymbol{q}_{m, \omega} = \boldsymbol{R}_{m, \omega}\,
\boldsymbol{f}_{m, \omega},
\end{equation}
and introduce the compressible energy norm (Chu Reference Chu1965) via the matrix  $\boldsymbol {W}$,
 \begin{align}
\langle \boldsymbol{q}_1, \boldsymbol{q}_2 \rangle_E = \iiint \boldsymbol{q}_1^* \text{diag} \left(
\frac{\bar{T}}{\gamma \bar{\rho} M^2}, \bar{\rho},
\bar{\rho}, \bar{\rho}, \frac{\bar{\rho}}{\gamma (\gamma -
1) \bar{T} M^2} \right) \boldsymbol{q}_2 r\, {\rm d} r\, {\rm d}
x\, {\rm d} \theta = \boldsymbol{q}_1^* \boldsymbol{W}
\boldsymbol{q}_2,
\end{align}
to the forcing and response, where  $\boldsymbol {W} = \boldsymbol {W}_f = \boldsymbol {W}_q$. The resolvent modes under this norm are then found by taking the singular value decomposition of the weighted resolvent operator,
 \begin{equation} \tilde{\boldsymbol{R}}_{m, \omega} = \boldsymbol{W}_q^{1/2} \boldsymbol{R}_{m, \omega}\boldsymbol{W}_f^{{-}1/2} = \tilde{\boldsymbol{U}}_{m,\omega} \boldsymbol{\varSigma}_{m, \omega} \tilde{\boldsymbol{V}}_{m, \omega}^*, \end{equation}
where the diagonal matrix  $\boldsymbol {\varSigma }_{m, \omega }$ contains the ranked gains and the columns of
 $\boldsymbol {U}_{m,\omega } = \boldsymbol {W}_q^{-1/2} \tilde {\boldsymbol {U}}_{m,\omega }$ and
 ${\boldsymbol {V}}_{m,\omega } = \boldsymbol {W}_f^{-1/2} \tilde {\boldsymbol {V}}_{m,\omega }$ contain the response and forcing modes, respectively. These modes are orthonormal in the energy norm, (2.8),
 \begin{equation} \boldsymbol{U}_{m,\omega}^*\boldsymbol{W}\boldsymbol{U}_{m,\omega}=\boldsymbol{V}_{m,\omega}^*\boldsymbol{W}\boldsymbol{V}_{m,\omega}=\boldsymbol{I}, \end{equation}
and recover the resolvent operator from (2.7) as,
 \begin{equation} \boldsymbol{R}_{m, \omega} = \boldsymbol{U}_{m,\omega} \boldsymbol{\varSigma}_{m, \omega} \boldsymbol{V}_{m, \omega}^* \boldsymbol{W}. \end{equation}
For the resolvent analysis presented here, just as in Schmidt et al. (Reference Schmidt, Towne, Rigas, Colonius and Brès2018), the above equations are discretized in the streamwise and radial directions with fourth-order summation by parts finite differences (Mattsson & Nordström Reference Mattsson and Nordström2004), while the polar singularity is treated as in Mohseni & Colonius (Reference Mohseni and Colonius2000) and non-reflecting boundary conditions are implemented at the domain boundaries.
2.3. Spectral proper orthogonal decomposition
SPOD, similar to space-only proper orthogonal decomposition (POD) and originally shown by Lumley (Reference Lumley1967, Reference Lumley1970), determines an optimal (i.e. in terms of energy) set of orthogonal modes to describe a dataset, but unlike space-only POD, produces modes that express both spatial and temporal correlation in the data. Like dynamic mode decomposition, SPOD modes are computed at unique frequencies. However, through appropriate averaging, SPOD naturally ranks modes by energy and optimally accounts for the statistical variability of turbulent flows (Towne et al. Reference Towne, Schmidt and Colonius2018). Thus, the associated SPOD modes provide the ideal measurement tool to assess modes computed via resolvent analysis.
Decomposing the LES database  $\boldsymbol {Q}$, where
 $\boldsymbol {Q}$ represents the temporal ensemble of perturbations (
 $\boldsymbol {q}^{\prime }$) found by applying the standard Reynolds decomposition, in the azimuthal and temporal dimensions via the discrete Fourier transform gives the decomposed data matrices,
 $\hat {\boldsymbol {Q}}_{m,\omega }$. Multiplying the decomposed matrices, at a particular frequency and azimuthal wavenumber, by their complex conjugate give the cross-spectral density
 \begin{equation} \boldsymbol{S}_{m, \omega} = \hat{\boldsymbol{Q}}_{m,\omega} \hat{\boldsymbol{Q}}_{m,\omega}^*, \end{equation}
to which we solve the SPOD eigenvalue problem presented by Lumley (Reference Lumley1967, Reference Lumley1970)
 \begin{equation} \boldsymbol{S}_{m, \omega}\boldsymbol{W}\boldsymbol{ \varPsi }_{m, \omega} = \boldsymbol{\varPsi}_{m, \omega} \boldsymbol{\varLambda}_{m, \omega}. \end{equation}
The SPOD modes form the columns of  $\boldsymbol {\varPsi }_{m, \omega }$, ranked by the diagonal matrix of eigenvalues
 $\boldsymbol {\varLambda }_{m, \omega }= \text {diag}(\lambda _1, \lambda _2,\ldots , \lambda _N)$. The modes are orthonormal in the norm
 $\langle \cdot , \cdot \rangle _{E}$, and satisfy
 $\boldsymbol {\varPsi }_{m, \omega }^*\boldsymbol {W}\boldsymbol {\varPsi }_{m, \omega }= \boldsymbol {I}$. As a result, expansion of the cross-spectral density tensor gives,
 \begin{equation} \boldsymbol{S}_{m, \omega} = \boldsymbol{\varPsi}_{m, \omega} \boldsymbol{\varLambda}_{m, \omega}\boldsymbol{ \varPsi }_{m, \omega}^*. \end{equation}
In this study, we perform all SPOD computations with a Hamming window and realization sizes of 256 snapshots with 50 % overlap, resulting in 78 independent realizations.
To avoid ambiguity in referring to computed SPOD and resolvent modes, we use the following notation for the rest of the manuscript. First, all computed mode's subscripts  $m,\omega$ are dropped, but referenced when necessary in the text. Second,
 $\boldsymbol {\psi }_{n}$ represents the
 $n$th most energetic SPOD mode, while
 $\boldsymbol {v}_n$ and
 $\boldsymbol {u}_n$ denote the resolvent forcing and response, respectively, that provide the
 $n$th largest linear-amplification gain between
 $\boldsymbol {v}_n$ and
 $\boldsymbol {u}_n$. Finally, we use the notation
 $\boldsymbol {\psi }_{1}: u_x$ when referring to specific components of each mode, as shown here with streamwise velocity.
2.4. Using SPOD to inform resolvent analysis
As SPOD provides the optimal description of the second-order flow statistics, we wish to use this decomposition to inform our resolvent approach to match such statistics. The connection can be made through multiplication of (2.7) by its complex conjugate and then applying the expectation operator to present the relation between the cross-spectral density (CSD) tensors of the forcing and response through the resolvent operator,
 \begin{equation} \boldsymbol{S}_{\boldsymbol{q}\boldsymbol{q}} = \mathbb{E} [ \boldsymbol{q}\boldsymbol{q}^* ] = \mathbb{E} [ \boldsymbol{R} \boldsymbol{f}\boldsymbol{f}^* \boldsymbol{R}^*] = \boldsymbol{R} \boldsymbol{S}_{\boldsymbol{f}\boldsymbol{f}}\boldsymbol{R}^*. \end{equation}
If  $\boldsymbol {q}$ is projected onto the SPOD modes and
 $\boldsymbol {f}$ is projected onto the input resolvent modes,
 $\boldsymbol {\beta } = \boldsymbol {V}^* \boldsymbol {W} \boldsymbol {f}$, where the vector
 $\boldsymbol \beta$ is the projection coefficients, then we may write
 \begin{equation} \boldsymbol{\varPsi} \boldsymbol{\varLambda} \boldsymbol{\varPsi}^* = \boldsymbol{U} \boldsymbol{\varSigma} \boldsymbol{S}_{\boldsymbol\beta\boldsymbol\beta} \boldsymbol{\varSigma} \boldsymbol{U}^*, \end{equation}
which highlights that if the forcing coefficients are uncorrelated ( $\boldsymbol {S}_{\boldsymbol \beta \boldsymbol \beta } = \boldsymbol {\varLambda }_{\boldsymbol {\beta }}$ ) then the resolvent modes would be equivalent to the SPOD modes (Towne et al. Reference Towne, Schmidt and Colonius2018). Conversely, when the resolvent and SPOD modes are not identical, which is the case in our study, the forcing coefficients are correlated and this correlation must be modelled.
Rather than pursuing a direct model of the forcing coefficients, we take an alternative perspective that asks whether a modified resolvent operator,  $\boldsymbol {R}_T$, can match one or more of the dominant resolvent and SPOD modes. A trivial solution would be to define the operator by the SPOD expansion, i.e.
 ${\boldsymbol {R}}_T = \boldsymbol {\varPsi }$, but this operator then corresponds to the (discretization of any) general (non-local) linear operator, rather than a specific partial differential equation (PDE). Instead, a practical model can be obtained by posing a modified PDE of the linearized governing equations with one or more unknown coefficients, and then finding the best choice of coefficients such that the resolvent and SPOD modes are optimally matched. We propose such an approach in the next section by exploiting an eddy-viscosity model, and develop an optimization procedure that fits the parameters to align one, or more, of the most dominant resolvent and SPOD modes.
To the extent that the modified resolvent operator achieves alignment of any one of its output modes with a specific SPOD mode, we may directly interpret the corresponding diagonal entry of  $\boldsymbol {S}_{\boldsymbol {\beta }\boldsymbol {\beta }}$ as the forcing amplitude,
 $\lambda _\beta$, required to reproduce the SPOD mode amplitude
 $\lambda$, through the resolvent gain,
 $\sigma ^2$. In other words,
 \begin{equation}
\lambda_n = \sigma^2_n {\lambda_{\boldsymbol{\beta}}}_{n}
\quad \mbox{for any } n \hbox{ where } {\boldsymbol{u}}_n = {\boldsymbol{\psi}}_n,
\end{equation}
independent of whether the other modes are aligned (as other modes are orthogonal).
3. Models considered
We now add an eddy-viscosity model to the linearized governing equations (2.4). We follow the ad hoc model used in (amongst other references) Del Alamo & Jimenez (Reference Del Alamo and Jimenez2006) and Hwang & Cossu (Reference Hwang and Cossu2010b), which is typically justified by extending eddy viscosity from its traditional use in modelling the mean Reynolds stresses to modelling the effect of the ‘background turbulence’ on the coherent motion.
The perturbation equations including the eddy viscosity are, with the replacement  $\mu \mapsto \mu _{\mathrm {eff}} = \mu _j + \mu _T$, identical to the original linearized equations, provided one accounts for the (spatial) variability of
 $\mu _T$ (equations provided in Appendix B). There remains an unknown forcing that is the residual between the original forcing and the ‘coherent’ part that is modelled by the eddy viscosity. Unfortunately, the residual forcing no longer possesses its exact physical interpretation as the nonlinear interactions of resolved modes. However, the advantage is that the resulting response modes can significantly reduce the rank of the problem and lead to a residual forcing CSD that is tractable to model when compared to the forcing CSD of the exactly rearranged equations (Pickering et al. Reference Pickering, Towne, Jordan and Colonius2020b; Towne et al. Reference Towne, Lozano-Durán and Yang2020).
In what follows, we refer to the modified linear operator with  $\mu _T \ne 0$ as
 $\boldsymbol {A}_T$ and note that the operator depends on the chosen field for
 $\mu _T$, which, upon discretization becomes a vector
 $\boldsymbol {\mu }_T$. Since we assume that
 $\mu _T$ is steady and axisymmetric, the operators have a similar temporal/azimuthal Fourier transform that we denote
 ${\boldsymbol {A}_{T}}_m$.
We now consider four models for the eddy-viscosity field. The first model directly optimizes the eddy-viscosity field to maximize agreement between the dominant resolvent and SPOD modes. The second model fits an eddy viscosity to the LES mean flow by minimizing the residual in the steady RANS equations. The third model uses an independently computed eddy-viscosity field from a RANS  $k-\epsilon$ model. Finally, we consider a simpler constant eddy-viscosity model based solely upon a turbulent Reynolds number.
For brevity, we refer to the modes computed with the above eddy-viscosity models as EVRA (eddy-viscosity resolvent analysis) modes, while modes termed ‘baseline’ refer to those computed by Schmidt et al. (Reference Schmidt, Towne, Rigas, Colonius and Brès2018). We chose this study as a reference for its extensive comparison of resolvent and SPOD modes across all three turbulent jets and many wavenumbers and frequencies. In the baseline study, they chose an effective Reynolds number of  ${Re}_T = 3 \times 10^4$, a value that is an order of magnitude smaller than the molecular Reynolds number, yet not consistent with the expected magnitude of an eddy viscosity (i.e.
 ${Re}_T \ll 3 \times 10^4$) . Instead, we regard this intermediate value as a regularization of the resolvent operator. Table 2 summarizes the various models investigated.
Turbulence models investigated in this study. The baseline* case refers to the results of Schmidt et al. (Reference Schmidt, Towne, Rigas, Colonius and Brès2018).

For exploratory purposes, we find an eddy-viscosity field that best matches the (so modified) resolvent operator to the measured SPOD modes independently for each frequency and azimuthal mode. The purpose is to gauge the sensitivity of the eddy-viscosity value needed to model the different frequencies and azimuthal modes, and should not be interpreted as a proposal for a frequency-dependent eddy viscosity.
Parenthetically, within the following optimization framework we can consider any turbulence model or regularization based on mean-flow quantities. A further example is given in Appendix A, where we consider a linear damping model recently proposed for resolvent analysis of unstable base flows (Yeh & Taira Reference Yeh and Taira2019). In the appendix, we find that the linear damping improves agreement, but the performance is generally inferior to the eddy-viscosity models. This is likely due to the monolithic damping effect over all regions and wavenumbers, whereas the eddy-viscosity methods directly address the effect of the Reynolds stresses both in regard to specific regions of the flow and the approach's ability to account for spatial gradients in the eddy-viscosity field.
3.1. Optimal eddy-viscosity field
Here we develop an optimization, computed independently for each frequency and azimuthal mode, that finds the eddy-viscosity field that is optimal (i.e. the upper bound) in matching the leading resolvent and SPOD modes. To find the analytical expression that determines the sensitivity of mode agreement to an eddy-viscosity field, we use a Lagrangian technique analogous to Brandt et al. (Reference Brandt, Sipp, Pralits and Marquet2011) that accounts for the non-modal behaviour of the resolvent operator. This technique couples constraints from the governing equations, resolvent analysis, a normalization, and a cost function (agreement of the leading SPOD and resolvent modes), into a Lagrangian functional for whose stationary point provides the desired maximum.
To build the Lagrangian functional, we begin with the forward equation (2.6) and substitute  $\boldsymbol {L}$ with
 $\boldsymbol {L}_T$, the linear operator that includes an eddy-viscosity model. The singular value/singular vector
 $(\boldsymbol {v}_1,\boldsymbol {u}_1, \sigma _1)$ as defined in (2.11) is a solution of both the forward equation (2.6),
 \begin{equation} \boldsymbol{v}_1 = \boldsymbol{L}_T \boldsymbol{u}_1,\end{equation}
where  $\boldsymbol {v}_1$ replaces
 $\boldsymbol {f}$ as the forcing and
 $\boldsymbol {u}_1$ replaces
 $\boldsymbol {q}$ as the associated response, and the resolvent eigenvalue problem,
 \begin{equation} \boldsymbol{W} \boldsymbol{u}_1 = \sigma_1^2 \boldsymbol{L}_T^* \boldsymbol{W}\boldsymbol{v}_1. \end{equation}
The above resolvent eigenvalue solution is found by taking the energy norm of (2.7) and dividing by the forcing energy to give
 \begin{equation} \frac{\boldsymbol{u}_1^* \boldsymbol{W} \boldsymbol{u}_1}{\boldsymbol{v}_1^* \boldsymbol{W} \boldsymbol{v}_1} = \sigma_1^2 = \frac{\boldsymbol{v}_1^* \boldsymbol{R}_T^* \boldsymbol{W} \boldsymbol{R}_T \boldsymbol{v}_1}{\boldsymbol{v}_1^* \boldsymbol{W} \boldsymbol{v}_1}. \end{equation}
Rearranging and eliminating  $\boldsymbol {v}^*_n$ we arrive at
 \begin{equation} \boldsymbol{R}_T^* \boldsymbol{W} \boldsymbol{R}_T \boldsymbol{v}_1 = \sigma_1^2 \boldsymbol{W} \boldsymbol{v}_1, \end{equation}
where replacing  $\boldsymbol {R}_T \boldsymbol {v}_1$ with
 $\boldsymbol {u}_1$ and multiplying both sides by
 $\boldsymbol {R}^{-*}_T = \boldsymbol {L}_T^*$ recovers (3.2). Finally, we define a normalization constraint via,
 \begin{equation} \langle \boldsymbol{u}_1, \boldsymbol{u}_1 \rangle_{E} = \boldsymbol{u}_1^* \boldsymbol{W} \boldsymbol{u}_1 = 1.\end{equation}
The last component of the Lagrangian functional is the cost function,
 \begin{equation} \mathcal{J} = \boldsymbol{u}_1^* \boldsymbol{W} \boldsymbol{\psi}_1 \boldsymbol{\psi}_1^* \boldsymbol{W} \boldsymbol{u}_1-l^2\boldsymbol{\mu}_T^*\boldsymbol{M}{\boldsymbol{\mu}_T},\end{equation}
where the first term, representing the primary objective, measures the squared projection, what we term the alignment or agreement, between the dominant SPOD mode,  $\boldsymbol {\psi }_1$, and the first resolvent mode,
 $\boldsymbol {u}_1$. The alignment measure,
 $\boldsymbol {u}_1^* \boldsymbol {W} \boldsymbol {\psi }_1$, is squared to ensure the cost function is real. For brevity, we denote the outer product of the dominant SPOD mode as
 $\boldsymbol {\varPsi }_1 = \boldsymbol {\psi }_1\boldsymbol {\psi }_1^* = \boldsymbol {\varPsi }_1^*$. The cost function may also consider multiple resolvent/SPOD modes by considering a (weighted if desired) sum of the squared alignment terms.
The second term,  $-l^2 \boldsymbol {\mu }_T^* \boldsymbol {M} {\boldsymbol {\mu }_T}$, is a Tikhonov regularization that penalizes values of
 ${\boldsymbol {\mu }_T}$ that do not affect the alignment (high values of
 ${\boldsymbol {\mu }_T}$ diminish the value of
 $\mathcal {J}$), with
 $\boldsymbol {M}$ representing the cylindrical quadrature weights of the grid. As done in standard regularization methods, the value of
 $l^2$ is chosen high enough to remove the values of
 ${{\boldsymbol {\mu }_T}}$ in insensitive regions, but also sufficiently small to not interfere with the primary objective (Hansen & O'Leary Reference Hansen and O'Leary1993). This penalization is effective at minimizing the eddy viscosity in non-turbulent regions of the flow such as the far field. A substantial range of
 $l^2$ values (i.e. multiple orders of magnitude) removes negligible regions of the eddy-viscosity field from the initial field without an observable drop in the primary objective, alignment between
 $\boldsymbol {u}_1$ and
 $\boldsymbol {\psi }_1$.
We now formally construct the Lagrangian functional to include the cost function (3.6), forward equation (3.1), the resolvent eigenvalue problem (3.2), and the normalization constraint (3.5) to give,
 \begin{align} \mathcal{L} &= \boldsymbol{u}_1^* \boldsymbol{W} \boldsymbol{\varPsi}_1 \boldsymbol{W} \boldsymbol{u}_1-l^2\boldsymbol{\mu}_T^*\boldsymbol{M}{\boldsymbol{\mu}_T} \nonumber\\ &\quad - \tilde{\boldsymbol{u}}_1^* (\boldsymbol{L}_T \boldsymbol{u}_1 - \boldsymbol{v}_1 ) - \tilde{\boldsymbol{v}}_1^* ( \boldsymbol{W}\boldsymbol{u}_1 -\sigma_1^2 \boldsymbol{L}_T^*\boldsymbol{W} \boldsymbol{v}_1 ) - \tilde{\sigma}_1 ( \boldsymbol{u}_1^* \boldsymbol{W} \boldsymbol{u}_1 - 1 ) +\textrm{c.c.}, \end{align}
where  $( \tilde {\boldsymbol {u}}_1, \tilde {\boldsymbol {v}}_1, \tilde {\sigma }_1)$ are Lagrange multipliers,
 $\tilde {\sigma }_1$ is real valued (as the corresponding constraint is real) and c.c. is the complex conjugate. This results in a functional that depends on seven variables,
 \begin{equation} \mathcal{L} ( [ \boldsymbol{u}_1, \boldsymbol{v}_1 , \sigma_1], [ \tilde{\boldsymbol{u}}_1 , \tilde{\boldsymbol{v}}_1, \tilde{\sigma}_1 ], \boldsymbol{\mu}_T). \end{equation}
We can find the maximum of the cost function by finding the stationary point of the entire functional (i.e. where variations with respect to each variable are zero). Stationarity with respect to the Lagrange multipliers yields the state equations, which are by definition satisfied, while stationarity with respect to the state variables yields
 \begin{gather} \frac{\partial \mathcal{L}}{\partial \boldsymbol{u}_1} \delta \boldsymbol{u}_1 = ( 2 \boldsymbol{W} \boldsymbol{\varPsi}_1 \boldsymbol{W} \boldsymbol{u}_1 - \boldsymbol{L}_T^* \tilde{\boldsymbol{u}}_1 - \boldsymbol{W} \tilde{\boldsymbol{v}}_1 - 2 \tilde{\sigma}_1 \boldsymbol{W} \boldsymbol{u}_1)^* \delta \boldsymbol{u}_1 = 0, \end{gather}
 \begin{gather}\frac{\partial \mathcal{L}}{\partial \boldsymbol{v}_1} \delta \boldsymbol{v}_1= (\tilde{\boldsymbol{u}}_1 + \sigma_1^2 \boldsymbol{W} \boldsymbol{L}_T \tilde{\boldsymbol{v}}_1)^*\delta \boldsymbol{v}_1 = 0, \end{gather}
 \begin{gather}\frac{\partial \mathcal{L}}{\partial \sigma_1} \delta {\sigma}_1= (\tilde{\boldsymbol{v}}_1^* \boldsymbol{L}_T^* \boldsymbol{W} \boldsymbol{v}_1)^* \delta \sigma_1 = 0, \end{gather}
and the condition in the last equation may be simplified into  $\tilde {\boldsymbol {v}}_1^* \boldsymbol {L}_T^* \boldsymbol {W} \boldsymbol {v}_1 = \tilde {\boldsymbol {v}}_1^* \boldsymbol {W}{\boldsymbol {u}}_1$ using (3.2). The stationary point is subsequently met by constructing the following system of equations and solving for the Lagrange multipliers
 \begin{equation} \begin{bmatrix} - \boldsymbol{L}_T^* & -\boldsymbol{W} & - 2 \boldsymbol{W} \boldsymbol{u}_1 \\ \boldsymbol{W}^{{-}1} & \boldsymbol{L}_T \sigma_1^2 & 0 \\ 0 & \boldsymbol{u}_1^* \boldsymbol{W} & 0 \end{bmatrix} \begin{bmatrix} \widetilde{\boldsymbol{u}_1}\\ \widetilde{\boldsymbol{v}_1} \\ \tilde{\sigma}_1 \end{bmatrix} = \begin{bmatrix} - 2 \boldsymbol{W} \boldsymbol{\varPsi}_1 \boldsymbol{W} \boldsymbol{u}_1 \\ 0 \\ 0 \end{bmatrix}. \end{equation}
The upper left  $2\times 2$ block is degenerate due to the state (3.1) and (3.2) (the couple,
 $\tilde {\boldsymbol {u}}_1=\boldsymbol {W}\boldsymbol {v}_1$ and
 $\tilde {\boldsymbol {v}}_1=-\sigma _1^{-2}\boldsymbol {u}_1$, is in the null space of this block) and the third column and line regularizes this system. Combining the three equations, one can show that
 $\tilde {\sigma }_1= \boldsymbol {u}_1^*\boldsymbol {W} \boldsymbol {\varPsi }_1 \boldsymbol {W} \boldsymbol {u}_1$, proving that
 $\tilde {\sigma }_1$ is a real value.
Optimization

A final variation is taken with respect to the eddy viscosity,  ${\boldsymbol {\mu }_T}$ (which may be a scalar or vector quantity), providing the direction of gradient ascent for the eddy-viscosity field,
 \begin{align} \frac{\partial \mathcal{L}}{\partial {\boldsymbol{\mu}_T}}{\delta {\boldsymbol{\mu}_T}} &={-} \tilde{\boldsymbol{u}}_1^* \left( \frac{\partial \boldsymbol{L}_T}{\partial {\boldsymbol{\mu}_T}} {\delta {\boldsymbol{\mu}_T}}\right)\boldsymbol{u}_1 + \sigma_1^2 \tilde{\boldsymbol{v}}_1^* \left( \frac{\partial \boldsymbol{L}_T^*}{\partial {\boldsymbol{\mu}_T}} {\delta {\boldsymbol{\mu}_T}}\right) \boldsymbol{W} \boldsymbol{v}_1 - 2l^2 \boldsymbol{\mu}_T^* \boldsymbol{M} {\delta {\boldsymbol{\mu}_T}}+\textrm{c.c.} \end{align}
 \begin{align} &=\left(\frac{\textrm{d}\mathcal{J}}{\textrm{d}{\boldsymbol{\mu}_T}}\right)^*\boldsymbol{M}\delta{\boldsymbol{\mu}_T}. \end{align}
The gradient at the  $k$th grid point is then
 \begin{equation} \left.\frac{\textrm{d}{\mathcal{J}}}{\textrm{d}\boldsymbol{\mu}_T}\right|_k=\boldsymbol{M}_{km}^{{-}1}(-\boldsymbol{u}_{1,j}^* \boldsymbol{L}_{m,ij}^*\tilde{\boldsymbol{u}}_{1,i}+\sigma_1^2\boldsymbol{W}_{lj}\boldsymbol{v}_{1,l}^* \boldsymbol{L}_{m,ji}\tilde{\boldsymbol{v}}_{1,i})-2l^2 \boldsymbol{ \mu}_{T,k}+\textrm{c.c.}, \end{equation}
where  $\boldsymbol {L}_{m,ij} = \mbox {lim}_{\epsilon \rightarrow 0} (({\boldsymbol {L}_{T+\epsilon \delta \boldsymbol {\mu }_{m},ij}-\boldsymbol {L}_{T,ij}})/{\epsilon }), \delta \boldsymbol {\mu }_{m}$ being a null vector except at the
 $m$th position where it is equal to 1. This tensor may be obtained either through automatic differentiation of
 $\boldsymbol {L}_T$ with respect to
 ${\boldsymbol {\mu }_T}$ or by finite differences. Full storage of such tensors is not an issue when finite differences, finite volumes or finite elements are used for the spatial discretization as the resulting tensors are extremely sparse.
The updated optimization parameter is then
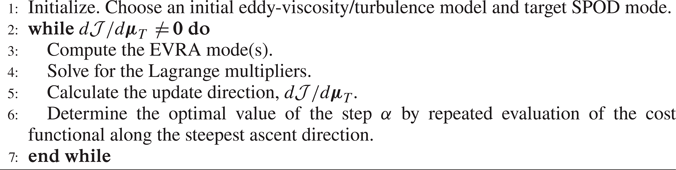
 \begin{equation} \boldsymbol{\mu}_T^{(k+1)} = \boldsymbol{\mu}_T^{(k)} + \alpha \frac{\textrm{d}\mathcal{J}}{\textrm{d}\boldsymbol{\mu}_T}, \end{equation}
where  $k$ is the iteration number and
 $\alpha$ is a step size determined through a root finding algorithm or a line search. If multiple SPOD/resolvent modes are considered for the optimization, then one has to solve (3.12) for each couple
 $[\boldsymbol {\varPsi }_n, (\boldsymbol {v}_n,\boldsymbol {u}_n, \sigma _n) ]$ and the total gradient
 ${\textrm {d}\mathcal {J}}/{\textrm {d}\boldsymbol {\mu }_T}$ is the sum of each individual gradient, while the line search for
 $\alpha$ is performed considering the full cost functional. Although considering multiple modes is theoretically straightforward (and we present one example in § 6), there are two practical issues. Each additional mode brings further complexity to the gradient, increasing computation time, and the quality of SPOD modes,
 $\boldsymbol {\varPsi }_n$, become increasingly noisy with
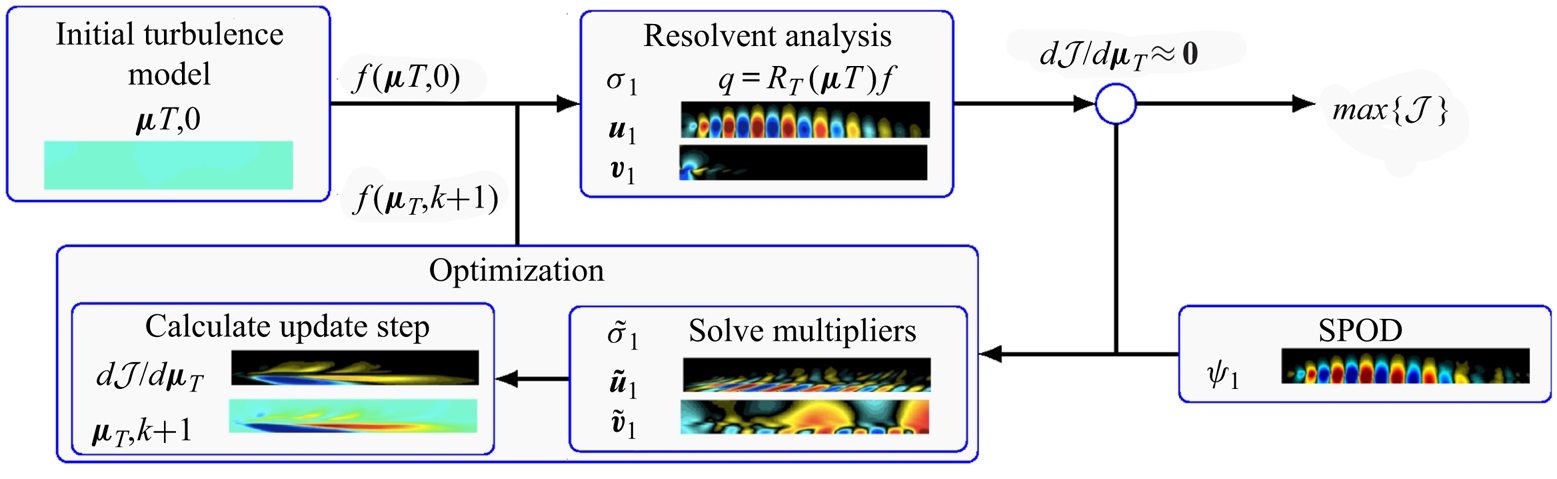
 $n$, thus rendering gains via the optimization as marginal. We discuss the latter issue in more detail throughout the manuscript. Figure 1 presents a schematic of the above optimization framework, including graphical examples from the optimal eddy-viscosity field case at
 $St = 0.6$,
 $m=0$ and
 $M_j = 0.4$.
Schematic of the optimization framework for determining the optimal eddy-viscosity field that maximizes the alignment/agreement between computed resolvent modes,  $\boldsymbol {u}_1$, and educed SPOD modes,
 $\boldsymbol {\psi _1}$. Included graphics are from implementation of the full-field eddy-viscosity model at
 $St=0.6$,
 $m=0$, and
 $M_j=0.4$.
For some cases, the optimization step imparts a region of negative effective viscosity (i.e.  $-\mu _T > \mu _j$) presenting a challenge in both the physical interpretation and the numerical stability of the resolvent operator. However, negative eddy viscosity is not a unique concept to the algorithm presented. Literature surrounding eddy-viscosity models used in RANS and LES, where the eddy and effective viscosities are identical, attribute physical interpretations of negative eddy viscosity to backscattering of turbulent energy, which, in many simulations, results in unstable simulations (Ghosal et al. Reference Ghosal, Lund, Moin and Akselvoll1995). Common treatment of a negative eddy viscosity has included filtering operations, ensemble averaging in homogeneous directions, and ad hoc clipping of the eddy-viscosity field (Vreman Reference Vreman2004), while inferences of the eddy-viscosity field via a Boussinesq approximation of data are often regularized to remove negative regions (e.g. Semeraro et al. Reference Semeraro, Lesshafft, Jaunet and Jordan2016b). Here, we similarly elect to remove any negative effective viscosity using a simple clipping strategy by setting any negative regions to the molecular value. Although a reduction of effective viscosity below the molecular viscosity is theoretically possible, we found that permitting the optimization to do so either led to numerical instabilities or negligible improvements in alignment.
The topology of the proposed cost function is complex, as  $\boldsymbol {\mu }_T$ involves many degrees of freedom, and our optimizer may return a local rather than global maximum. Therefore, a complete assessment of the sensitivity of initial conditions or demonstration of a global maximum is intractable, but the relative insensitivity of the results to initial guesses and the fact that no other considered method outperforms the full optimization (shown later in figure 4) provides confidence in the robustness of the maxima achieved. For all of the results presented here, we use the optimal constant eddy-viscosity field results (introduced in § 3.4) as the initial condition for the full-field optimizations.
Finally, the above optimization is derived considering the full (perturbation) state as the output. The formulation is similar if the input and output spaces are restricted, as shown in Appendix C. Such an extension is of particular use for experiments, or coarse simulations, where observed data may be sparse.
3.2. Mean-flow consistent eddy-viscosity model
For many experimental and numerical datasets, including the LES databases used here, an eddy-viscosity field is absent. We circumvent this issue by finding the eddy-viscosity field that minimizes the error to which the mean flow satisfies the (zero frequency and axisymmetric wavenumber) linearized Navier–Stokes equations, supplemented with an eddy-viscosity model, provided in Appendix B. To do so, we find an eddy-viscosity field that minimizes the residual  $\bar {\boldsymbol {f}}$ given by
 \begin{equation} \boldsymbol{L}_T\bar{\boldsymbol{q}} = \bar{\boldsymbol{f}}. \end{equation}
Thus we define the cost function,
 \begin{equation} \mathcal{J} ={-}\bar{\boldsymbol{f}}^* \boldsymbol{W} \boldsymbol{\bar{\boldsymbol{f}}}, \end{equation}
and develop a Lagrangian functional with the forward equation as the only additional constraint to give
 \begin{equation} \mathcal{L} ={-}\bar{\boldsymbol{f}}^* \boldsymbol{W} \boldsymbol{\bar{\boldsymbol{f}}} - \tilde{\boldsymbol{u}}^* (\boldsymbol{L}_T\bar{\boldsymbol{q}} - \bar{\boldsymbol{f}}). \end{equation}
Variations with respect to the residual are
 \begin{equation} \frac{\partial \mathcal{L}}{\partial \bar{\boldsymbol{f}}}\delta\bar{\boldsymbol{f}} = (- 2 \boldsymbol{W} \bar{\boldsymbol{f}} + \tilde{\boldsymbol{u}})^*\delta\bar{\boldsymbol{f}} = 0, \end{equation}
and we may directly solve for the Lagrange multipliers as,
 \begin{equation} \tilde{\boldsymbol{u}}={-} 2\boldsymbol{W} \bar{\boldsymbol{f}}. \end{equation}
Then by taking variations with respect to the eddy-viscosity field gives,
 \begin{equation} \frac{\partial \mathcal{L}}{\partial \boldsymbol{\mu}_T} \delta \boldsymbol{\mu}_T={-} 2 (\boldsymbol{W}\bar{\boldsymbol{f}})^* \left( \frac{\partial \boldsymbol{L}_T}{\partial \boldsymbol{\mu}_T}\delta\boldsymbol{\mu}_T\right)\bar{\boldsymbol{q}}. \end{equation}
Similar to (3.15), we obtain the update step
 \begin{equation} \left.\frac{\textrm{d}{\mathcal{J}}}{\textrm{d}\boldsymbol{\mu}_T}\right|_k={-}2\boldsymbol{M}_{km}^{{-}1}\bar{\boldsymbol{q}}_{j} \boldsymbol{L}_{m,ij}\boldsymbol{W}_{il} \,\bar{\boldsymbol{f}}_{l}, \end{equation}
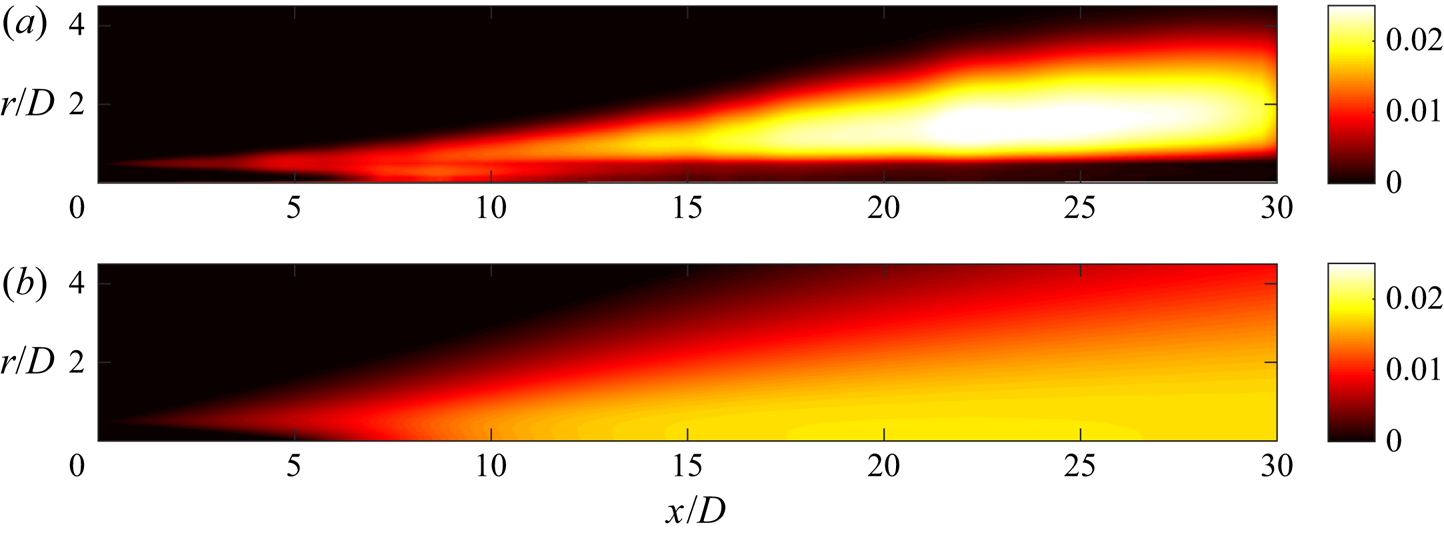
and find the field via a line search. These steps are described in greater detail in the preceding subsection § 3.1. Figure 2(a) provides the eddy-viscosity field that optimally minimizes the residual of the mean-flow solution. The associated residual field for this model reduced errors to approximately 10 % of the original residual field, with the exception where the shear layer is thin near the nozzle. The thin shear-layer region improved by only  $\approx$50 %, but as shown later in the manuscript, modes in this region are generally less sensitive to the eddy-viscosity field.
(a) Mean-flow consistent eddy-viscosity model computed at zero frequency and azimuthal wavenumber. (b) Eddy-viscosity field computed via a RANS simulation for the  $M_j = 0.4$ jet,
 $c=1$.

We refer to this model as the mean-flow consistent eddy-viscosity model, and we optimally tune this field at each frequency by introducing the coefficient,  $c$,
 $\boldsymbol {\mu }_T = c \boldsymbol {\mu }_{T,Mean}$. Our interest in the value of
 $c$ is not to propose a functional of its frequency dependence (or assign to it a physical meaning), but to measure and observe the overall variation and help determine whether a frequency independent coefficient might suffice.
3.3. RANS-based eddy-viscosity field
We compute steady-state RANS solutions for each case to assess the applicability of the associated eddy-viscosity field for resolvent analysis. For simplicity, we perform the RANS computations in Fluent. The 2D axisymmetric grid extends 40 diameters in the streamwise directions and 20 diameters in the radial direction with grid spacing mirroring that of the interpolated LES grid scaled to be four times finer, giving  $3 \times 10^5$ grid points. We set the inlet boundary conditions to the base-flow profile from the LES simulations and use the standard 2-equation
 $k-\epsilon$ model (Launder & Spalding Reference Launder and Spalding1983) for turbulence modelling. Coefficients used for the model are variants of those suggested by Thies & Tam (Reference Thies and Tam1996), with turbulent viscosity coefficient
 $C_\mu = 0.0874$, dissipation transport coefficients
 $C_{\epsilon 1} = 1.4$ and
 $C_{\epsilon 2} = 2.02$, turbulent Prandtl numbers for kinetic energy
 $\sigma _k = 0.324$ and dissipation
 $\sigma _\epsilon = 0.377$, and the turbulent Prandtl number
 $Pr_T = 0.422$. However, the standard
 $\kappa -\epsilon$ model provided in ANSYS does not incorporate the Pope (Reference Pope1978) and Sarkar et al. (Reference Sarkar, Erlebacher, Hussaini and Kreiss1991) correction terms used in Thies & Tam (Reference Thies and Tam1996), requiring a calibration of the mean-flow quantities by introducing a scaling constant
 $a$ to
 $C_\mu = 0.0874 / a$,
 $\sigma _K = 0.324 / a$ and
 $\sigma _\epsilon = 0.377 / a$.
RANS mean-flow quantities closely match those of the LES for each of the three turbulent jets using values for  $a$ of 1.2, 1.3 and 1.575, for
 $M_j = 0.4$,
 $0.9$ and 1.5, respectively. While tuning of the constant
 $a$ to match LES is not in the spirit of obtaining a universal RANS model, we do so here to give the RANS-generated eddy-viscosity field the best chance at being consistent with the LES results from which the SPOD modes were educed. For a full assessment of the accuracy of RANS predictions for turbulent jets, we refer the reader to Thies & Tam (Reference Thies and Tam1996) and Georgiadis, Yoder & Engblom (Reference Georgiadis, Yoder and Engblom2006).
Figure 2(b) presents the RANS-predicted eddy-viscosity field for the  $M_j = 0.4$ jet, and figure 3 shows near identical agreement with the mean LES streamwise flow. We observe similar agreement in radial velocity, density and turbulent kinetic energy, and also find close agreement for the
 $M_j=0.9$ and 1.5 jets; we do not show these results for brevity. For determination of the optimal RANS-based eddy-viscosity field at each frequency, we take the computed eddy-viscosity fields,
 \begin{equation} \boldsymbol{\mu}_{T,RANS} = \bar{\rho} C_\mu \frac{k^2}{\epsilon}, \end{equation}
and introduce the coefficient,  $c$,
 $\boldsymbol {\mu }_T = c \boldsymbol {\mu }_{T,RANS}$ (just as in § 3.2). This final relation underscores the difference between the traditional use of eddy viscosity with RANS and ours via resolvent analysis. In the former context, eddy viscosity accounts for all perturbations, while in resolvent analysis, the eddy viscosity is intended to model the effect of nonlinear, triadic interactions and the background turbulence on the linear structures. Thus, a coefficient of
 $c<1$, for resolvent analysis, presents an eddy viscosity that omits a fraction of the overall eddy-viscosity field. As will be shown, we find all optimal values for
 $c$ to be less than unity. This interpretation may also be applied to the mean-flow consistent eddy-viscosity field presented in the previous sub-section.
Mean-flow profiles of both the  $M_j = 0.4$ LES and RANS, where the RANS simulation was tuned to best match the LES mean flow. (a) Presents the streamwise mean velocity at three radial locations,
 $r/D =$
 0.25,
 0.5,
 1, vs streamwise distance from the nozzle, while (b) gives the streamwise mean velocity at three streamwise locations,
 0.5,
 5,
 10, vs radial distance.

3.4. Constant eddy-viscosity field
Finally, we consider a simple, constant eddy viscosity,  $\boldsymbol {\mu }_T = 1/ {Re}_T$. We primarily investigate this model because of its use in many turbulent jet studies that used a Reynolds number based either upon the molecular viscosity (Jeun et al. Reference Jeun, Nichols and Jovanović2016; Lesshafft et al. Reference Lesshafft, Semeraro, Jaunet, Cavalieri and Jordan2019), of the order of
 $10^5-10^6$, or through an effective turbulent viscosity (Garnaud et al. Reference Garnaud, Lesshafft, Schmid and Huerre2013; Schmidt et al. Reference Schmidt, Towne, Rigas, Colonius and Brès2018), of the order of
 $10^3-10^4$. These, quite different, choices inevitably provided discrepancies in amplification gains and mode shapes across each study, particularly at low frequencies (i.e.
 $St < 0.3$ for
 $m=0$) – showing that the Reynolds stresses have a substantial impact on resolvent analyses of turbulent jets. Here, we find the optimal
 ${Re}_T$ at each frequency and azimuthal mode number by a line search.
4. Optimal SPOD and resolvent mode alignment
In this section, we present modes predicted by the various EVRA models presented in the previous section. We focus on the axisymmetric disturbances,  $m=0$, for the
 $M_j=0.4$ jet, and report results for other azimuthal modes and jet Mach numbers in § 7. We performed optimizations over the frequency range
 $St \in [0.05,1]$, resulting in the alignment coefficients displayed in figure 4, with alignment defined as
 $|\boldsymbol {\psi }_1^* \boldsymbol {W} \boldsymbol {u}_1|$. This metric not only represents how similar the spatial structures, represented as complex eigenfunctions, are between the dominant resolvent and SPOD modes, but also measures the similarity in distribution of energy amongst the five state variables. A value of 1 signifies perfect agreement, giving both identical agreement in structure and distribution of energy in the state variables. Typically, in this metric, values of approximately 0.4 or greater show qualitative agreement, whereas values less than 0.4 have little visual similarity.
(a) Optimal alignments for all methods investigated including the baseline case,  ${Re}_T = 3 \times 10^4$. (b) SPOD eigenvalue spectra of the first five modes for
 $m=0$, including the 95 % confidence intervals and the modes associated with the KH and Orr mechanisms.

Figure 4(a) shows that throughout the frequency range considered, the alignments improve considerably from the baseline case (constant eddy viscosity with  ${Re}_T = 3 \times 10^4$). The alignment is best for
 $St >0.3$, which corresponds to the frequencies where the jet has a strong, low-rank Kelvin–Helmholtz (KH) response (Schmidt et al. Reference Schmidt, Towne, Rigas, Colonius and Brès2018), as highlighted by figure 4(b), presenting the spectra of the first five SPOD modes and their 95 % confidence interval. For this region,
 $St>0.3$, the baseline case gives reasonable (¿ 75 % alignment) results, nonetheless, the eddy-viscosity models still improve the modes to nearly perfect alignment. At lower frequencies,
 $St \leq 0.3$, we find the most dramatic increase in alignments, from approximately 10 % to 80 %. These substantial improvements, at
 $St \leq 0.3$, coincide with a change of mode type, from KH to Orr (Schmidt et al. Reference Schmidt, Towne, Rigas, Colonius and Brès2018), a viscous, non-modal instability mechanism sensitive to Reynolds number (with rapidly increasing amplification as Reynolds number increases), that dominates the non-optimized, low-frequency and subdominant regions of the resolvent spectrum for the
 $M_j = 0.4$ jet. We also find that the optimal eddy-viscosity field provides the greatest alignment among the models, which is at least suggestive that the optimization achieved a global maximum.
Surprisingly, the other eddy-viscosity models produce alignments close to the optimal eddy-viscosity field. The constant eddy-viscosity is nearly optimal at lower frequencies (Orr-type modes), whereas the RANS and optimal mean-flow eddy-viscosity models are more nearly optimal at higher ones. We stress that in the optimal mean-flow, RANS and constant  $\boldsymbol {\mu }_T$ models, a different optimal value of the coefficient (i.e.
 $c$ and
 ${Re}_T$) is used at each frequency. We defer a discussion of the sensitivity of these coefficients to § 7.1.
Starting with the lowest frequency,  $St=0.05$, we now investigate the mode shapes associated with the improved resolvent alignments achieved with the optimized eddy-viscosity models. Figure 5 displays the real part of the fluctuating field for all state variables for the dominant SPOD and resolvent modes, comparing resolvent results using both the optimal eddy-viscosity field and the baseline case with constant
 ${Re}_T = 3 \times 10^4$. It is immediately apparent that the optimal eddy-viscosity resolvent mode can closely match the observed mode shapes from SPOD for all variables (including the correct distribution of energy), while the baseline resolvent mode bears little resemblance to the SPOD modes for any of the variables.
Real component of the fluctuating response state variables,  $\boldsymbol {q}^{\prime }= [\rho , u_x, u_r, u_\theta , T]$, and pressure,
 $p$, at
 $St = 0.05$,
 $m=0$. The columns display SPOD
 $(\boldsymbol {\psi }_1)$, optimal eddy viscosity (
 $\boldsymbol {u}_1$), and baseline (
 $\boldsymbol {u}_1$) modes from left to right, respectively. Contours (in red, black and blue) are given by
 $\pm 0.5\|\boldsymbol {\psi }_1: \cdot \|_\infty$ of the SPOD mode, where
 $\cdot$ is the fluctuating variable in question (with
 $\|\boldsymbol {\psi }_1:\cdot \|_\infty$ values:
 $[\rho , u_x, u_r, u_\theta , T, p] = [2.8, 198.6, 46.0, 37.2, 1.2, 10.4] \times 10^{-3}$).

Despite the increased alignment, there remains an obvious mismatch in  $u_\theta '$ between the SPOD and resolvent modes, highlighting a statistical limitation to our approach. For the axisymmetric wavenumber,
 $m=0$, perturbations in the azimuthal velocity must be zero. Both resolvent models meet this constraint, however, the SPOD mode does not. One should then view the non-zero component in the SPOD mode as a statistical error. Compared to the streamwise velocity,
 $u_\theta '$ is approximately five times smaller in magnitude, and lacks the coherent wavepacket structure of the other variables. The corresponding
 $u_\theta '$ contribution in the projection coefficient
 $|\boldsymbol {\psi }_1^* \boldsymbol {W} \boldsymbol {\psi }_1|$ is
 $\approx 0.08$, bounding the physical maximum of the optimization to
 $|\boldsymbol {\psi }_1^* \boldsymbol {W} \boldsymbol {u}_1| \leq 0.92$ without considering additional error in the other variables. We link these statistical errors to the weak low-rank behaviour with this frequency, where there is little eigenvalue separation between the dominant and subdominant modes (Schmidt et al. Reference Schmidt, Towne, Rigas, Colonius and Brès2018). We may then view the projection-coefficient value of 0.08 as a kind of error bar on the alignments produced by the optimal eddy-viscosity field, as it is attempting to align to a mode shape that is (at this frequency) in error by as much as approximately10 %.
The pressure field, a quantity of particular interest for jet noise, provides a relatively simple representative mode shape for each case. We proceed by visualizing only the fluctuating pressure component for the rest of the study, however, the projection coefficients,  $|\boldsymbol {\psi }_1^* \boldsymbol {W} \boldsymbol {u}_1|$, account for the full-state results. Further, for all response pressure modes presented, we see similar trends and improvements in all flow variables similar to figure 5.
Figure 6 shows the pressure modes at two low frequencies,  $St=0.05$ and 0.2, and compares the results for all considered eddy-viscosity models. The top row shows the dominant SPOD mode from the LES, the second row gives the dominant resolvent mode for the baseline case, and the remaining rows provide the four optimized models. At low frequencies, the baseline resolvent analysis cannot capture the observed mode shapes, while the optimized eddy-viscosity models have much better alignment with SPOD. The EVRA models increase the projection coefficients by as much as 10-fold and display a wavepacket structure consistent with the SPOD mode. Orr-type modes dominate the low-frequency (i.e.
 $St < 0.3$) baseline resolvent spectrum (Schmidt et al. Reference Schmidt, Towne, Rigas, Colonius and Brès2018), and we see that the eddy viscosity attenuates these modes in favour of a KH-like response that peaks further upstream, consistent with the observed SPOD modes.
Real component of the response pressure fluctuations (in red, black and blue,  $\pm 0.5\|\boldsymbol {\psi }_1:p\|_\infty$) for
 $St=0.05$ and
 $St=0.2$ in the left and right columns, respectively. Row 1 presents the dominant SPOD mode for which the optimization seeks to match. The following rows present results for the baseline, optimal eddy-viscosity field, mean-flow consistent model, RANS eddy-viscosity model and the optimal turbulent Reynolds number.

Proceeding to higher frequencies, figure 7 displays the dominant fluctuating pressure modes for SPOD and the five EVRA models for  $St = 0.6$ and 1. The baseline projection coefficients are already high for these frequencies, but are further increased with the eddy-viscosity models, reaching 96 % for the optimal eddy viscosity. Here the differences in the mode shapes are subtle, with the streamwise extent of the modes shortening from the baseline case to better match the SPOD at both frequencies. At these higher frequencies, the jet response is a clear, low-rank KH wavepacket (a modal, inviscid stability mechanism), and it is thus unsurprising that the results are relatively insensitive to the precise eddy-viscosity model. However, the improved alignment is a product of the non-zero eddy-viscosity field, showing that a turbulence model is still important.
Real component of the response pressure fluctuations for  $St=0.6$ and
 $St=1$ in the left and right columns, respectively. Rows present the equivalent methods as described in figure 6.

For  $St=1$, the optimized projection coefficient is falling compared to the
 $St=0.6$ case. This is due to the emergence of Orr-type modes with similar energy as the KH modes. When performing SPOD in limited domains near the nozzle exit, the modal, low-rank KH response continues to dominate at much higher frequencies in the near nozzle region (Sasaki et al. Reference Sasaki, Cavalieri, Jordan, Schmidt, Colonius and Brès2017), but when considering the global response, the KH response becomes inferior, in energy, to the Orr response, which peaks further downstream.
5. Analysis of the optimized eddy-viscosity fields
The previous section shows that the EVRA approach results in substantial alignment of the dominant resolvent and SPOD modes. In this section, we examine the optimal parameters associated with the eddy-viscosity fields to investigate how the eddy viscosity improved the alignment and to identify potential universalities in modelling coefficients.
5.1. Structure of the eddy-viscosity fields
For the constant eddy-viscosity, RANS-based and mean-flow consistent eddy-viscosity fields, the optimization is over a single value, and we plot the optimal values as a function of frequency (still for  $m=0$) in figure 8(a,c,d) and the maximum value of the optimal field in 8(b). We investigated several other metrics for the optimal field and each metric provided similar trends and therefore, we chose
 $\|{\boldsymbol {\mu }_T}\|_{\infty }$, as it gave the most intuitive comparison against the other scalar quantities. For all models, the frequency dependence of the values is similar, with three regions of interest:
 $St \in [0.05,0.3]$,
 $St = \in [0.3,0.8]$ and
 $St \in [0.8,1]$.
The optimal parameters across  $St \in [0.05,1]$ for (a) the optimal constant field
 $1/{Re}_T$, (b) optimal eddy-viscosity field model, (c) the mean-flow consistent model and (d) the optimal RANS model. The optimal eddy-viscosity field parameter shown is the maximum value of the field at each frequency,
 $\|{\boldsymbol {\mu }_T}\|_{\infty }$, while the latter two models present the optimal coefficient
 $c$. The associated alignments for each model/parameter are shown in figure 4.

In the low-frequency region, the baseline jet response comprises of spatially extensive Orr-type modes that have a strong Reynolds number dependence, requiring a relatively larger eddy viscosity to damp them. For  $St=0.05$ the ratio of the optimal effective Reynolds number to the molecular Reynolds number is
 $\boldsymbol {\mu }_T/\mu _j \approx 13\ 500$, a four orders of magnitude difference when compared to the molecular viscosity.
In the moderate-frequency regime, where the baseline spectrum transitions from the broadband, viscous Orr mechanism to the low-rank, inviscid KH mechanism, eddy viscosity becomes less important, and we expect (confirming below, in § 7.1) insensitivity to the overall value based on the relatively favourable alignment achieved in the baseline case. As frequency increases, the responses transition back to a mix of KH and Orr-type waves, with a progression towards broadband, viscous Orr modes at higher frequency.
At these higher frequencies, we see that the low-frequency dependence on inverse effective Reynolds number resumes, similar to low the frequencies. Interestingly, this trend shows that at higher frequencies  ${Re}_T \rightarrow Re_j$ such that the effect of eddy viscosity ‘turns off’ as frequency increases and the associated wavepacket wavelength becomes small (i.e. approaching finer-scale turbulence), as expected on physical grounds.
Similar trends are observed for the mean-flow consistent and RANS eddy-viscosity coefficients. For both eddy-viscosity fields,  $c$ is less than unity and only varies from 0.7 to 0.1 with a few exceptions. These values suggest that the optimal eddy-viscosity model is a fraction of the total RANS or mean-flow consistent eddy-viscosity models that integrate all perturbations.
For the full-field eddy-viscosity optimization, we stress that its primary purpose is to determine what may be an upper bound for how well any eddy-viscosity model could perform. Given that the alignments between the resolvent and SPOD modes were not significantly higher for the optimized scheme than for the modelled eddy-viscosity approaches (with optimal parameters), the detailed eddy-viscosity fields are of lesser importance. Still, some aspects of the physics, such as the spatial locations where Reynolds stresses become important for each frequency, are apparent in the optimized fields. Figure 9 presents the optimized fields for two selected Strouhal numbers, comparing them to both the RANS and mean-flow consistent eddy-viscosity fields scaled by their optimal coefficient  $c$ at each frequency. In addition, the dominant resolvent mode, computed with the displayed optimal eddy-viscosity field, is shown for comparison with the eddy-viscosity fields. The contours for the eddy-viscosity fields are set from 0 to the maximum value of the
 $St = 0.6$ optimal eddy-viscosity field.
Comparisons of the optimal eddy-viscosity fields (i.e. full-field optimal, mean-flow consistent and RANS) and the associated dominant resolvent mode found via the optimization for  $St = 0.2$ and
 $0.6$. Contours for all six eddy-viscosity fields are set from 0 to
 $3 \times 10^{-3}$.

Overall, both frequencies present optimal eddy-viscosity fields that are complex, unsurprising given the ability of the optimization to choose any eddy-viscosity field, constrained only by the structure of the equations and positivity. The optimal eddy-viscosity fields pinpoint the locations where linear structures break down (i.e. where nonlinearities/Reynolds stresses become important) and inform what features an eddy-viscosity model must include. In both cases, the optimization removes viscosity from the potential core (i.e. the interior region of the jet relative to the critical layer), when compared to the initial guess, while increasing the turbulent viscosity just outside of the critical layer. The increase in eddy-viscosity is most often observed just downstream of the peak amplitude of the wavepacket, coinciding with each wavepacket's decay downstream.
Although not entirely clear from figure 9, these findings are reasonably consistent with each of the modelled eddy-viscosity fields when restricting the view to the region where the resolvent/SPOD mode has significant amplitude. We can see that both the RANS and mean-flow consistent eddy-viscosity fields present similar features as the optimal field, explaining the ability of each model to achieve nearly optimal results. We will show in the following section how such features also explain the ability of the RANS and mean-flow consistent models to predict the subdominant modes, which require further turbulence modelling downstream.
6. Alignment of subdominant modes
Although the optimization presented only aligns the dominant SPOD and resolvent modes, subdominant modes are also of interest, particularly as they are necessary to reconstruct flow statistics in the near field and are relevant for modelling coherence decay associated with the ‘jittering of wavepackets’ to produce sound (Cavalieri et al. Reference Cavalieri, Jordan, Agarwal and Gervais2011). In this section we seek to answer two questions: whether alignment with only the dominant mode substantially alters the alignment of the subdominant modes and the effect of expanding the optimization to subdominant modes. We first assess the former case using the optimal parameters for each method. We show the computed subdominant modes in figure 10 for modes 2 and 3 for the  $St = 0.6$,
 $m=0$ frequency–wavenumber pair.
Subdominant modes 2 and 3 at  $St = 0.6, m=0$ in the left and right columns respectively for SPOD, baseline and all EVRA models.

Comparing the second mode to the baseline case ( ${Re}_T = 3 \times 10^4$), we find that all EVRA models give significantly improved alignments, reaching
 $\approx$70 % for the RANS and mean-flow consistent models. Both the RANS and mean-flow consistent models are superior to the optimal eddy-viscosity field, which is only fitted to align the dominant mode. The RANS and mean-field models are also superior for the third, fourth, and fifth modes (the latter two not shown for brevity), but with an alignment that falls off with increasing mode number.
To observe how well the optimization of the first SPOD mode models the forcing statistics (i.e. diagonalizes the forcing CSD  $\boldsymbol {S}_{\boldsymbol {ff}}$), we compare projections of the first five SPOD modes with the first five modes from each eddy-viscosity method (including a 2-mode optimization described next) in figure 11. The plots show that the EVRA models, in particular the RANS and mean-flow consistent models, are superior at diagonalizing the CSD when compared to the baseline case.
Projections of the first five SPOD modes into the first five resolvent modes computed for all EVRA models at  $St=0.6, m=0$, including the 2-mode optimization shown in figure 12.

Although the optimal eddy-viscosity field, aligned only with the dominant SPOD mode, shows improvements in the subdominant modes, we can extend the optimization to align an arbitrary number of subdominant modes and achieve alignment superior to any eddy-viscosity model. However, convergence issues with increasing SPOD mode number suggest that optimizing for many modes (e.g.  $n>5$) would have marginal returns. For this study, we present only the optimization of both the first and second modes at
 $St = 0.6$,
 $m=0$ to show the generality of the optimization framework and the physical implications of the associated eddy-viscosity field for the subdominant modes.
Figure 12 presents the aligned resolvent mode via the optimization and the associated eddy-viscosity field for the first subdominant mode. By including the second SPOD mode, the optimization can achieve an alignment of 77 %, superior to any of the other eddy-viscosity models, without altering the alignment of the dominant mode, 96 %. We also observe that the remaining subdominant modes also increase in their projections, as shown in figure 11. This observation is likely linked to the difference in mechanisms of the dominant and subdominant modes at  $St = 0.6$,
 $m=0$. The dominant mode is KH-type, while the subdominant modes are of Orr type. By aligning just the first Orr-type mode, we observe improved alignments for the entire family of Orr modes, conversely, alignment of only the KH mode does not substantially improve Orr modes.
The second subdominant mode at  $St=0.6$ and the associated eddy-viscosity field that provides the optimal alignment for both modes. The contour for the eddy-viscosity field is set to the same value as those shown in figure 9 from 0 to
 $3\times 10^{-3}$.

The increase in alignment results from additional eddy viscosity located downstream of the 1-mode, KH-type field,  $\boldsymbol {\mu }_{T,1}$, shown in figure 9. The second mode imposes a need for further eddy viscosity acting further downstream and towards the centreline, as representative of the Orr mechanism at
 $m=0$ for turbulent jets (Pickering et al. Reference Pickering, Rigas, Nogueira, Cavalieri, Schmidt and Colonius2020a). We find that this additional downstream eddy viscosity, present in both the RANS and mean-flow consistent models, is responsible for the increased subdominant mode alignment. Considering the simpler RANS (and mean-flow) model also shows similar downstream structure, we investigate its merit for a predictive model in the next section.
7. Towards a predictive EVRA model for turbulent jets
Through the previous sections, we have shown that both the RANS and mean-flow consistent eddy-viscosity models perform well across Strouhal numbers from 0.05 to 1 at  $m=0$, provided the overall constant associated with their application to the disturbance fields is optimal (at each frequency and azimuthal mode number). In this section, we consider the sensitivity of the results regarding the choice of a frequency (and wavenumber) independent constant, and show that over a range of frequencies and azimuthal mode numbers, alignments are relatively insensitive to the choice of a constant, such that a single, universal value may be acceptable. While both RANS and mean-flow consistent models both performed well with optimal coefficients, we focus only on the RANS
 $k-\epsilon$ model, as it is better regarded as universal across a range of flows. We then apply EVRA-RANS to the
 $M_j=0.4$ jet using a single constant to six azimuthal wavenumbers,
 $m = 0-5$, and find substantially improved predictions when compared to the baseline. We also find similar observations when using the same EVRA–RANS model for both the transonic and supersonic jets. Finally, we present the effect of the eddy viscosity on the resolvent spectra.
7.1. Frequency and azimuthal mode sensitivity
The optimal RANS coefficients (figure 8) ranged from  $c = 0.7-0.004$, with a relatively constant region,
 $c=0.5$, for moderate frequencies and, considering the fully optimized eddy-viscosity field produced only marginally improved alignments for most cases, the results may not be sensitive to the precise constant. We test this hypothesis for the RANS model across a range of frequencies with proposed ‘universal’ values of constant
 $c = [1, 0.5, 0.32, 0.2, 0.08]$. We plot the resulting alignments vs frequency in figure 13. With little compromise, compared to the optimal constant for each frequency, a single constant of
 $c=0.2$ provides significant alignment across all frequencies up to
 $St=1$. Although not shown for brevity, we found similar observations using
 $c=0.08-1$ for all three Mach numbers and six azimuthal wavenumbers. In these cases, not only did
 $c=0.2$ give the best overall alignment, but the alignments were comparably insensitive to the value of
 $c$ chosen over this range.
Alignments across all Strouhal numbers for the RANS eddy-viscosity model coefficients compared with the optimal RANS coefficient at each frequency. The RANS coefficients are  $c = [1, 0.5, 0.32, 0.2, 0.08]$.

We do not present a rigorous justification for the value of  $c=0.2$, however,
 $c$ may have a connection with LES eddy-viscosity modelling. If we compare the empirical coefficients used in this RANS eddy-viscosity analysis,
 $c C_\mu$, to the square of the Smagorinsky coefficient,
 $C_s^2$, used for SGS eddy-viscosity fields in LES (Smagorinsky Reference Smagorinsky1963), we can find that the value of
 $c=0.2$ lies within the bounds of wall-bounded and isotropic turbulence. Setting equal the products of each set of coefficients, we find
 $c = C_s^2 /C_\mu$. Then using the
 $M_j=0.4$ RANS coefficient,
 $C_\mu = 0.073$, and the commonly used range of
 $C_s$,
 $0.1$ for wall-bounded flows and
 $0.18$ for isotropic turbulence (Zhiyin Reference Zhiyin2015), we find that
 $c = [0.14\text {--}0.45]$ (ranges for the
 $M_j=0.9,1.5$ jet are
 $c = [0.15\text {--}0.48],[0.17\text {--}0.57]$, respectively). This range approximately corresponds to the acceptable values found in figure 13.
For non-zero azimuthal modes, figure 14 presents the alignment of the EVRA–RANS model with SPOD using  $c=0.2$ and the baseline case for
 $m = 0\text {--}5$. The EVRA–RANS model substantially increases the alignments for all non-zero wavenumbers. The results for
 $m=1$ are particularly encouraging, with a uniform,
 $80$% alignment across all frequencies. Azimuthal modes greater than 1 result in poorer alignment, albeit much improved compared to the baseline case, especially when
 $m > 2$.
Alignments for frequencies,  $St \in [0.05,1]$, and azimuthal wavenumbers,
 $m = 0-5$, for the (a) RANS eddy-viscosity model using
 $c = 0.2$ and the (b) baseline, constant eddy-viscosity case (i.e.
 ${Re}_T = 3 \times 10^4$).

Expanding to non-zero azimuthal wavenumbers, the eddy-viscosity field also affects a third mechanism observed in the global SPOD spectrum (as  $St \rightarrow 0$), the lift-up mechanism (Pickering et al. Reference Pickering, Rigas, Nogueira, Cavalieri, Schmidt and Colonius2020a). Similar to the Orr mechanism, the lift-up mechanism arises from triadic nonlinear interactions in the flow (Hamilton, Kim & Waleffe Reference Hamilton, Kim and Waleffe1995; Sharma & McKeon Reference Sharma and McKeon2013; de Giovanetti, Sung & Hwang Reference de Giovanetti, Sung and Hwang2017; Cho, Hwang & Choi Reference Cho, Hwang and Choi2018), identifying it as a likely benefactor to an EVRA approach. Figure 14 supports this claim, showing significant improvements at low frequencies for non-zero wavenumbers. These observations also agree with Pickering et al. (Reference Pickering, Rigas, Nogueira, Cavalieri, Schmidt and Colonius2020a), who showed that resolvent modes related to streaks required an eddy-viscosity model (using the turbulent kinetic energy model reported by Pickering et al. (Reference Pickering, Rigas, Sipp, Schmidt and Colonius2019) with
 $c=0.0065$). They also observed that, in turbulent jets, the spatial extent of resolvent modes increase as frequency decreases and that without an eddy-viscosity, modes extend indefinitely downstream for
 $St=0$. This is analogous to theory surrounding streaks where the lift-up mechanism presents a rapid spatial growth of streamwise streaks until viscous dissipation becomes dominant and the structures decay (Hultgren & Gustavsson Reference Hultgren and Gustavsson1981). Considering the significant improvements between alignments for low frequency and non-zero wavenumbers, we find the lift-up mechanism to also be sensitive to an eddy-viscosity model.
7.2. Transonic and supersonic turbulent jets
We now generalize the RANS–EVRA model performance for both  $M_j = 0.9$ and 1.5 turbulent jets using
 $c=0.2$. Figure 15 provides the alignments across frequencies and azimuthal wavenumbers for each. The transonic jet gives substantial agreement for
 $m=0$ and
 $m=1$ at approximately 80 % for much of the frequency range, while
 $m=2$ gives alignments of 60 %, on average. For the supersonic jet, the agreement is not as favourable, however, much improved from the
 ${Re}_T = 3 \times 10^4$ alignments (not shown here for brevity).
Alignments using the RANS eddy-viscosity model with coefficient  $c = 0.2$ across Strouhal numbers
 $St \in [0.05,1]$ and azimuthal wavenumbers
 $m =0-5$ for the (a)
 $M_j = 0.9$ and (b)
 $1.5$ jets.

The RANS eddy-viscosity model increases many of the alignments, however, poor alignments remain, and these alignments appear to correspond to SPOD spectra without large energy separation. As shown earlier in figure 4, EVRA and SPOD modes aligned best when there exists large eigenvalue separation between the first and second SPOD mode. We find similar behaviour here for all cases. Figure 16 presents the SPOD spectra of the first five modes across all six azimuthal wavenumbers and three turbulent jets, with their associated 95 % confidence intervals in light blue. A handful of the spectra show a clear separation between mode energies, such as those between the first and second mode for  $M_j = 0.4$,
 $m=0$ and 1, for
 $M_j = 0.9$,
 $m=0$ and 1 (and higher frequencies for
 $m = 2-5$) and for
 $M_j=1.5$,
 $m=1$. In each case where there is large eigenvalue separation, we find, from figures 14 and 15, significantly greater agreement in projection coefficients between the resolvent and SPOD modes, while finding poor projections for cases without clear separation in eigenvalues. We also observe this for the subdominant modes investigated in the
 $M_j=0.4$,
 $m=0$ case in § 6.
Spectra, and their associated 95 % confidence intervals in light blue, of the first five SPOD modes for azimuthal wavenumbers  $m=0-5$ from left to right and the subsonic, transonic and supersonic jets from top to bottom, respectively. (a)
 $M_j = 0.4$, (b)
 $M_j = 0.9$ and (c)
 $M_j = 1.5$.

These observations point to a limitation to our method when comparing EVRA modes with SPOD modes. For the SPOD modes without clear eigenvalue separation, the eigenvalues themselves fall within the uncertainty bands (i.e. 95 % confidence interval) of the other modes. The eigenvectors corresponding to these eigenvalues are expected to have, at best, similar uncertainty levels. Thus, without more data, it is not possible to attribute the lack of agreement to a failure of the EVRA ansatz.
7.3. Singular values
We return to the  $m=0$,
 $St \in [0.05,1]$ case to assess the EVRA–RANS
 $c=0.2$ model's effect on the singular values and compare them to the baseline case and the SPOD eigenvalues. Figure 17 provides the spectra of the first five modes for SPOD (accompanied by a shaded region providing the 95 % confidence interval of the eigenvalues), the baseline resolvent model and the RANS–EVRA model (using
 $c=0.2$) for
 $m=0$. Comparing the resolvent spectra to the SPOD spectra, we immediately see that the separation between
 $\lambda$ (i.e. the ratio between
 $\lambda _n /\lambda _{n+1}$) and
 $\sigma ^2$ of either resolvent models does not compare favourably. In fact, the RANS–EVRA spectrum has increased its energetic separation when compared to the baseline case.
Spectra of first five (a) SPOD, (b) baseline resolvent and (c) the RANS eddy-viscosity model resolvent modes at  $m=0$ for
 $St \in [0.05,1]$.

This behaviour may be linked to multiple (in this case two for  $m=0$) distinct mechanisms represented in the flow, the KH and Orr mechanisms. As detailed earlier, the inclusion of an eddy-viscosity model presents a substantial effect on the Orr modes significantly reducing the streamwise extent of each mode, while the KH modes are relatively unchanged. We observe an analogous effect here in figure 17 where the singular values related to the Orr mechanism decrease substantially, pulling away from the unaffected singular values of the KH mechanism, resulting in a much larger separation between singular values than is observed between the SPOD eigenvalues. This sensitivity of Orr modes to an eddy viscosity was also observed in Schmidt et al. (Reference Schmidt, Towne, Rigas, Colonius and Brès2018) at
 $St=0.6, m=0$ when adjusting
 ${Re}_T$, finding that the squared singular values of the subdominant Orr modes scaled as
 ${Re}_T^{1.2}$. We observe the same effect using the RANS eddy-viscosity model, interestingly (and perhaps unsurprising given the preceding discussions), figure 17 (c) provides similar values as those reported by Schmidt et al. (Reference Schmidt, Towne, Rigas, Colonius and Brès2018) at
 $St = 0.6, m=0$ when using
 ${Re}_T = 10^3$.
Figures 17(a) and 17(c) also show that the forcing amplitudes,  $\lambda _\beta$, are not uniform in turbulent jets, contrary to a customary assumption used in resolvent analysis where
 $\boldsymbol {\varLambda _{\boldsymbol {\beta }}} = \alpha \boldsymbol {I}$, with
 $\alpha$ as an arbitrary constant (Lesshafft et al. Reference Lesshafft, Semeraro, Jaunet, Cavalieri and Jordan2019; Morra et al. Reference Morra, Semeraro, Henningson and Cossu2019; Hwang & Eckhardt Reference Hwang and Eckhardt2020). Focusing on only the first and second resolvent and SPOD modes for
 $St=0.6$ and
 $m=0$, where mode alignments are 95 % and 69 %, respectively (the optimal-field case increases the latter value to 77 % without appreciably changing the singular value), we may assume that the diagonal components of the forcing,
 $\lambda _{\boldsymbol {\beta },1}$ and
 $\lambda _{\boldsymbol {\beta },2}$, account for nearly all the energetic contributions by these two modes. As shown by (2.17), this assumption allows for a one-to-one comparison between the first two SPOD eigenvalues, resolvent singular values and forcing amplitudes (i.e.
 $\lambda _{\boldsymbol {\beta },n} = \lambda _{n} \sigma _n^{-2}$ for
 $n=1,2$). If the customary assumption of uniform forcing is applied,
 $\boldsymbol {\varLambda _{\boldsymbol {\beta }}} = \alpha \boldsymbol {I}$, then
 $\alpha = \lambda _{1} \sigma _1^{-2} = \lambda _{2} \sigma _2^{-2}$ or, alternatively,
 $\lambda _{1} / \lambda _{2} = \sigma _1^{2} / \sigma _2^{2}$, and figure 17 shows this cannot be true. Therefore, unless the SPOD and resolvent spectra are equivalent, we must model or estimate the non-trivial forcing amplitudes.
The sizeable difference between the singular values reflects the forcing of different mechanisms at significantly different amplitudes in the flow. Pickering et al. (Reference Pickering, Rigas, Nogueira, Cavalieri, Schmidt and Colonius2020a) showed that there are three distinct spatial regions that lead to the most efficient amplification of the KH, Orr, and the lift-up mechanisms. They found that regions localized near the nozzle where perturbations are smaller, associate with KH-type responses, while regions downstream and near the end of the potential core where perturbations are significantly larger, support Orr-type responses. Considering these observations, a logical next step in completing a resolvent-based turbulence model is to tie the forcing amplitude of different modes to the turbulence intensities in the respective regions that force them.
8. Conclusions
We developed a data-informed optimization that quantitatively tested the extent to which an eddy-viscosity model improves the alignment (i.e. agreement) between observed large-scale structures, educed via SPOD, and those computed from resolvent analysis. This eddy-viscosity approach acts as a proxy for modelling the effect of turbulence on large-scale structures, and we found this approach provides substantial improvements in agreement (i.e. when compared to a baseline case that used a constant eddy-viscosity model corresponding to a value of  ${Re}_T=3 \times 10^4$). By directly optimizing the eddy-viscosity field to achieve the best alignment, we found alignments between resolvent and SPOD modes as high as 96 % or improvements of over tenfold from the baseline alignment (i.e. 8 % to 80 %).
Across the frequencies and wavenumbers considered, the addition of an eddy-viscosity model to the resolvent operator highlighted its effect on the different amplifications mechanisms in the turbulent jet: Orr type, KH type and lift-up. Although eddy-viscosity models improved modes related to the KH-type mode, we found KH modes to be rather insensitive to the eddy-viscosity field, a result expected from the inviscid nature of the inflectional KH instability. For resolvent modes associated with the Orr and lift-up mechanisms, known to arise from nonlinear interactions, we found significant sensitivity. Resolvent modes computed without a sufficient eddy-viscosity model were visually unrecognizable from their SPOD counterpart, while those computed with an eddy-viscosity model aligned to nearly 80 %.
The optimal eddy-viscosity field also provided an upper bound for mode agreement, providing a benchmark to assess three additional eddy-viscosity models. Of these models, we found that traditional eddy-viscosity models (e.g. RANS based) perform nearly as well as the optimal eddy-viscosity models in aligning the most energetic mode. The traditional models even outperformed the optimal model (i.e. optimal in the first mode) when considering the subdominant modes, giving the greatest diagonalization of the forcing CSD at  $m=0$,
 $St=0.6$ (i.e. ability to model the effect of nonlinear forcing), leading to a more efficient resolvent basis for describing turbulent jets.
Finally, we tested the modelling potential of a RANS-inferred EVRA through a sensitivity analysis and observed its performance over frequency, azimuthal wavenumber and Mach number. We found the sensitivity of the RANS-based EVRA model's calibration constant,  $c$, to be weak, giving similar agreement for coefficients ranging over an order of magnitude. We found that the coefficients resulting in similar agreement fell within a range of values that may have a connection to the Smagorinsky coefficient for sub-grid-scale modelling of eddy viscosity in LES. Choosing a frequency-independent RANS–EVRA model (i.e.
 $c=0.2$), we tested its performance across six azimuthal frequencies and three turbulent jets, spanning subsonic, transonic and supersonic regimes. For the first three azimuthal wavenumbers (i.e.
 $m=0-2$), we observed substantially increased alignments for all three turbulent jets and across Strouhal numbers
 $St \in [0.05,1]$. Overall, these results show that ‘classical’ eddy-viscosity models (RANS or a mean-flow consistent model) aid in estimating the impact of the Reynolds stresses for resolvent analysis.
While the present data-driven analysis points to the efficacy of relatively simple eddy-viscosity-based models for modelling the effect of nonlinear forcing and providing a more efficient resolvent basis, there remains a need for refinements to this approach and careful comparison and consideration of alternative formulations.
Acknowledgements
The LES study was performed at Cascade Technologies, with support from ONR and NAVAIR SBIR project, under the supervision of Dr J.T. Spyropoulos. The main LES calculations were carried out on DoD HPC systems in ERDC DSRC.
Funding
This research was supported by a grant from the Office of Naval Research (grant no. N00014-16-1-2445) with Dr S. Martens as program manager. E.P. was supported by the Department of Defense (DoD) through the National Defense Science & Engineering Graduate Fellowship (NDSEG) Program.
Declaration of interests
The authors report no conflict of interest.
Appendix A. Linear damping term
Besides the studied eddy-viscosity models, we also investigated the impact of a linear damping term, which is equivalent to a finite-time-horizon resolvent analysis introduced by Jovanović (Reference Jovanović2004), recently studied by Yeh & Taira (Reference Yeh and Taira2019) to localize the resolvent forcing and response modes on an airfoil. For this model, we modify the operator so that,
 \begin{equation} \boldsymbol{L}_\beta = \boldsymbol{L} - \beta \boldsymbol{I}, \end{equation}
where  $\beta = 1/\tau > 0$, and
 $\tau$ is the desired temporal decay rate. We then find the value of
 $\beta$ that best matches the dominant resolvent and SPOD modes.
Figure 18 presents the agreements/alignments for the linear damping case. Although linear damping improves alignments, the performance is significantly inferior to the eddy-viscosity models, likely because of its monolithic damping effect over all wavenumbers, whereas the eddy-viscosity methods directly address the effect of the Reynolds stresses. Considering its suboptimal performance when compared to eddy-viscosity models, we only present results for the  $M_j = 0.4$,
 $m=0$, and
 $St \in [0.05,1]$ cases.
Optimal alignments for the linear damping term and the baseline case,  ${Re}_T = 3 \times 10^4$.

Appendix B. Governing equations
Conservation of mass, momentum and energy for a compressible, Newtonian fluid are written as,
 \begin{gather}
\frac{\textrm{D} \rho}{\textrm{D} t} ={-}\rho \varTheta,
\end{gather}
 \begin{align}\rho
\frac{\textrm{D} \boldsymbol{u}}{\textrm{D} t}
&={-}\frac{1}{\gamma M_j^2} \boldsymbol{\nabla}(\rho T)+
\boldsymbol{\nabla} \boldsymbol{\cdot} \left[ \mu
\left((\boldsymbol{\nabla} \boldsymbol{u})
+(\boldsymbol{\nabla} \boldsymbol{u})^{\rm T} -
\frac{2}{3} \varTheta \mathbb{I} \right) \right],
\end{align}
 \begin{align} \rho \frac{\textrm{D} T}{\textrm{D} t} &={-}\frac{1}{\gamma M_j^2} \rho T \varTheta + \frac{\mu}{(\gamma -1) M_j^2 Pr_{\infty}} \nabla^2 T \nonumber\\
& \quad + \gamma M_j^2 \mu \left[ \frac{1}{2} \left\{
(\boldsymbol{\nabla} \boldsymbol{u}) + (\boldsymbol{\nabla}
\boldsymbol{u})^{\rm T} \right\}:\{ (\boldsymbol{\nabla}
\boldsymbol{u}) + (\boldsymbol{\nabla}
\boldsymbol{u})^{\rm T} \} - \frac{2}{3} \varTheta^2
\right], \end{align}
respectively, where  $\varTheta = \boldsymbol {\nabla } \boldsymbol {\cdot } \boldsymbol {u}$ is the dilatation. We take
 $Pr_{\infty } = 0.7$ and
 $\gamma = 1.4$ as constants. The equations have been made non-dimensional with the jet density (
 $\rho _j$), speed (
 $U_j$) , and diameter,
 $D$. The non-dimensional viscosity,
 $\mu = {1}/{Re_j}$, is also a constant.
Applying the Reynolds decomposition (i.e.  $\boldsymbol {q} (\boldsymbol {x}, t) = \bar {\boldsymbol {q}}(\boldsymbol {x}) + \boldsymbol {q}^\prime (\boldsymbol {x}, t)$) to the above equations and separating terms that are linear and nonlinear in the fluctuations to the left- and right-hand sides, respectively, gives
 \begin{gather}
\frac{\bar{\textrm{D}} \rho^{\prime}}{\textrm{D} t} +
\boldsymbol{u}^{\prime} \boldsymbol{\cdot}
\boldsymbol{\nabla}
\bar{\rho}+\rho^{\prime}\bar{\varTheta}+\bar{\rho}
\varTheta^{\prime} = f_{\rho}, \\[-2.5pc]\nonumber\end{gather}
 \begin{align} &\bar{\rho}
\frac{ \bar{D} \boldsymbol{u}^{\prime}}{\textrm{D} t} +
\bar{\rho} \boldsymbol{u}^{\prime} \boldsymbol{\cdot}
\boldsymbol{\nabla} \bar{\boldsymbol{u}} +\rho^{\prime}
\bar{\boldsymbol{u}} \boldsymbol{\cdot} \boldsymbol{\nabla}
\bar{\boldsymbol{u}} + \frac{1}{\gamma M_j^2}(\bar{\rho}
\boldsymbol{\nabla} T^{\prime}+\rho^{\prime}
\boldsymbol{\nabla} \bar{T}+\bar{T} \boldsymbol{\nabla}
\rho^{\prime}+T^{\prime} \boldsymbol{\nabla} \bar{\rho})\notag\\
&\quad
-\boldsymbol{\nabla} \boldsymbol{\cdot} \left[ \mu
\left((\boldsymbol{\nabla} \boldsymbol{u}^{\prime})
+(\boldsymbol{\nabla} \boldsymbol{u}^{\prime})^{\rm T} -
\frac{2}{3} \varTheta^{\prime} \mathbb{I} \right) \right] =
\boldsymbol{f}_{\boldsymbol{u}}, \end{align}
 \begin{align}
&\bar{\rho} \frac{\bar{\textrm{D}} T^{\prime}}{\textrm{D}
t}\bar{\rho} \boldsymbol{u}^{\prime} \boldsymbol{\cdot}
\boldsymbol{\nabla} \bar{T}+\frac{1}{\gamma M_j^2}(\bar{T}
\varTheta^{\prime}+T^{\prime} \bar{\varTheta}) +
\rho^{\prime}\{\bar{\boldsymbol{u}} \boldsymbol{\cdot}
\boldsymbol{\nabla} \bar{T}+\frac{\bar{\rho}}{\gamma M_j^2}
\bar{T} \bar{\varTheta}\} -\frac{\mu}{(\gamma -1) M_j^2
Pr_{\infty}} \nabla^{2} T^{\prime} \nonumber\\ &\quad -
\gamma M_j^2 \mu \left[\{(\boldsymbol{\nabla}
\bar{\boldsymbol{u}})+(\boldsymbol{\nabla}
\bar{\boldsymbol{u}})^{\mathrm{T}}\}:\{(\boldsymbol{\nabla}
\boldsymbol{u}^{\prime})+(\boldsymbol{\nabla}
\boldsymbol{u}^{\prime})^{\mathrm{T}}\}-\frac{4}{3}
\bar{\varTheta} \varTheta^{\prime}\right] = f_T,
\end{align}
with  ${\bar {\textrm {D}}}/{\textrm {D} t} = {\partial }/{\partial t} + \bar {\boldsymbol u} \boldsymbol {\cdot } \boldsymbol {\nabla }$, and where we have grouped all the nonlinear terms as forcing terms on the right-hand sides.
The left-hand side is then transformed to a cylindrical coordinate frame and Fourier transformed in time  $(\omega )$ and azimuth (
 $m$). The resulting equations are discretized as discussed in § 2.
The eddy-viscosity model we use, discussed in § 2, simply replaces  $\mu$ in (B4)–(B6) with
 $\mu + \mu _T(x,r)$.
Appendix C. Optimizing in an input and output framework
In resolvent analysis, it is often useful to restrict the input and output spaces by writing
 \begin{gather} \boldsymbol{L}_T \boldsymbol{q} = \boldsymbol{B}\boldsymbol{f}, \end{gather}
 \begin{gather}\boldsymbol{y} = \boldsymbol{C}\boldsymbol{q} , \end{gather}
 \begin{gather}\boldsymbol{y} = \boldsymbol{C} \boldsymbol{L}_T^{{-}1} \boldsymbol{B} \boldsymbol{f}, \end{gather}
where  $\boldsymbol {C}$ transforms the state vector to a desired output space
 $\boldsymbol {y}$ and
 $\boldsymbol {B}$ maps a smaller dimensional input space to the state space. Here we show that such additions do not hinder the generality of the optimization presented in this manuscript.
The structure of the cost function does not change,
 \begin{equation} \mathcal{J} = \boldsymbol{u}_1^* \boldsymbol{W_y} \boldsymbol{\psi}_1 \boldsymbol{\psi}_1^* \boldsymbol{W_y} \boldsymbol{u}_1 - l^2\boldsymbol{\mu}_T^*\boldsymbol{M}{\boldsymbol{\mu}_T} + \textrm{c.c.}, \end{equation}
but the SPOD modes,  $\boldsymbol {\psi }$, and the resolvent modes,
 $\boldsymbol {u}$, are now computed considering the observable
 $\boldsymbol {y}$, and the appropriate norms for the input and output space are defined by including weighting matrices
 $\boldsymbol {W_y}$ and
 $\boldsymbol {W}_f$, respectively. The Lagrangian functional also takes a similar form as § 3.1,
 \begin{align} \mathcal{L} & = \boldsymbol{u}_1^* \boldsymbol{W_y} \boldsymbol{\psi}_1 \boldsymbol{\psi}_1^* \boldsymbol{W_y} \boldsymbol{u}_1-l^2\boldsymbol{\mu}_T^*\boldsymbol{M}{\boldsymbol{\mu}_T} - \tilde{\boldsymbol{u}}_1^* \left(\boldsymbol{u}_1 - \boldsymbol{C} \boldsymbol{L}_T^{{-}1} \boldsymbol{B} \boldsymbol{v}_1\right) \nonumber\\ & \quad - \tilde{\boldsymbol{v}}_1^* \left(\boldsymbol{B}^* \boldsymbol{L}_T^{-*} \boldsymbol{C}^* \boldsymbol{W_y} \boldsymbol{u}_1 - \sigma_1^2 \boldsymbol{W_f} \boldsymbol{v}_1 \right) - \tilde{\sigma}_1 \left(\boldsymbol{u}_1^* \boldsymbol{W_y} \boldsymbol{u}_1 - 1\right) + \textrm{c.c.}, \end{align}
where,  $\tilde {\boldsymbol {u}}_1, \tilde {\boldsymbol {v}}_1, \tilde {\boldsymbol {\sigma }}_1$ are the Lagrange multipliers. The effective composition of the functional is identical to that of the full-state optimization as it is composed of the cost function, the forward solution, the resolvent eigenvalue problem, and a normalization constraint. Taking variations with respect to each variable, with exception to the eddy-viscosity term, results in the following system of equations,
 \begin{equation}
\begin{bmatrix} \boldsymbol{I} &
\boldsymbol{W_y}^*\boldsymbol{C}\boldsymbol{L}_T^{{-}1}\boldsymbol{B}
& \boldsymbol{W_y} \boldsymbol{u}_1 \\
\boldsymbol{B}^*\boldsymbol{L}_T^{-*} \boldsymbol{C}^* &
\sigma_1^2 \boldsymbol{W_f}^* & 0 \\ 0 & \boldsymbol{v}_1^*
\boldsymbol{W_f} & 0 \end{bmatrix} \begin{bmatrix}
\tilde{\boldsymbol{u}}_1\\ \tilde{\boldsymbol{v}}_1 \\
\tilde{\sigma}_1 \end{bmatrix} = \begin{bmatrix} 2
\boldsymbol{W_y} \boldsymbol{\varPsi}_1 \boldsymbol{W_y}
\boldsymbol{u}_1 \\ 0 \\ 0 \end{bmatrix},
\end{equation}
whose solution provides the Lagrange multipliers,  $\tilde {\boldsymbol {u}}_1, \tilde {\boldsymbol {v}}_1, \tilde {\sigma }_1$.
A difficulty that arises in building (C6) is that the term  $\boldsymbol {L}^{-1}_T$ is a large, dense matrix. When
 $\boldsymbol {L}$,
 $\boldsymbol {B}$,
 $\boldsymbol {C}$ and the weighting matrices are sparse, we may instead introduce auxiliary variables through
 \begin{gather} \boldsymbol{L}_T \tilde{\boldsymbol{\eta}}_1 = \boldsymbol{B} \tilde{\boldsymbol{u}}_1, \end{gather}
 \begin{gather}\boldsymbol{L}_T^{*} \tilde{\boldsymbol{\zeta}}_1 = \boldsymbol{C}^* \tilde{\boldsymbol{v}}_1, \end{gather}
whereupon (C6) may be written as a larger, but now sparse, system of equations
 \begin{equation}
\begin{bmatrix} \boldsymbol{L}_T^* & 0 & -\boldsymbol{C}^*
& 0 & 0\\ 0 & \boldsymbol{L}_T & 0 & -\boldsymbol{B} & 0\\
0 & \boldsymbol{W_y}^*\boldsymbol{C} & \boldsymbol{I} & 0 &
\boldsymbol{W_y} \boldsymbol{u}_1 \\ \boldsymbol{B}^* & 0 &
0 & \sigma_1^2 \boldsymbol{W_f}^* & 0 \\ 0 & 0 & 0 &
\boldsymbol{v}_1^* \boldsymbol{W_f} & 0
\end{bmatrix}\begin{bmatrix}
\tilde{\boldsymbol{\zeta}}_1 \\ \tilde{\boldsymbol{\eta}}_1
\\ \tilde{\boldsymbol{u}}_1\\ \tilde{\boldsymbol{v}}_1\\
\tilde{\sigma}_1 \end{bmatrix}=\begin{bmatrix} 0\\ 0\\ 2
\boldsymbol{W_y} \boldsymbol{\varPsi}_1 \boldsymbol{W_y}
\boldsymbol{u}_1\\ 0\\ 0 \end{bmatrix}.
\end{equation}
The above presents a general optimization framework for aligning/matching any input–output resolvent analysis to data (i.e. here we use SPOD modes, but  $\boldsymbol {\varPsi }$ need not be restricted to SPOD modes). Variations with respect to any parameter of the resolvent operator may now be made to investigate their effect on modelling (or assimilating) known quantities.