


Introduction
The glacier-hydrological setting seems to be a major factor for surge behaviour of glaciers (Reference PatersonPaterson, 1994). It is now well known that the subglacial drainage system changes dramatically during a surge (Reference KambKamb and others, 1985; Reference KambKamb, 1987; Reference BjornssonBjornsson, 1998). This study aims to increase knowledge of the hydrological conditions of Finsterwalderbreen, southern Spitsbergen, Svalbard, which may be significant for understanding future surge events. We have used spatial analysis capabilities within a geographic information system (GIS) to reveal basic hydrological characteristics beneath Finsterwalderbreen, based on digital elevation models (DEMs) from the glacier surface in 1970 and 1990, and the subglacial topography. The main objectives of this study are to:
estimate the location of subglacial drainage ways and their pressure conditions
evaluate how they have changed over a 20 year period
estimate the amount of water in the different water channels during a year.
Finsterwalderbreen
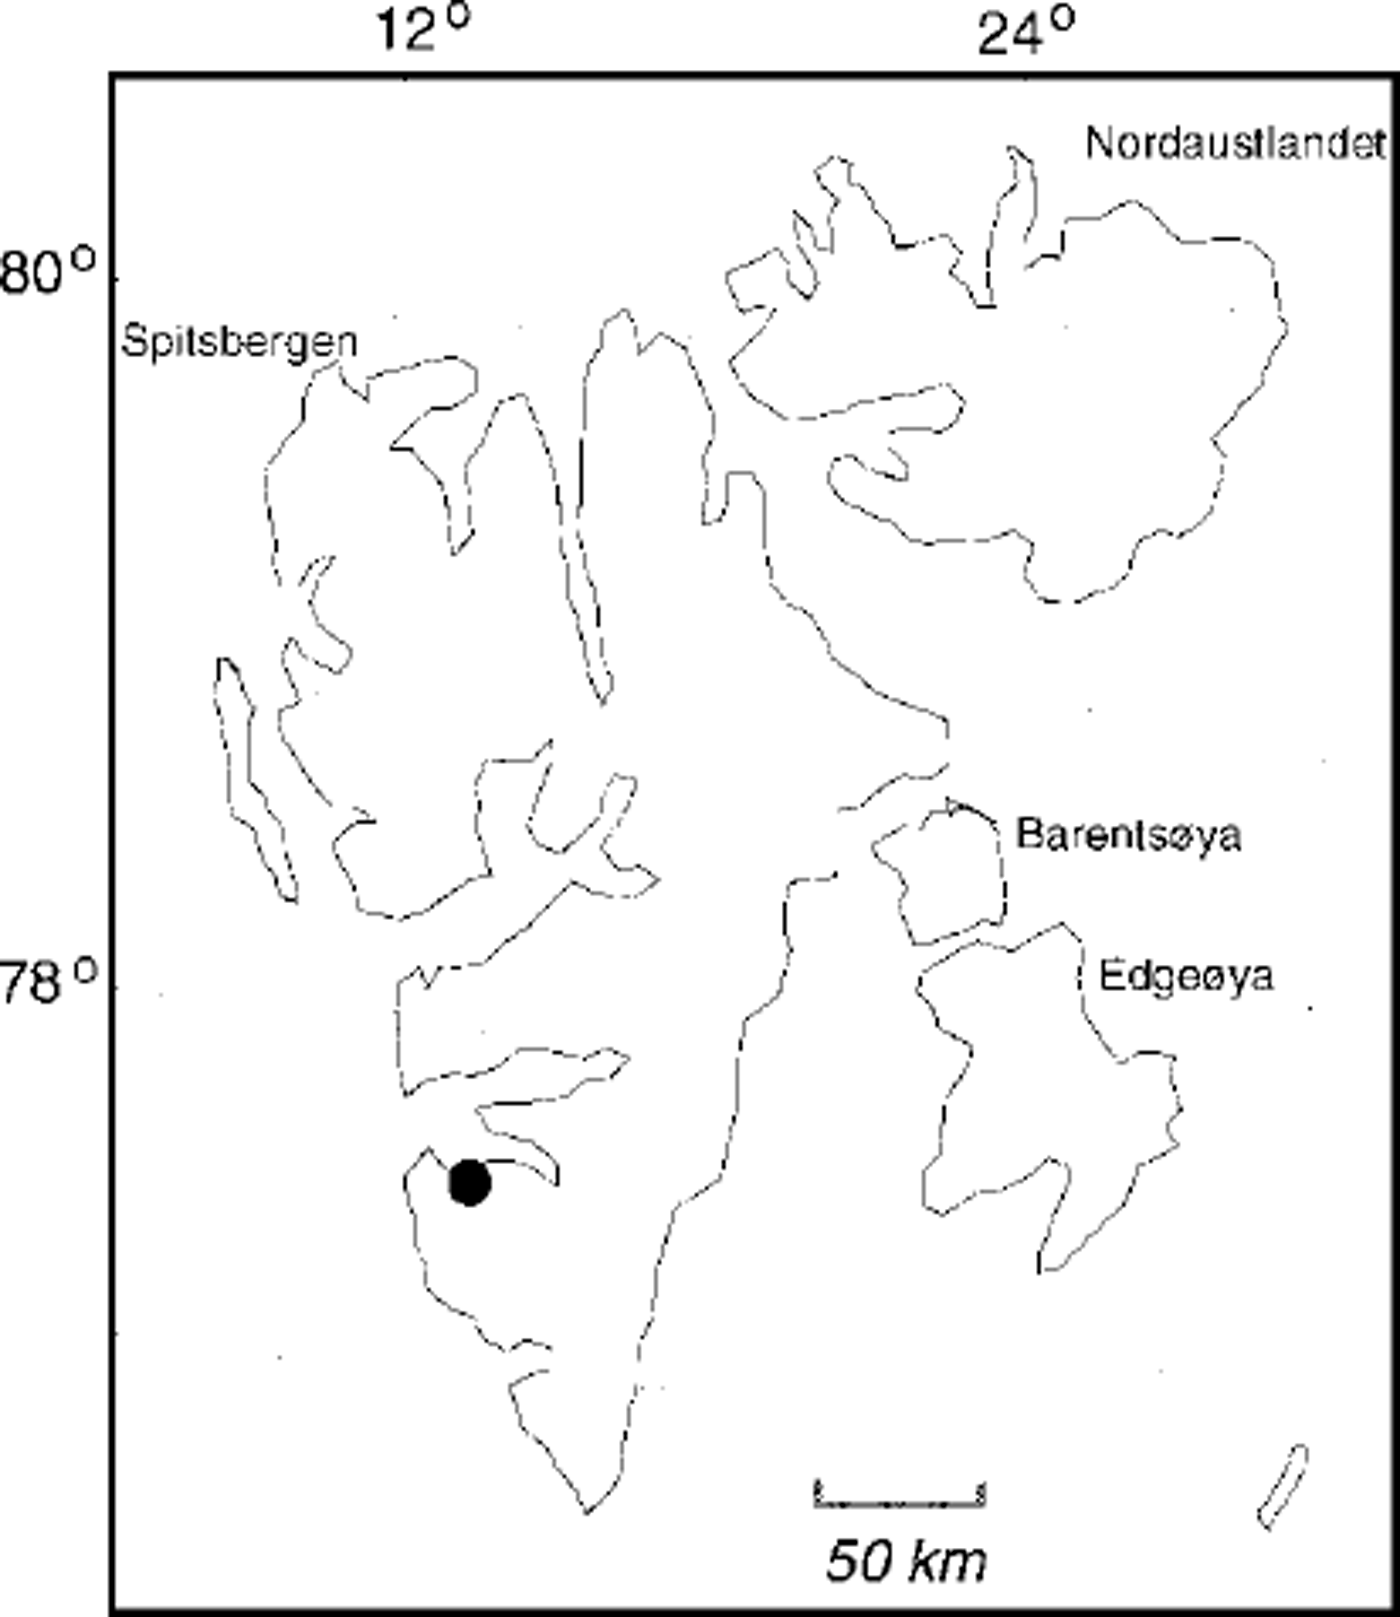
Finsterwalderbreen (77°26’N, 15°15’E) is a 35 km2 polythermal, surge-type glacier (Figs 1 and 2). It has been the subject of glaciological studies since 1950, mainly mass-balance studies (Reference Hagen and LiestolHagen and Liestol, 1990). Extensive studies started in 1994 through a joint project between scientists from the U.K., France and Norway in a European Union (EU) Environment Programme, to determine the glaciological characteristics of a typical polythermal Svalbard valley glacier in a pre-surge stage. These studies included mass-balance measurements, geometry changes and dynamic changes (Reference Nuttall, Hagen and DowdeswellNuttall and others, 1997), mapping of the thermal regime (Reference Ødegård, Hagen and HamranØdegard and others, 1997), sediment transport and hydrological measurements (Reference Hodson, Tranter, Dowdeswell, Gurnell and HagenHodson and others, 1997; Reference Wadham, Hodson, Tranter and DowdeswellWadham and others, 1997).
Location of Finsterwalderbreen in Svalbard.
Finsterwalderbreen in 1990 with surface topography, radar profiles and bed topography based on manual interpolation from the radar pro files. The original nap has 10 m contour lines; here only 20 m contour lines are given. The channel outlets from the glacier are Chi and Ch2, and the confluent stream is Ch3.

The glacier is a well-defined cirque glacier about 11 km long and around 150–200 m thick along most of the centre flowline. The glacier last surged between 1898 and 1910 (Reference LiestolLiestol, 1969). Since its last surge the glacier geometry has gradually evolved to a surface profile similar to the pre-surge topography in 1898. The glacier may be approaching a new surge as present-day mass balance and observed ice flux indicate that only about 60% of the accumulated mass is transported down to the ablation area, with surface velocities of about 7 ma–1 at the equilibrium-line altitude (ELA) (Reference Nuttall, Hagen and DowdeswellNuttall and others, 1997).
The thermal structure of the glacier has been mapped using high-frequency radar soundings (320–370 MHz), in addition to high-resolution thermistor measurements in three boreholes in the accumulation and ablation area (Reference Ødegård, Hagen and HamranØdegard and others, 1997). This has proved to be a reliable method on other glaciers in Svalbard (Reference BjörnssonBjörnsson and others, 1996). The radar results show that there is an upper cold ice layer of variable thickness underlain by temperate ice. The thickness of the cold layer ranges from 25 to 170 m. These large differences are mainly caused by variations in snow accumulation and superimposed-ice formation that lead to variations in the downward heat transfer by refreezing of meltwater. The glacier is at the pressure-melting point over most of its bed except in the lowermost 500–700 m from the terminus.
Datasets and Map Analysis
Surface topography
The DEMs are based on maps made from air photographs taken in 1970 and 1990. The 1970 DEM is derived from a map at a scale of 1:25 000 with 10 m contour lines (© Norsk Polarinstitutt), by scanning and vectoring the contours. Gridding to 25 and 50 m resolution was then carried out following Reference HutchinsonHutchinson’s (1989) procedure. Relative accuracies are estimated to be within 3 m. The 1990 DEM was generated using an analytical plotter (Reference Fox and NuttallFox and Nuttall, 1997) based on air photos at a scale of 1:50 000. Relative accuracies are here within 2 m.
Subtracting the 1970 DEM from the 1990 DEM (Fig. 3) reveals the long-term surface elevation change, which can be used as a measure of long-term mass change. Above about 400 ma.s.L, the glacier has generally built up by up to 10 m while the front has retreated and the lower part of the glacier has melted down up to 40–50 m over the 20 year period. This resulted in a clear steepening of the glacier surface (Reference Nuttall, Hagen and DowdeswellNuttall and others, 1997). Changes of the glacier surface geometry during this period are also discussed in Reference Etzelmüller and SollidEtzelmüller and Sollid (1997) and Reference EtzelmüllerEtzelmüller (2000).
Annual change in elevation, 1970–90, obtained by subtracting surface topography of the 1970 DEM from that of the 1990 DEM.

Bed topography
Information about glacier thickness was obtained by radio-echo soundings using a time-gain synthetic pulse radar (Reference Hamran and AarholtHamran and Aarholt, 1993). The frequency bandwidth of the system is 0.1 MHz to 3 GHz, and a dipole antenna was used for 30–80 MHz for the mapping of the bed topography. In addition, a low-frequency monopulse radar with centre frequency 8 MHz was applied. All radar soundings were ground-based as the radar and antennae were mounted on a sledge behind a snowmobile. The radar profiles were positioned by kinematic global positioning system (Fig. 2).
There are several methods available for interpretation of ice-thickness data, interpolation techniques and statistical analysis to obtain a reliable bed-topography map and a DEM. Our bed-topography map is based mainly on manual interpolation which often gives more reliable results than automatic interpolation routines in the case of irregularly spaced radio-echo lines. This requires some local knowledge, and details will often be a result of subjective evaluation. It is still probably the most reliable bed map that can be produced from the available data. The DEM of subglacial topography was then obtained by applying Reference HutchinsonHutchinson’s (1989) interpolation procedure on the contours base map.
Mass balance
Mass balance has been measured intermittently since 1950, but only the net balance values were measured and often for 2 year periods (Reference Hagen and LiestolHagen and Liestol, 1990). The mean net balance for the period 1950–95 is –0.4 to –0.5 m we. This is as shown on other glaciers in Svalbard mainly due to high summer melting, giving here an extra annual runoff of about 14 × 106 m3, compared to a year with mass balance at equilibrium. For the period 1970–90 the mean net balance calculated by subtracting the DEMs was more negative, about –0.65 m we. Superimposed ice forms over a large part of the glacier, delaying runoff and also affecting the ELA. The mean ELA is not well defined due to a complex accumulation pattern and differential melting. Thus the ELA varies from about 500 ma.s.l. in the western and central parts to nearly 700 m a.s.l. in the eastern part. The melting of snow and ice was measured during 1994 and 1995 by ablation stakes drilled into the ice (Fig. 4); these were the only years when both winter and summer balances were measured (Reference Nuttall, Hagen and DowdeswellNuttall and others, 1997).
Summer ablation gradients on the glacier, 1994 and 1995, calculated from stake readings (circles and triangles).

Hydrology
Water discharge was monitored at the outlet from the glacier during the 1994 and 1995 summers from 25 June to 19 and 14 August, respectively (Reference Hodson, Tranter, Dowdeswell, Gurnell and HagenHodson and others, 1997; Reference Wadham, Hodson, Tranter and DowdeswellWadham and others, 1997). The water was predominantly derived from a single outlet emerging on the western side of the terminus (Fig. 2). This outlet received about 90% of the total runoff from the catchment. The two measurement years were quite different: in 1994 the discharge ranged from 1 to 35 m3 s–1 1 , giving a total runoff of 57 × 106 m3, while in 1995 the discharge ranged from 0.5 to 15 m3 s–1, giving a total of 24 × 106 m3. However, after the observation period in 1995 a sudden high outburst event occurred, so the 1995 value is too low.
The drainage pattern has been observed mainly from the air photos from 1970 and 1990 which show the supraglacial channels, the locations of the main outlets from the glacier and the drainage pattern in front of the glacier (Fig. 5). The main outlets come out as subglacial channels at the front. Icings or naled ice form every winter and cover a large part of the flat sandur area in front of the glacier. The formation of icings indicates that the glacier bed is mainly at the pressure-melting point. An esker area in the western side of the glacier front indicates a pre-1990 water-passage location in the glacier frontal area.
Vertical air photos of the glacier front, 1970 and 1990. The black arrow shows the main direction of the stream forming the naled ice (icing) during winter. Black lines indicate the glacier front position in 1990 on the 1970 photo, and in 1970 on the 1990 photo. The esker that melted out from the glacier between 1970 and 1990 clearly indicates the location of the main water channel during that period.

Spatial modelling of drainage waterways and potential discharge
The driving force for the water flow in and under glaciers is the hydraulic potential. Calculations of the hydraulic potential are based on the ice-surface and ice-thickness gradients. The water-pressure potential at the base of a glacier (Φb) is the sum of the elevation potential and the pressure potential (Reference ShreveShreve, 1972 ; Bjornsson, 1988), defined as Φ b = ρwgZb + Pw, where Pw is the subglacial water pressure Pw = kPig(Zs ― Zb), i.e. proportional to the ice-overburden pressure. Zs and Zb are the elevations of glacier surface and bedrock, respectively, Pi is the density of ice, ρw is the density of water, g is the acceleration of gravity, and k is a factor between 0 and 1 representing the range of the water pressure in subglacial conduits from atmospheric pressure (k = 0) to full ice-overburden pressure (k = 1) when the channels are completely filled with water. The value k can also be seen as the fraction of channels where the water pressure is equal to the ice-overburden pressure, giving pressurized channels with maximum influence of the ice for k = 1, i.e. the direction of the subglacial channels is decided mainly by the gradient of the ice surface (ice-directed drainage). When k = 0 the direction of the channels is determined by the gradient of the bed. The subglacial meltwater flows normal to the equipotential lines, which can be calculated by:

where ΔΦ–b is the change in water potential along the direction of maximum potential drop, As is a length measured in the direction of the maximum potential drop (the direction of water flow) and h is the glacier thickness (Reference ShreveShreve, 1972).
GIS spatial analyzing capability based on map analysis concepts (Reference TomlinTomlin, 1990; Reference Berry, Goodchild, Parks and SteyaertBerry, 1993) was used to calculate the potential drainage system. Calculating approaches developed by Reference BjornssonBjornsson (1988) were utilized and applied two-dimensionally. Etzelmüller and Bjornsson (in press) describe the methods in more detail. The spatial map models describe a static glacier stage and do not integrate changes of mass balance or water pressure in channels during the year.
The flow direction is determined by adaptive filtering technique using the D8 algorithm (Reference O’Callaghan and MarkO’Callaghan and Mark, 1984). This algorithm describes the routine that decides in which direction the flow is routed in a local neighbourhood. For each cell the slope is tested in the eight nearest neighbours and the flow goes from that cell directed to the neighbour with the maximum slope. This may be a good approximation for subglacial water conditions (Reference Kennett, Rolstad, Elvehoy and RuudKennett and others, 1997; Reference Flowers and ClarkeFlowers and Clarke, 1999; Etzelmüller and Bjornsson, in press). Then the numbers of neighbouring cells that drain towards each individual cell are counted. Finally, the drainage passages are defined as those areas where the accumulated number of cells draining to each individual cell exceed a defined threshold (Fig. 6). For calculation of the potential discharge a map of summer ablation is generated by establishing an empirical linear relationship between ablation and altitude (Fig. 4). This map is then used as input for the runoff calculations, resulting in potential discharges (Fig. 7).
Predicted waterways beneath Finsterwalderbreen, 1970 and 1990, for k=1 and k = 0.2.

Drainage Pattern
Our model is run for k = 1 and k = 0.2, reflecting the greater influence of the bed topography (Fig. 6). The estimate for Φ6 is expected to represent average values over distances of the order of the glacier thickness. In our study we have used an average thickness of 200 m of ice, and thus we have calculated pressure gradients as average values over a circle diameter of 200 m around each gridcell point. If we reduce the averaging distance we will include too many details of the surface topography compared to the details of the bed-topography map. We would rather increase the averaging distance to 250–300 m, which would give more or less the same pattern and evolution.
Some studies conclude that most of the subglacial channels under valley glaciers of similar size to Finsterwalderbreen are an open-channel system (Reference HookeHooke, 1984), while others conclude that the channel system is mainly pressurized in a similar glacier (Reference KohlerKohler, 1995). For both the 1970 and 1990 glacier topography the model runs with k = 1 (pressurized flow) give a closer fit to the observed locations than the model run with k = 0.2 (mainly open-channel system). This indicates that the water passages are mainly directed by the glacier surface and thus that the channels are partly pressurized. As shown by Reference Ødegård, Hagen and HamranØdegård and others (1997), the glacier is at the pressure-melting point over most of its bed except within 500–700 m of the terminus. In this region the ice is thin (h ≤ 70 m) and cold, and therefore deforms very slowly. It is therefore likely that the water channels are open and stable in this section and then are gradually filled upstream. The pressurized flow probably starts in the part of the glacier where it is >150m thick and where the ice below 100 m depth is at the pressure-melting point, i.e. about 1.5 km from the front. In this part the channels are partly pressurized and k ∈ (0.2,1) but to a large extent closest to 1.
The channels at the bed will follow in detail the locations where the pressure is smallest. The pressure gradients will always decide where the water will flow. Our analysis does not give these details, as our bed-topography map is inadequate for this purpose. Our analysis also omits seasonal variations and pressure gradients inside the channels due to seasonal or even daily variations in the water discharge. Our simplified analysis gives only the overall pattern.
The drainage pattern of the glacier is stable from one year to the next; it changes only when the glacier geometry changes as the glacier retreats. The drainage pattern over the period 1970–90 shows a change in the predicted location of the main outlet stream from the glacier. In 1970 the main stream escaped close to the central part of the front, while after the retreat of the front and lowering of the surface the river changed course to a more westerly location under the glacier and at the outlet (Fig. 6). This change can also be observed on the vertical air photos of the glacier front in 1970 and 1990 (Fig. 5). The esker that emerged as the glacier retreated between 1970 and 1990 clearly indicates the location of the main water channel during that period. In both years the icing (naled ice), which is a result of winter discharge from the glacier, was formed mainly in front of the central part of the glacier. This is because in 1990 the unfrozen winter water also drains along the glacier front to the central part after it has emerged from the glacier via the western outlet as shown in Figure 5.
The change of the channels in the study period also affected the contributing area of the western and eastern outlets. While in 1970 the western outlet drained 85% of the glacier area (34 km2 vs 5.8 km2 for Chl and Ch2 (see Fig. 2), respectively), this proportion increased to 91% in 1990 (32 km2 vs 3 km2 for Chl and Ch2, respectively). This may have an effect on the flow behaviour of the glacier, and must be considered when surge build-up situations are discussed.
Potential Discharge
The main sources of runoff during summer are (1) melting of snow and ice on the glacier surface, (2) snowmelt from areas in the drainage basin outside the glacier, and (3) summer rainfall. In this drainage basin the glacierage cover is nearly 70%. It has been shown for other basins in Svalbard with similar glacierization that melting on the glaciers is the predominant source of meltwater, contributing more than two-thirds of the total runoff (Reference Hagen and LefauconnierHagen and Lefauconnier, 1995). It has also been shown that there is a very high correlation between summer ablation and the total discharge from the glacier because runoff variation is mainly due to summer temperatures, and thus ablation could be used to estimate the total runoff. The other source of runoff variation was summer rainfall which was highly variable from year to year. Snowmelt from ice-free areas makes a fairly stable contribution, as annual snowfall does not vary much. Thus, a linear regression model was fitted to the ablation data (Fig. 4). The resulting regressions explained >75% of the original variations. The regression coefficients were then used to calculate a distributed map of the summer balance, and potential discharge was estimated (Fig. 7).
Predicted total runoff, 1994 and 1995, in 106 m3
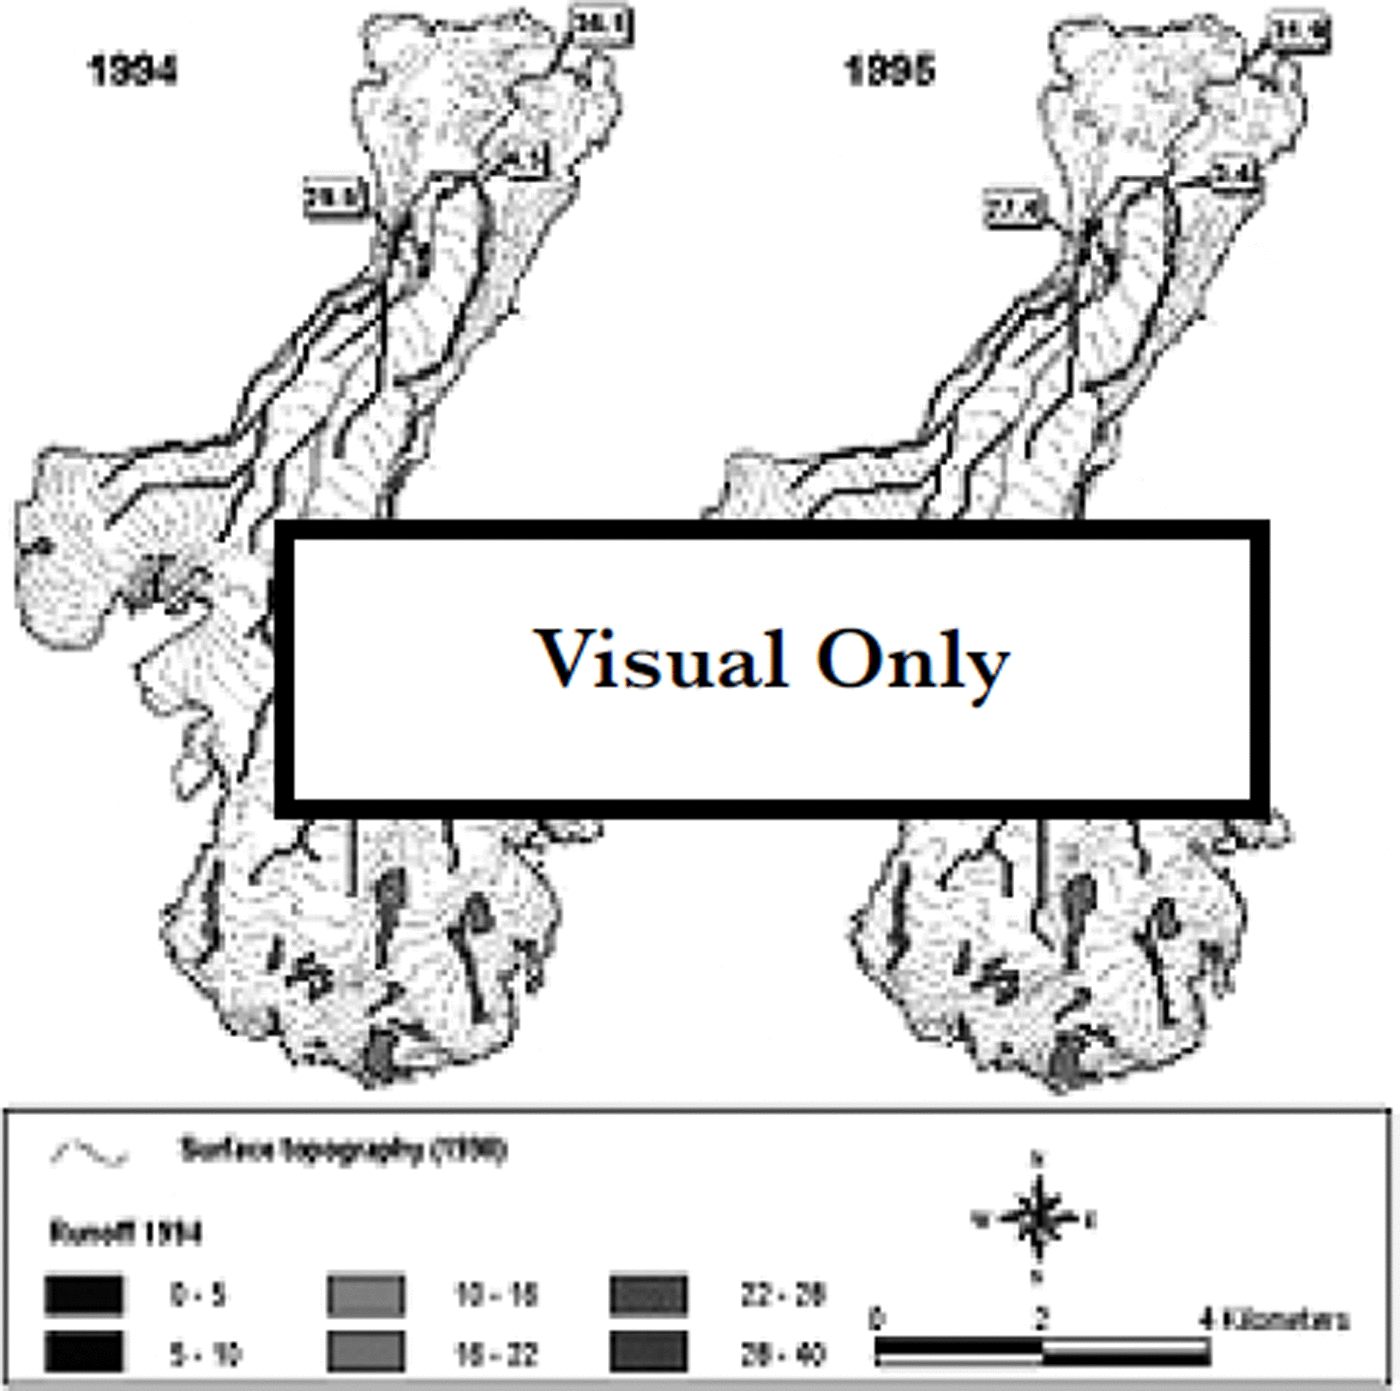
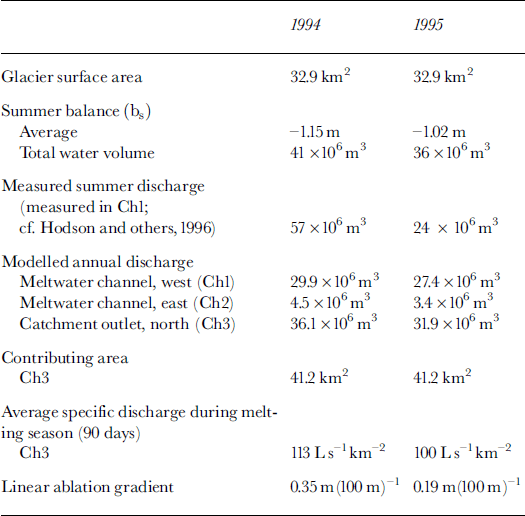
The model predictions of the calculated potential contribution of runoff in each river outlet were compared to the field measurements in the meltwater rivers (Reference Hodson, Tranter, Dowdeswell, Gurnell and HagenHodson and others, 1997). The relative importance of the two outlets (Chi and Ch2; cf Fig. 7 and Table 1) fits well with the observed values. However, the modelled absolute values showed a much lower runoff than measured in 1994, while the opposite was true in 1995. The 1995 discrepancy could be due to heavy rainfall during that summer or to englacial or subglacial water storage. Some observed sudden high-runoff events, especially in 1995, could indicate release of this kind of storage, but we do not have enough detailed data to evaluate this further. However, in 1995 the measured discharge is clearly underestimated, as a sudden runoff event was not monitored after the observation period. Therefore, the 1995 values should be very close to the actually observed situation.
Finsterwalderbreen hydrological data during summers 1994 and 1995
Conclusions
-
(1) The modelling of the subglacial drainage indicates that the subglacial channels under Finsterwalderbreen are partly pressurized, and their location directed by the glacier except for the lowermost 1.5 km near the terminus where the glacier is cold and thin.
-
(2) The western outlet of Finsterwalderbreen drained a larger area in relation to glacier size in 1990 than in 1970, which may affect glacier flow.
The estimated absolute runoff values did not correspond very well with measured summer runoff. This is due to heavy summer rain in 1994 and a possible subglacial water-storing system which causes sudden runoff events.
Acknowledgements
The first two authors should be regarded as having contributed equally to this paper. M. Kennett and S.-E. Hamran did the radar soundings. T. Tonning carried out most of the radar data interpretation and interpolation work. A. Hodson provided the discharge data. This work was supported by EU grant EN5V-CT93-0299 ˚Investigations of Glacier Surges: Measurements and Modelling of Ice Dynamics in Svalbard", and at a later stage by a contribution from EU grant ENV4-CT97-0490, ˚The Response of Arctic Ice Masses to Climate Change: Modelling, Remote Sensing and Field Measurements". All digital spatial analysis was carried out at the Laboratory for Remote Sensing and Geographical Information Technology at the Department of Physical Geography, University of Oslo. The authors want to thank all the persons and institutions mentioned.



