INTRODUCTION
Grass evaluation programmes capable of identifying varieties with superior performance within grazing systems are essential to the success of ruminant production in Ireland. Ireland's temperate climate gives rise to a natural ability to grow grass throughout most of the year (Hurtado-Uria et al. Reference Hurtado-Uria, Hennessy, Shalloo, O'Connor and Delaby2013). This creates a competitive advantage because of relatively low production costs, because ruminant production systems are able to use high levels of grass in animal diets. This ability is hugely positive as grass, particularly grazed grass, is of high nutritive value (O'Neill et al. Reference O'Neill, Deighton, O'Loughlin, Mulligan, Boland, O'Donovan and Lewis2011), and is the cheapest feed source available to Irish ruminant production systems (Finneran et al. Reference Finneran, Crosson, O'Kiely, Shalloo, Forristal and Wallace2012). Grass accounts for 0.90–0.95, 0.80 and 0.65 of sheep, dairy cow and beef cattle energy requirements, respectively, in both grazed and conserved forms (O'Donovan et al. Reference O'Donovan, Lewis and O'Kiely2011). A 10% increase in the proportion of grazed grass in the overall diet of a dairy cow will reduce the cost of milk production by €0.025 per litre (Dillon et al. Reference Dillon, Roche, Shalloo, Horan and Murphy2005). Irish producers have the potential to grow between 12 and 16 t/ha of grass dry matter (DM) annually (O'Donovan et al. Reference O'Donovan, Lewis and O'Kiely2011). Grass-based production systems have many benefits other than those directly related to the efficacy of production. Dillon et al. (Reference Dillon, Roche, Shalloo, Horan and Murphy2005) suggests that there are many environmental and social benefits to the implementation of grass-based production systems. Irish grass-based production systems have a comparative advantage as they are found to have a lower carbon footprint per unit of milk compared to confinement dairy systems in the UK and USA using the life-cycle assessment method of evaluation (O'Brien et al. Reference O'Brien, Capper, Garnsworthy, Grainger and Shalloo2014).
The removal of European milk quotas has resulted in the expansion of the Irish dairy industry. Increasing grass growth and utilization at farm level will be key to the success of such developments (Ramsbottom et al. Reference Ramsbottom, Horan, Berry and Roche2015). With increased market volatility for milk, beef and inputs, such as fertilizer and concentrates, enterprises’ profitability will be dependent on increasing the proportion of grazed grass in animal diets (Kelly et al. Reference Kelly, Shalloo, Geary, Kinsella and Wallace2012; Ashfield et al. Reference Ashfield, Wallace and Crosson2014).
Given the importance of grass to the economy of Ireland, an evaluation process to identify and promote the use of new varieties with improved on-farm performance in the areas of production, persistence and quality is necessary. On joining the EU in 1973, the first ‘value of cultivation and use’ tests of perennial ryegrass varieties were established in Ireland (Grogan & Gilliland Reference Grogan and Gilliland2011). The current Recommended List evaluation process in Ireland involves the evaluation of all candidate varieties for two entire growing seasons. Following an establishment year, varieties are assessed for DM production, nutritive value and persistency (Grogan & Gilliland Reference Grogan and Gilliland2011).
Perennial ryegrass sward density has significant effects on seasonal and total herbage production (Creighton et al. Reference Creighton, Gilliland, Delaby, Kennedy, Boland and O'Donovan2012), but nationally swards are found to contain a low density of perennial ryegrass, with approximately 0.015 of the permanent grassland area reseeded annually (Humphreys & Casey Reference Humphreys, Casey, Conijn, Velthof and Taube2002). As a consequence, herbage production and utilization is well below its potential on Irish grassland farms (Shalloo et al. Reference Shalloo, Creighton and O'Donovan2011). Sward renewal combined with the selection of appropriate grass varieties suited to localized environments can assist farmers in maximizing levels of herbage production and utilization.
Since the introduction of Recommended List evaluations to Ireland, the grassland demands of farmers have changed. The question remains whether current evaluations provide breeders with adequate selection criteria and feedback to develop new grass varieties which are akin to the needs of modern grassland farmers. To overcome the limitations of simulated grazing studies and identify superior grass genotypes suited to grazing systems there is a need to establish trials which better simulate ‘commercial’ farm conditions for longer periods than current evaluation protocols (Kerr et al. Reference Kerr, Chapman, Thom, Matthew, Van Der Linden, Baird, Johnston and Corkran2012). On-farm grass evaluations have been undertaken previously (Casler et al. Reference Casler, Undersander, Fredericks, Combs and Reed1998), but across a small number of farms with multiple varieties sown in strips within the same paddock. The traits evaluated in such evaluations are suited to local environments, many of which are of little interest to intensive grazing regimes.
On-farm evaluation has the ability to influence and redirect the breeding of the next generation of grass varieties suited to intensive grazing regimes. The objective of the current study was to develop a large on-farm phenotyping strategy which would evaluate the performance of grass varieties within an intensive grazing regime in southern Ireland. The current study presents results from the first 3 years of a study which will continue for a much longer period of time to assess long-term varietal performance.
MATERIALS AND METHODS
Experimental design
This was a longitudinal study of grass performance on 66 Irish grassland farms between January 2013 and December 2015. Farm paddock acted as the experimental unit nested within farm, with farm acting as a replicate.
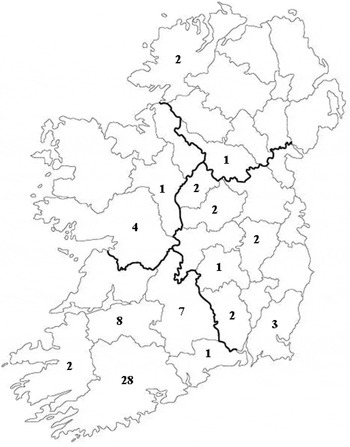
Dairy farms across a range of agroclimatic regions on differing soil types operating grass-based, spring-calving herds in the Republic of Ireland were identified and enrolled. The farm locations are as follows (farm numbers in parenthesis): Cavan (1), Cork (28), Donegal (2), Galway (4), Kerry (2), Kildare (2), Kilkenny (2), Laois (1), Limerick (8), Longford (2), Roscommon (1), Tipperary (7), Waterford (1), Westmeath (2) and Wexford (3). The regional spread and number of farms per county are shown in Fig. 1. Within PastureBase Ireland (PBI), the drainage characteristics of each paddock categorized showed that 0.15 were ‘poorly drained’, with a further 0.15 being ‘moderately drained’ and the remaining 0.70 classified as ‘well drained’.
Regional distribution and number of farms per county.

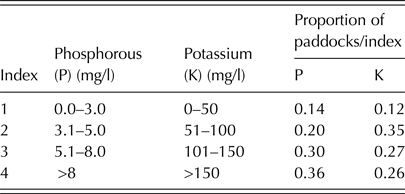
Historic soil fertility records across the 66 farms showed that a mean soil pH of 6.3 (±0.02) existed; however, paddock pH levels ranged from 4.6 to 7.4, paddock phosphorous and potassium levels are outlined in Table 1. All participating farms required a Nitrates Derogation (Department of Agriculture 2017a ) for each of the evaluation years, permitting application of between 170 and 250 kg organic nitrogen (N)/ha/yr across all farm paddocks in addition to 250 kg of inorganic N/ha/yr.
Proportion of paddocks within each phosphorous and potassium index

A prerequisite for farm selection was for farmers to have a proven history of grassland management and measurement (based on records from PBI), which indicated the level and quality of data recorded. Throughout each of the years all participating farmers were provided with grassland management training to ensure data was recorded correctly and coherently and that management practices were adhered to, in order to test varieties sufficiently and to disseminate new information. All farmers were members of a farmer discussion group, which meet on a monthly basis during the main grazing season.
Data capture and storage – PastureBase Ireland
PastureBase Ireland (Hanrahan et al. Reference Hanrahan, Geoghegan, O'Donovan, Griffith, Ruelle, Wallace and Shalloo2017) is a web-based grassland database which has a dual function of providing real-time decision support for farmers while acting as a national grassland database, capturing information for benchmarking and research purposes. The system operates with the individual farm paddock (experimental unit in the current study) as the basic unit of measurement. All grassland information is recorded by the farmer through the web interface. Recorded data must satisfy predefined verification rules programmed into the system. Such verification checks include restrictions on grass cover estimations (0–3500 kg DM/ha), silage yields (0–10 000 kg DM/ha) and residual heights (2.5 to 9.0 cm). All measurements on PBI are described and calculated on a per hectare basis for individual paddocks. The operator builds a profile for each paddock, entering background information such as size, distance from parlour (dairy operators only), altitude, aspect, drainage status, reseed date and method, sown varieties and soil fertility records.
Farmer inputs
Grass cover estimations are entered on a weekly basis during the main growing season, which is necessary to calculate grass DM production. Estimations are taken by using either a plate meter (Jenquip, Fielding, New Zealand) (O'Donovan et al. Reference O'Donovan, Dillon, Rath and Stakelum2002b ) or by visual assessment (O'Donovan et al. Reference O'Donovan, Connolly, Dillon, Rath and Stakelum2002a ). As the farmer enters grass cover estimations through the interface there are five different paddock status options available for selection. These are:
-
a. Grass – land area which is available for grazing;
-
b. Under grazing – area which is currently occupied by livestock;
-
c. Silage – area earmarked for silage production;
-
d. Reseed – area which is under-going the reseeding process;
-
e. Other enterprise – area not in grassland.
If a paddock cover reduces by >200 kg DM/ha between two cover estimations the user is prompted to enter defoliation (grazing or silage event) details into the system. A graze or cut date must be provided which allows the correct historic growth rate to be calculated which is required for the generation of DM yield estimations. This information is also required to calculate the average number of defoliations per paddock.
Variety establishment
Grass varieties were sown as monocultures in individual paddocks from 2011 to 2014 on all 66 commercial grassland farms following stringent guidelines (O'Donovan Reference O'Donovan2014) to ensure successful sward establishment.
All paddocks identified for reseeding were treated with glyphosate (Roundup; Monsanto Meath, Ireland) to ensure that all existing botanical species were removed, reducing the regrowth of weed grass species (Lane et al. Reference Lane, Addison and Van Plateringen2009). Seed bed cultivations commenced 7–10 days after glyphosate application. Excessive surface trash was removed pre-cultivation.
A range of cultivation methods were used to form a fine and firm seedbed. The method of cultivation chosen was specific to each site and soil type. The methods used were plough-till-sow (conventional), discing, one-pass and direct drilling, all of which have been shown to be equally as effective in terms of sward establishment and DM production (Creighton et al. Reference Creighton, Kennedy, Hennessy and O'Donovan2016). When a suitable seedbed was achieved, varieties were sown at a seeding rate of 34.5 kg/ha for both ploidies.
Chemical N, P and K fertilizer and lime (where necessary) was applied at the time of sowing, as each of these elements has been shown to be essential for seedling development (McWilliam et al. Reference McWilliam, Clements and Dowling1970). Newly reseeded swards received a post-emergence spray to control weed populations: this was generally completed within the first 6 weeks post-establishment.
Perennial ryegrass varieties were selected from the Irish Recommended List for Grass and White Clover Varieties in each of the years 2012, 2013 and 2014 (Department of Agriculture 2017b ). Diploid (D) and tetraploid (T) varieties with heading dates ranging from 30 May to 10 June were selected for use. Tyrella (late heading D) was sown across evaluation farms at the outset of the study as a common variety, thereafter each farm was allocated a subset of varieties. All farms were allocated both tetraploid and diploid varieties. Variety allocation was dependent on a number of factors such as farmers’ reseeding programmes, previously sown varieties and, to a lesser extent, seed availability. The varieties sown (along with the associated ploidy and heading date in parenthesis) were: AberChoice (D; 10 June), AberGain (T; 5 June), AberMagic (D; 30 May), Astonenergy (T; 2 June), Drumbo (D; 7 June), Dunluce (T; 30 May), Glenveagh (D; 3 June), Kintyre (T; 8 June), Majestic (D; 2 June), Twymax (T; 7 June) and Tyrella (D; 4 June).
Table 2 contains the sample size for each variety over the entire study and for individual years. A threshold of 10 individual paddock sowings was required for a variety to be included in the evaluation programme. Between year one and year three, the average number of varieties present on evaluation farms ranged from 3.6 to 4.9.
On-farm sample size (paddocks) per variety and year

(T) denotes tetraploid varieties, all other varieties being diploid.
Meteorological data
Meteorological data generated from three inland synoptic weather stations operated by Met Éireann were recorded; these sites were located in the south west (SW), south east (SE) and north west (NW) of Ireland. Data from these stations was available through PBI for the defined seasons recording daily mean minimum and maximum air temperatures, soil temperature at 5 cm depth and rainfall.
On-farm sward measurements
Grass DM production was measured from 1 January to 31 December annually. Grazing and silage DM yields were assessed prior to cattle grazing or harvesting and was recorded through PBI using the methodology outlined by Hanrahan et al. (Reference Hanrahan, Geoghegan, O'Donovan, Griffith, Ruelle, Wallace and Shalloo2017).
As well as total herbage production, the proportion of grazed or conserved herbage, along with the number of defoliations for each was established. From regular grass measurements it was possible to determine the DM productivity of varieties in the spring, mid-season and autumn periods.
Sward density of perennial ryegrass was established by visually scoring swards on a scale of 0 to 9 (where 0 = 0.0–0.10 perennial ryegrass, 9 = 0.91–1.00 perennial ryegrass) (Cashman et al. Reference Cashman, McEvoy, Gilliland and O'Donovan2016), as per recommended list plot evaluations (Grogan & Gilliland Reference Grogan and Gilliland2011).
Visual ground scores of all paddocks on each farm were taken over the winter (November to February, closed grazing period), by a visually calibrated observer. This measurement was repeated at this time point in each evaluation year to monitor ground score change over time. Ground score estimates were validated using an inclined point quadrat (Wilson Reference Wilson1960) across plots with a range of sward densities prior to observer calibration.
From May to September in 2014 and 2015, grass quality from a subset (30 farms) of evaluation farms was monitored. The farms were visited fortnightly and herbage samples taken from the next three paddocks to be grazed. Herbage samples were taken at random by harvesting 60–80 grass snips with a pair of Gardena shears (Accu 60, Gardena International GmbH, Ulm, Germany), cutting to a post-grazing height of 4 cm. To determine the DM content of each variety, and to allow for sample milling, a sub-sample of 0.1 kg from each paddock herbage sample was dried at 60 °C for 48 h.
The milled samples were then analysed for dry matter digestibility (DMD), water soluble carbohydrate concentration (WSC) and crude protein (CP), which were determined using near infrared reflectance spectroscopy (NIRS) (Foss UK Ltd., Warrington, UK) using an equation developed by Burns et al. (Reference Burns, Gilliland, McGilloway, O'Donovan, Lewis, Blount and O'Kiely2010).
Data analysis
Only farms with >30 complete farm grass measurements per annum (representing a full complement of grass measurements to ensure the profile of a full grass growing year) were included in the dataset. Newly reseeded swards, in their first harvest year, were excluded from the dataset. Only swards which had the full 12-month period (establishment phase) completed were included in the analysis.
To assess variety seasonal productivity, grass DM production period was split into spring (1 February to 10 April), mid-season (11 April to 6 August) and autumn (7 August onwards) (McEvoy et al. Reference McEvoy, O'Donovan and Shalloo2011).The rate of ground score change was deemed to be the difference in ground score between year 1 (2013) and year 3 (2015).
Statistical analyses
The effect of variety on grassland parameters was estimated using a linear mixed model in PROC MIXED (SAS Inst. Inc., Cary, NC, USA), with paddock nested within farm included as a repeated measure with a compound symmetry covariance structure assumed among paddocks within farm.
The dependent variables investigated include total paddock yield (kg DM/ha), spring, mid-season and autumn DM production, number of grazing events, number of silage cuts, silage DM yield, grazing DM yield, ground score, DMD, CP and WSC in the following model:
 $$\eqalign{ y_{\,jklmn} = &\mu + f_j + p_k + C_l + A_m + Yr_n + (C_l \times Yr_n) \cr &+ (C_l \times f_j)\,e_{\,jklmn},}$$
where y jklmn is the dependent variable under investigation; μ the mean; f j the farm (j = 1…66); p k the paddock (k = 1…872); C l the variety effect (l = 1…11); A m the age effect (m = 1…5); Yr n the year effect (n = 1…3); (C l × Yr) the variety × year interaction; (C l × f j ) the variety × farm interaction; e jklmn the residual error term.
Pearson's correlation coefficient was used to establish the strength of the linear association of total and grazing herbage production. A simple linear regression, PROC REG (SAS Inst. Inc., Cary, NC, USA) was used to test the relationship between the dependent variable, grazing production and the independent variable, number of grazing events.
Tyrella was initially used as an experimental control, as it was sown on all farms; however, it did not add accuracy or precision to the model and so it was subsequently evaluated as per the other trial varieties.
RESULTS
Meteorological data
Across the three inland weather stations, little variation existed between the seasons of each year with the exception of spring 2013, which recorded the lowest minimum and maximum average air and soil temperatures (0.9, 7.4 and 4.6 °C, respectively), and had very low rainfall levels of 118 mm. Rainfall, minimum and maximum average air and soil temperatures were 0.57, 0.33, 0.73 and 0.72 of the average of spring 2014 and 2015, respectively.
On-farm phenotypic performance
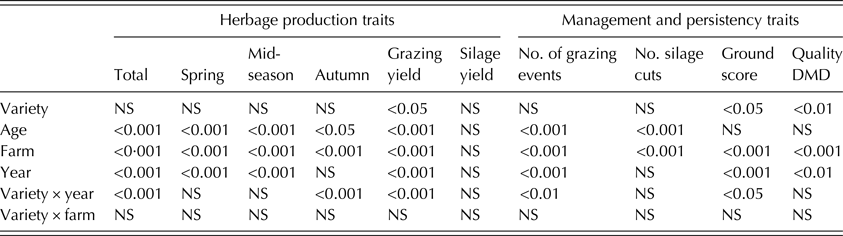
There was a significant (P < 0.05) interaction between variety and year for variables such as total, grazing and autumn herbage production, number of grazing events achieved and ground score. No interaction existed between farm and variety for any of the traits evaluated, suggesting no genotype × environment interaction. Spring, mid-season, autumn and total DM production did not differ by variety. Grazing yield (P < 0.05), ground score (P < 0.05) and DMD (P < 0.001) were affected by variety, whereas the number of grazing events, yield and number of silage harvests did not differ by variety (Table 3). Despite the lack of overall variety effects, pairwise comparisons indicated significant differences (P < 0.05) between individual varieties performance across many traits.
Significance levels (P values) of the main phenotypic effects and their interactions across production, management and quality data

NS, not significant.
Total herbage production
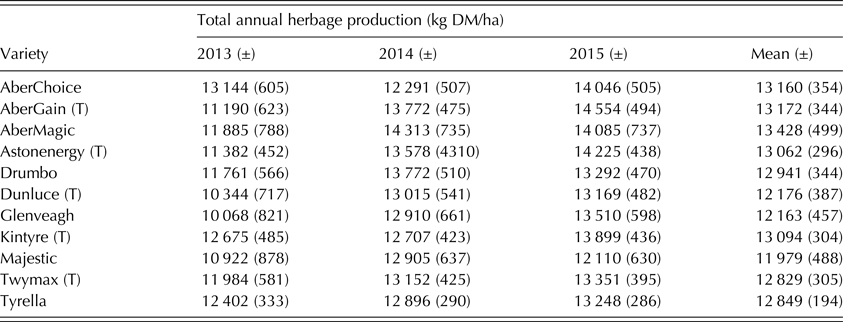
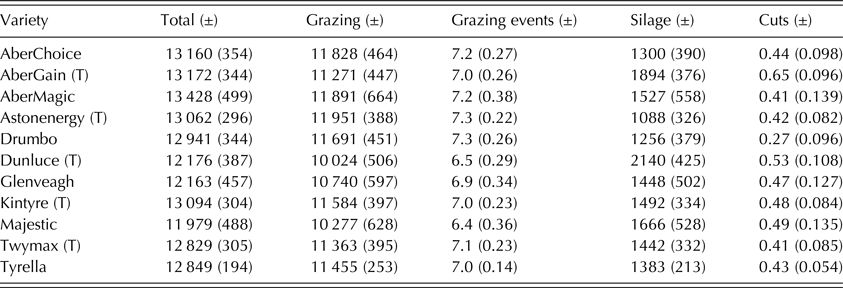
The DM yield difference between the highest and lowest varieties for total mean DM production across years was 1449 kg DM/ha, although variety had a non-significant effect. Total DM production differed by year, with 2015 achieving the highest at 13 590 (±183) kg DM/ha followed by 2014 and 2013, producing 13 210 (±208) and 11 614 (±276) kg DM/ha, respectively (Table 4). Pairwise comparisons between individual varieties showed that Dunluce and Majestic produced significantly (P < 0.05) less herbage compared to AberChoice, AberGain, AberMagic, Astonenergy and Kintyre (Table 4).
Total on-farm herbage production (LS means with standard errors in parentheses) kg DM/ha per variety across the 2013–2015 production years

(T) denotes tetraploid varieties, all other varieties being diploid.
Grazing and silage herbage production (events achieved)
A strong correlation (0.75) was estimated between total and grazing DM yield (P < 0.001), illustrating good uniformity between both grazing and total DM production performance. Variety had a significant (P < 0.05) effect on grazed herbage yield, with Astonenergy yielding +1927 kg DM/ha more than the lowest yield variety Dunluce (Table 5). Dunluce had a grazing yield significantly lower than all other varieties, with the exception of Glenveagh and Majestic (Table 5). The grazing yield of Majestic was found to be significantly (P < 0.05) lower than that of AberChoice, Astonenergy and Drumbo.
Varietal (LS means with standard errors in parentheses) total, grazing and silage yields kg DM/ha and number of events achieved

(T) denotes tetraploid varieties, all other varieties being diploid.
The number of grazing events achieved did not differ by variety; however, significant differences existed between varieties as shown by pairwise comparisons. For example, Dunluce and Majestic had significantly (P < 0.05) fewer grazing events than Astonenergy and Drumbo. Majestic also had fewer than AberChoice. Regression analysis showed a strong relationship (R 2 = 0.70) between grazing DM yield and the number of grazing events, with each additional grazing achieved resulting in an extra 1437 kg DM/ha in grazing yield.
No overall variety effect existed for the number or yield of silage harvests although differences existed between individual varieties. Dunluce yielded significantly (P < 0.05) more silage than Astonenergy and had a higher number of harvests compared to Drumbo, while AberGain required significantly (P < 0.05) more harvests than Drumbo, Twymax and Tyrella.
Seasonal herbage production
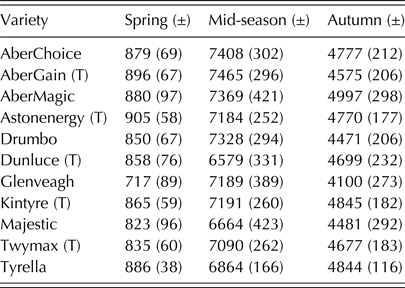
No variety effect existed for seasonal herbage production. Seasonal herbage production varied between years (P < 0.001). Year × variety interactions influenced autumn herbage production (P < 0.001); no interaction was observed for spring or mid-season. Spring herbage production was highest in 2015, producing 1105 (±37) kg DM/ha followed by 2014 and 2013 producing 891 (±42) and 566 (±55) kg DM/ha, respectively. Table 6 contains the seasonal DM production of varieties. Dunluce had the lowest mid-season growth, which was significantly (P < 0.05) lower than AberChoice and AberGain. Glenveagh recorded the lowest autumn production, significantly (P < 0.05) lower than AberMagic, Astonenergy, Kintyre, Twymax and Tyrella.
Seasonal variety production (LS means with standard errors in parentheses) kg DM/ha (2013–2015)

Spring: 1 February to 10 April; Mid-season: 11 April to 6 August; Autumn: 7 August to 31 December.
(T) denotes tetraploid varieties, all other varieties being diploid.
Ground score
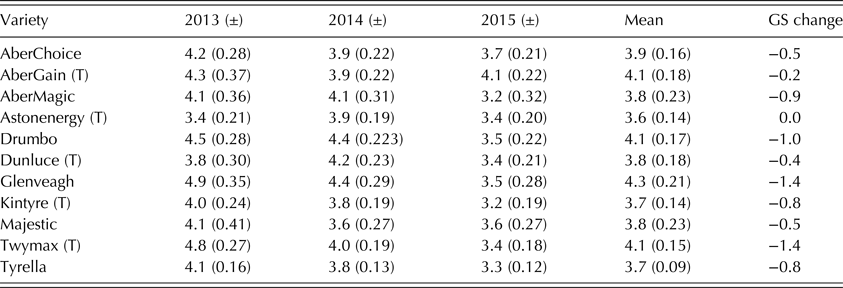
Sward ground score was affected by variety (P < 0.05) and was also influenced by farm, year and the interaction of variety × year (P < 0.001). The varietal ground scores decreased significantly (P < 0.001) across years; mean ground scores achieved in 2013 and 2014 were +0.78 and +0.46, respectively, compared with 2015. Astonenergy and Kintyre had the lowest density and were significantly (P < 0.001) lower than AberGain, Drumbo, Glenveagh and Twymax. Glenveagh and Twymax formed the densest swards, significantly (P < 0.001) higher than Astonenergy, Kintyre and Tyrella.
Sward age had a tendency to reduce sward density (P = 0.06). Table 7 shows the individual varietal changes between years and illustrates the rate of change in ground score between varieties. The magnitude of varietal change was high ranging from no change between years one and three (Astonenergy), to a reduction of 1.4 ground score units for Glenveagh and Twymax. Glenveagh and Twymax also recorded the highest mean ground score values within their respective ploidy levels over the 3-year evaluation period.
Ground score (GS) (LS means with standard errors in parentheses) per variety across the 2013–2015 production years, with accompanying rate of change (0 to 9 scale)

GS change is the difference in sward perennial ryegrass content between the winters of 2013 and 2015.
(T) denotes tetraploid varieties, all other varieties being diploid.
Quality
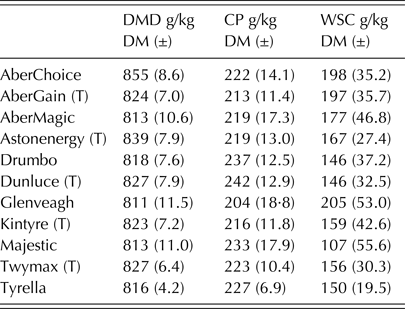
There were significant (P < 0.001) differences among the varieties for DMD. Farm and year had no effect on DMD. The highest DMD was recorded in 2014 (832 g/kg DM) and the lowest in 2015 (817 g/kg DM). No differences in CP or WSC concentrations existed between varieties across the subset of farms.
AberChoice and Astonenergy recorded the two highest DMD values at 855 (±8.6) g/kg DM and 840 (±7.9) g/kg DM, respectively (Table 8). AberChoice had significantly (P < 0.05) higher DMD than all other varieties, with the exception of Astonenergy which was also significantly (P < 0.05) higher than AberMagic, Drumbo, Glenveagh and Tyrella.
On-farm grass quality (LS means with standard errors in parentheses) per variety across the 2014–2015 production years

DMD, dry matter digestibility; CP, crude protein; WSC, water soluble carbohydrate.
(T) denotes tetraploid varieties, all other varieties being diploid.
DISCUSSION
The current study challenges the grassland industry to embrace new methodologies to quantify the commercial phenotypic performance of grass varieties at industry level. The introduction of PBI (Hanrahan et al. Reference Hanrahan, Geoghegan, O'Donovan, Griffith, Ruelle, Wallace and Shalloo2017) and the use of routine grass measurement at farm level brings new innovations, allowing more added value to grassland research benefiting farmers and the wider industry. The current longitudinal study presents the first 3 years of a long-term study assessing the performance of varieties on commercial farms. In many respects, this methodology adds a new dimension to grassland research, by determining if the gains in grass breeding have reached the end user. This type of study can now readily engage the end user (farmer) into directing future progress in grass breeding and evaluation.
Total herbage production
Despite significant differences between individual varieties and a range of 1449 kg DM/ha between the highest- and lowest-yielding varieties there was a non-significant effect of variety on total herbage DM production. Large variation in herbage production can exist between farms, as previously shown by Shalloo et al. (Reference Shalloo, Creighton, O'Donovan, O'Donovan and Hennessy2010) who found individual paddocks ranged from 6300 to 17 000 kg DM/ha on dairy farms within the Munster region. The current study investigated a much wider array of environments and included each province of Ireland, resulting in a larger production range from 6609 to 19 757 kg DM/ha between paddocks across farms. The wide range in paddock soil fertility and regional meteorological conditions contributed to the level of variation in on-farm herbage production. The absence of farm × variety effects for any of the traits evaluated was in part due to the homogeneity of farms’ grazing management, as each implements a spring-calving, grass-based system operating at high stocking rates using minimal concentrate supplementation over an extended grazing season.
In the current study, sward age and year significantly influenced herbage production. Variation in the meteorological conditions experienced across the seasons of each year are likely to have contributed to significant year effects, as soil temperature, air temperature and evapotranspiration are major factors determining herbage production (Hurtado-Uria et al. Reference Hurtado-Uria, Hennessy, Shalloo, O'Connor and Delaby2013). Seasonal extremities such as those experienced in spring 2013, where rainfall, soil and minimum and maximum air temperatures were all exceptionally low, combined to make 2013 the lowest-yielding year. As swards matured, their total DM production tended to decline, with 1-year old swards (having undergone 12-month establishment phase) yielding the highest at 14 270 (±187) kg DM/ha and 5-year old swards yielding the lowest at 12 927 (±492) kg DM/ha. Hopkins et al. (Reference Hopkins, Gilbey, Dibb, Bowling and Murray1990) also showed a yield advantage in newly sown swards, although the DM yield advantage of new swards declined at a much faster rate than in the current study.
Grazing and silage production
Grazing and silage performance indicate how well a variety performs from a grazing perspective, with more frequently grazed swards having greater DM production. Grazing yield was found to be a reliable indicator of the yield advantage of individual grass varieties due to a strong rank correlation between total and grazing performance of varieties estimated in the current study. The on-farm evaluated varieties were found to produce significantly different yields of grazed herbage. Astonenergy achieved the highest yield of grazed herbage and number of grazing events, combined with recording the lowest silage yield and number of silage harvests. Astonenergy appears to be ideally suited to an intensive grazing regime. Its suitability is illustrated by its sward structure which is of a relatively low tiller density, coupled with a long free leaf lamina, giving rise to a high leaf proportion (Wims et al. Reference Wims, McEvoy, Delaby, Boland and O'Donovan2013). This allows for lower post-grazing residuals to be achieved, thereby increasing the number of grazing events without the need to remove surplus grass.
Although there was no overall variety effect on the yield or number of silage harvests, pairwise comparisons suggest that some varieties are more suited for either grazing or conservation systems, and some varieties produced a high proportion of their total yield from silage harvests. On-farm silage yields may be a poor indicator of the DM yield advantage of varieties within grazing systems, as previous work by Cashman et al. (Reference Cashman, McEvoy, Gilliland and O'Donovan2016) found a poor relationship (R 2 = 0.18) between conservation and animal grazing DM yields. This is an important finding, as it clearly shows that varieties with specialist traits have a major role in improving grazing performance; however, such varieties and their traits need to be identified at an earlier stage. This raises the question of the need to introduce grazing indicator traits into Recommended List evaluations.
On evaluation farms, silage is generally harvested from a variety where excessive pre-grazing herbage mass exists or where poor animal preference is expressed due to sward structural characteristics, all of which can contribute to poor grazing residuals (Ganche et al. Reference Ganche, Delaby, O'Donovan, Boland and Kennedy2014). A greater emphasis on grazing and seasonal rather than total herbage production serves as an indirect means of promoting varieties with more stable mid-season quality, as selection based on total production can lead to varieties which experience a sharp decline in mid-season quality (Stewart & Hayes Reference Stewart and Hayes2011).
Persistency
Persistency has the highest economic weighting in the Pasture profit index (PPI), which is a total economic index for grass variety selection in Ireland (O'Donovan et al. Reference O'Donovan, McHugh, McEvoy, Grogan and Shalloo2017). This is unsurprising given that each unit loss in ground score equates to a loss of 1683 kg DM/ha/yr (Cashman et al. Reference Cashman, O'Donovan, Gilliland, McEvoy and Diskin2014). On-farm varieties were shown to have significantly different sward densities, with ground score differing by year, farm and year × variety. Similar to Tozer et al. (Reference Tozer, Chapman, Bell, Crush, King, Rennie, Wilson, Mapp, Rossi, Aalders and Cameron2014) the current study has shown that sward age had a non-significant effect on sward density; this result is attributed to the fact that these swards are relatively young and, therefore, sward age was not a limiting factor to date.
Glenveagh had the highest mean ground score value over the 3 years; this may suggest that this variety has favourable persistency based on ground score. This variety also had the highest rate of ground score change reducing by 1.4 units between 2013 and 2015. This result supports the findings of Donald (Reference Donald1963) and Lee et al. (Reference Lee, Thom, Wynn, Waugh, Rossi and Chapman2017), who found that dense swards can create excessive intra-plant competition, resulting in sward thinning. In general, varieties of a higher tiller density had a higher rate of ground score change.
Tetraploid varieties had a lower rate of ground score change in comparison to diploid varieties, with a reduction of 0.56 and 0.85 ground score units, respectively, between 2013 and 2015. Astonenergy had the lowest mean ground score value (3.6) over the 3-year evaluation period, but also had the lowest rate of change, implying favourable persistence under animal grazing. The open nature of Astonenergy results in the development of large tillers (Hernández Garay et al. Reference Hernández Garay, Matthew and Hodgson1999), creating an ideal structure for grazing by animals (Wims et al. Reference Wims, McEvoy, Delaby, Boland and O'Donovan2013).
McDonagh et al. (Reference McDonagh, O'Donovan, McEvoy and Gilliland2016) found no evidence of genetic gain for sward density in perennial ryegrass varieties; although non-significant, sward density had a tendency to decline, reducing by 3.8% from 1973 to 2013. These results are supportive of the difficulties previously outlined by Wilkins & Humphreys (Reference Wilkins and Humphreys2003) in combining high DM yield potential and good persistency. With poor genetic gain being reported for traits associated with persistence, a focus must be placed on evaluation practices. Plot-based evaluations expose varieties to minimal levels of stress resulting in differing levels of persistence being achieved in cut plot and animal grazing managements of varieties over the same period (Kerr et al. Reference Kerr, Chapman, Thom, Matthew, Van Der Linden, Baird, Johnston and Corkran2012).
Long-term studies under ‘commercial’ conditions need to be implemented to fully assess persistence (Wilkins & Humphreys Reference Wilkins and Humphreys2003; Kerr et al. Reference Kerr, Chapman, Thom, Matthew, Van Der Linden, Baird, Johnston and Corkran2012). By increasing the level of pressure imposed upon varieties, differences in their persistence should be identifiable at an earlier stage, allowing breeders to identify superior parent plants to develop improved varieties.
High levels of intra-plant competition can create increased levels of plant mortality and self-thinning due to excessive competition for resources (Donald Reference Donald1963; Lee et al. Reference Lee, Thom, Wynn, Waugh, Rossi and Chapman2017). Alongside possible reductions in DM production and increased tiller senescence, high sward density can impact negatively on sward structural characteristics, creating difficulties in achieving desired animal intakes (Hodgson Reference Hodgson1981; Forbes Reference Forbes1988) and target post-grazing residuals.
A commonly used measure of pasture persistence is DM yield stability (Kerr et al. Reference Kerr, Chapman, Thom, Matthew, Van Der Linden, Baird, Johnston and Corkran2012; Lee et al. Reference Lee, Thom, Wynn, Waugh, Rossi and Chapman2017), as many swards may have a low density of tillers but yet support high levels of productivity due to reduced intra-plant competition. Varieties such as AberGain, Astonenergy, Dunluce, Glenveagh, Kintyre, Twymax and Tyrella appeared to have good yield stability as their DM production increased year on year; the remaining varieties (each of which were diploid varieties) all experienced reduced DM production in either 2014 or 2015. Diploid varieties have a higher tiller density than tetraploids (Neuteboom et al. Reference Neuteboom, Lantinga, Wind and Lemaire1988), therefore, excessive intra-plant competition may be compromising yield stability of diploid swards. Longer time frames which allow swards to mature are required to assess DM yield stability as outlined by Parsons et al. (Reference Parsons, Edwards, Newton, Chapman, Caradus, Rasmussen and Rowarth2011). Examining the cumulative yield of varieties over 5- or 10-year periods would provide a better indication, however this is unrealistic and could reduce the rate of genetic gain for persistence as it would increase the generation interval between existing and new varieties.
Quality
In vitro DMD values recorded on the subset of farms were high, ranging from 811 to 855 g/kg DM. Grass variety had significant effects on digestibility, as did farm and year effects. Farm effects derived from management practices, such as short rotation length, can have positive effects on sward DMD concentration while maintaining high proportions of leaf to stem.
In vitro DMD acts as the best single gauge of the nutritional value of a wide range of forage species and varieties (Casler Reference Casler2001). This parameter can also provide an indication of variety grazing preference. In vivo measures of DMD have been shown to explain 0.80 of the variation in the voluntary intake among temperate forage species (Armstrong et al. Reference Armstrong, Common and Smith1986). The assessment of on-farm DMD provides criteria to select for improved herbage quality. In many evaluations, DMD results are omitted as insufficient variation necessary for genetic gain exists between species and varieties of similar heading date (Wilkins Reference Wilkins1997). To overcome such issues as varieties used having similar heading dates, herbage quality (DMD) was measured from mid to late summer on-farm to determine varietal ranking in DMD, as ample variation exists in this period.
It is clear from the current study, and feedback to date, that an indicator of animal grazing preference needs to be introduced into grass variety evaluation protocols. While grass digestibility is a good indicator it requires supplementary information to assist grassland farmers with variety selection.
CONCLUSION
The current study demonstrates that perennial ryegrass varieties can be evaluated on commercial farms. This is important in identifying suitable varieties which will maintain and further enhance Ireland's competitive advantage as a low-cost producer of animal derived proteins.
Overall, variety was found not to affect total herbage production on-farm, but grazing yield differed by variety. The yield of grazed herbage is strongly correlated with total yield but is more informative and of primary importance within an intensive grazing regime. The evaluation of grazed herbage production for individual varieties is unique to on-farm evaluations and the current study. There was no evidence that seasonal productivity differed by variety despite it being of primary importance as a breeding objective. On-farm varieties were shown to form swards of differing densities. In general, the varieties which formed swards of a higher density had the highest reductions in density over the evaluation period. On-farm proved to be a suitable environment to assess sward quality as varieties were shown to contain differing concentrations of DMD. The number of grazing events achieved is a new and worthwhile parameter of importance to grassland farmers due to its positive effect on herbage production and its indication of varieties grazing suitability.
The level of variability in on-farm data is challenging and needs to be overcome in the future through increased sample size and cumulative years’ data. Not only does the current study demonstrate the importance of on-farm varietal evaluation, but also it examines the value of a variety under an intensive grazing regime. The current study has increased the level of understanding on individual varieties’ true agronomic potential. To further develop the strategy of on-farm multi-location evaluation of varieties, new criteria such as grazing efficiency, longevity and farmer satisfaction could be assessed across increased grazing environments throughout Ireland. Current and future developments in grass evaluations in Ireland need to result in the delivery of improved varieties suited to intensive grazing environments, this methodology can advance this challenge.