INTRODUCTION
Global demand for beef is expected to rise at a rate of 0·015 per year between 2010 and 2020 with developing countries dominating production, while countries from the Asian-Pacific, Latin American and oil-exporting countries become the main consumers (OECD/FAO 2011). Increased demand impacts environmental degradation, particularly greenhouse gas (GHG) emissions that contribute to climate change and variability. Ruminants are considered a major source of methane (CH4) emissions, which are higher in those fed high-fibre diets or at pasture (Beauchemin et al. Reference Beauchemin, Kreuzer, O'mara and McAllister2008; De Klein et al. Reference De Klein, Pinares-Patino, Waghorn and McDowell2008; Ellis et al. Reference Ellis, Dijkstra, Kebreab, Bannink, Odongo, McBride and France2008). In this context of more sustainable animal production, Chile fulfils seven of the nine criteria defined by the United Nations Framework Convention on Climate Change for environmental vulnerability (UNFCCC 1992). Chile is considered socially, economically and environmentally vulnerable (CEPAL 2009), constituting key limitations to sustainable beef sector development. Therefore, the consequences of not taking action to reduce GHG emissions could cause significant risks to many production sectors in the country (Linneberg et al. Reference Linneberg, Rojas and Balbontín2011). Chile has voluntarily committed itself to implement nationally appropriate mitigation actions to achieve a 0·20 reduction below the business-as-usual emissions growth trajectory by 2020 (MMA 2011).
Methane is the second most important GHG in Chile, representing 0·27 and 0·21 of total carbon dioxide equivalents (CO2eq) for years 2000 and 2006, respectively. A great proportion of this CH4 comes from enteric fermentation (MMA 2011). More than 0·70 of cattle in Chile are concentrated in the southern regions with most reared on pasture and some in feedlots. Therefore, these regions are important contributors to CH4 national emissions. Intensive production systems are found in Central Chile and make greater use of industrial by-products. The methodology used in Chile to develop GHG inventories, particularly enteric CH4 emissions, is based on the Intergovernmental Panel on Climate Change (IPCC) recommendations (IPCC Reference Eggleston, Buendia, Miwa, Ngara and Tanabe2006), which advocate a fixed emission factor (Y m). The Y m is calculated as the proportion of dietary gross energy intake (GEI) emitted as CH4. The Y m does not consider other relevant animal or dietary characteristics that impact CH4 emissions, such as digestibility, nutrient profile, diet composition or cattle management. The Y m value used in the Chilean inventory was 0·060 of GEI (González Reference González2009), although the revised IPCC Tier 2 recommendation is 0·065 (IPCC Reference Eggleston, Buendia, Miwa, Ngara and Tanabe2006). The IPCC Tier 2 approach does not have the capacity to describe changes in dietary composition fully; therefore, its applicability is limited when the effects of different nutritional strategies on CH4 production need to be assessed (Ellis et al. Reference Ellis, Bannink, France, Kebreab and Dijkstra2010). Therefore, the objectives of the present study were to: (1) estimate CH4 emissions from different Chilean beef finishing systems using a mechanistic model; (2) evaluate the effects of production system on Y m values; and (3) compare the Y m values obtained with the IPCC Tier 2 used in the national inventory.
MATERIALS AND METHODS
General description of backgrounding and finishing systems in Chile
Chilean beef production systems are mainly concentrated in the southern region of the country, where cattle graze native and/or seeded pastures. The dominant species are perennial ryegrass (Lolium perenne L.) and white clover (Trifolium repens L.), depending on location and season of the year. Pasture growth is markedly seasonal with nearly 0·60 of the total annual yield occurring in spring, with a small second peak during autumn. A smaller number of cattle are raised and finished in the central region of the country. Calves are weaned 6–8 months after calving, weighing roughly 165–300 kg depending on feed availability, genetics and management. In Southern Chile animals are raised and finished on year-round grazed pastures, taking advantage of the pasture growth cycle. According to Toro et al. (Reference Toro, Catrileo, Aguilar and Vera2009), steers can readily be finished if cattlemen have access to well-managed pastures. This yields an average daily gain (ADG) of 0·5–1·2 kg/day (Goic & Iraira Reference Goic, Iraira and Catrileo2005). During wintertime, most cattlemen use shelters or more complex facilities to provide a better environment for cattle, avoiding rain, wind and muddy conditions. Finishing diets in the south include cereal grains (i.e. oats, barley and triticale) whose inclusion is not above 0·60 of the total ration and highly dependent on cost. In the central regions, rations include local by-products from the fruit and horticulture industries as well as cereal grains. For export purposes, cattlemen must be certified on one of two official control systems. In one system, animals are allowed to receive growth implants and other additives such as ionophores. Animals from British breeds and crossbreds (medium frame score) are slaughtered at 420–450 kg body weight (BW), whereas Continental breeds (larger frame score) are slaughtered at 500–550 kg BW (Claro & González Reference Claro, González and Catrileo2005; Rojas & Catrileo Reference Rojas, Catrileo and Catrileo2005).
Model description
The mechanistic model COWPOLL simulates CH4 emissions from ruminants based on a series of mathematical equations describing fermentation processes in the gastrointestinal tract. The model was first developed by Dijkstra et al. (Reference Dijkstra, Neal, Beever and France1992) and adapted for methanogenesis by Mills et al. (Reference Mills, Dijkstra, Bannink, Cammell, Kebreab and France2001). The model describes utilization of feed particles by microbes in the rumen and large intestine, as well as their growth, by predicting stoichiometries of production of volatile fatty acids (VFA, based on results of Bannink et al. Reference Bannink, Kogut, Dijkstra, France, Tamminga, Van Vuuren, McNamara, France and Beever2000) and H2 as fermentation end-products. The model distinguishes between hydrogen sources and sinks, which are the basis for calculating CH4 production. The fermentation end-products are based on the interactions between three groups of micro-organisms (i.e. amylolytic bacteria, cellulolytic bacteria and protozoa) and four substrate pools (i.e. ammonia, soluble protein, amylolytic hexose and cellulolytic hexose). The model allows estimation of CH4 emissions by considering changes in dietary composition (i.e. types of carbohydrate, protein and fat), feed intake and nutritional kinetics (i.e. ruminal fractional passage rates, fluid volume and acidity). All the flows between pools of substrates, micro-organisms and fermentation end-products in the model are driven by nonlinear relationships based on enzyme kinetics (Bannink et al. Reference Bannink, Van Schijndel and Dijkstra2011). The mathematical derivation of the model of rumen digestion was published by Dijkstra et al. (Reference Dijkstra, Neal, Beever and France1992) and includes all equations and parameter values plus a diagram of the rumen processes. The rumen degradation rate of a specific substrate depends on its pool size, on pool size of the utilizing micro-organisms, rumen pH and the intrinsic fractional degradation characteristics of the substrate (Bannink et al. Reference Bannink, Van Schijndel and Dijkstra2011). A more detailed explanation of the original model, recent modifications as well as explanatory diagrams, including the CH4 sub-model, are described in Bannink et al. (Reference Bannink, Van Schijndel and Dijkstra2011). Model outputs reported in the present study were: CH4 emissions expressed in MJ/d, CH4 emissions per unit of growth and the emission factor Y m expressed as a proportion of GEI.
Data input for simulation
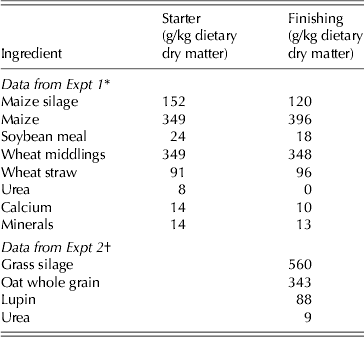
The inputs required by the model are: dry matter intake (DMI), forage to concentrate ratio (F : C), chemical composition of the diet, fractional digestion rates of the dietary components: crude protein (soluble and undegradable), non-protein nitrogen, neutral detergent fibre (NDF), acid detergent fibre (ADF), ether extract, starch and soluble carbohydrate. The fractional digestion rates of the dietary components are derived from rumen in situ incubation of feeds in the rumen (Bannink et al. Reference Bannink, Van Schijndel and Dijkstra2011). For the present study, DMI, F : C, initial BW and ADG were taken from two experiments conducted in Central and Southern Chile in 2011. They represent the traditional backgrounding and finishing systems using mixed diets for those regions. For the grazing scenarios, DMI was estimated from the literature (Goic & Iraira Reference Goic, Iraira and Catrileo2005). Chemical composition and the kinetic parameters (fractional degradation and passage rates) were estimated from the literature (Anrique et al. Reference Anrique, Fuchslocher, Iraira and Saldaña2010). In Expt 1, cattle from Pirque in the Central region of Chile (33°40′S, 70°35′W) were fed starter (backgrounding) and finisher diets, based on maize silage, maize, wheat middlings and wheat straw. Both diets used the same feedstuffs but in different proportions (Table 1). Steers were fed starter and finisher diets for 83 and 39 days, respectively. Observed average DMI were 7·3±0·62 and 9·2±0·55 kg/day (0·021 and 0·022 BW as DMI), whereas ADG were 1·1±0·22 and 1·3±0·37 kg/day during backgrounding and finishing stages, respectively. Steers were implanted (one growth implant of trenbolone acetate 140 mg+estradiol 20 mg) and received ionophores (monensin 165 mg/head/day, Nutriservice SA Santiago, Chile). Cattle were slaughtered at a mean BW of 448 kg. In Expt 2, cattle from Carillanca in Southern Chile (38°41′S, 72°25′W) were fed for 74 days during wintertime with a diet based on grass silage, oat whole grain, lupin and urea (Table 1). Observed average DMI was 9·97±0·51 kg/day (0·021 BW) and ADG was 1·10±0·24 kg/day. Steers did not receive implants or ionophores and they were slaughtered at a mean BW of 493 kg.
Composition of feedlot rations from the two representative locations for beef production systems in Chile

* The starter diet was fed for 83 days and the finishing diet for 39 days. The experiment was conducted in Pirque in Central Chile.
† The finishing diet was fed for 74 days. The experiment was conducted in Carillanca in Southern Chile.
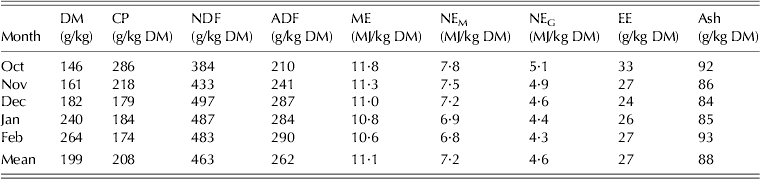
In addition to enteric CH4 emission calculations based on the previous experiments, three scenarios for grass-based finishing systems (grazing only) in La Araucanía region of Chile were assessed. These grazing-only scenarios were included because cattle in Southern Chile are raised mainly under these conditions. In two of these scenarios the same initial BW of the finishing stage as those recorded in Expts 1 and 2 were used, whereas in the third scenario an initial BW of 390 kg was assumed. In each grazing scenario the steers were assumed to graze perennial ryegrass during the spring season, with ADG=0·9 kg/day. The DMI was estimated as a proportion of NDF to BW (0·01 kg/kg), and the NDF content and nutritional composition of ryegrass during springtime (Table 2) were obtained from Anrique et al. (Reference Anrique, Fuchslocher, Iraira and Saldaña2010).
Monthly nutritional composition of fertilized ryegrass pasture in Southern Chile (Anrique et al. Reference Anrique, Fuchslocher, Iraira and Saldaña2010)

DM, dry matter content; CP, crude protein; NDF, neutral detergent fibre; ADF, acid detergent fibre; ME, metabolizable energy; NEM, net energy for maintenance; NEG, net energy for gain; EE, ether extract.
Therefore, a total of six scenarios were assessed for CH4 emissions: (a) a feedlot system from Central Chile (Pirque) using a starter (backgrounding) diet with F : C=24 : 76 (FSP-BD); (b) a feedlot system from Central Chile (Pirque) using a finishing diet with F : C=22 : 78 (FSP-FD); (c) a feedlot system from Southern Chile (Carillanca) using a finishing diet with F : C=56 : 44 (FSC-FD); (d) a grass-only system from Southern Chile simulated using initial BW from the finishing stage of Expt 1 (GB-FSP); (e) a grass-only system from Southern Chile using initial BW from Expt 2 (GB-FSC); and (f) grass-only based on a traditional finishing system for Southern Chile (GB-South). The DMI in all six scenarios were estimated monthly, considering initial BW and ADG for each period.
The latest GHG Chilean inventory report for enteric fermentation (González Reference González2009) was compared with the results of the current simulation. The Chilean national inventory used the IPCC Tier 2 approach, considering a constant emission factor (Y m) for developing countries of 0·06. In Gonzales’ study, cattle were split into two categories: dairy cattle (0·70 lactating cows and 0·30 dry cows) and beef cattle (cows, heifers, steers, bulls and calves). Then GEI was estimated for each category based on production system, i.e. grazing or confined. The latter was applied only to dairy cows. Those estimations did not consider the utilization of technologies such as ionophores or bovine somatotropin hormone.
RESULTS
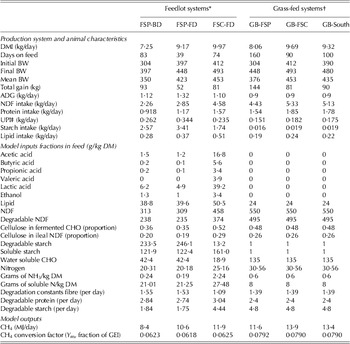
The simulation results are summarized in Table 3 for each system, as well as observed animal performance. The simulation outputs are divided into two categories as a function of type of diet: (a) feedlot systems based on Expts 1 and 2 and (b) grass-only systems. The Y m were calculated from the model estimate of CH4 emissions under a given scenario and the GEI for that scenario. The Y m ranged from 0·062 to 0·079 of GEI, being smaller for those finishing systems that include a lower proportion of roughage in the diet. On average, cattle finished in feedlot systems lost 0·062 of GEI as CH4, whereas grass-only cattle lost 0·079 of GEI, which represents an increase of 27·1% in Y m. In general, the daily rate of CH4 production was greater for diets containing higher proportions of forage. The difference in Y m between feedlot systems was only 0·011.
Simulated methane emissions and observed animal performance based on feedlot experiments

* FSP, feedlot production system located at Pirque in Central Chile. BD and FD correspond to starter (backgrounding) and finishing diet, respectively; FSC, feedlot production system located at Carillanca in Southern Chile; FD corresponds to finishing diet. Details of diets are given in Table 1.
† GB-South represents a traditional production system in Southern Chile (grazing perennial ryegrass pasture). The other two scenarios (GB-FSP and GB-FSC) utilized the same information for DMI, initial and final BW as well as ADG as those specified for scenarios FSP-FD and FSC-FD, respectively, but switching the feedlot diet for ryegrass pasture as described for GB-South. In all grass-based scenarios ADG was assumed to be 0·9 kg/day and DMI 1% NDF as a proportion of BW.
‡ UPI, undegradable
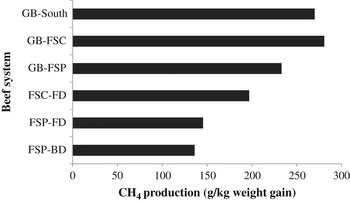
Figure 1 shows CH4 production per kg of gain during the finishing period for each system and also for the starter period (backgrounding) in the Central Chilean system (FSP-BD). The amount of CH4 emitted per kg of gain was lowest with diets that included highest levels of concentrate (FSP-BD and FSP-FD, with c. 75% concentrates). When steers were fed a moderate concentrate diet (FSC-FD with c. 44% concentrates) they produced 1·4 times more CH4 (141 v. 197 g/kg of gain), and 1·75 times more when fed a forage-only diet (141 v. 247 g/kg of gain).
Enteric methane production (g/kg weight gain) for Chilean beef systems. FSP, feedlot production system located in Central Chile (Pirque); FSC, feedlot production system in Southern Chile (Carillanca). BD and FD correspond to starter (backgrounding) and finishing diet, respectively; GB-FSP and GB-FSC are grass-based systems that utilized the same information for DMI, initial and final BW as those specified for scenarios FSP-FD and FSC-FD, respectively; GB-South is a traditional grass-based production system in Southern Chile. In all grass-based scenarios ADG was assumed to be 0·90 kg/day and DMI 1% NDF as a proportion of BW (see text for details).

DISCUSSION
Energy lost as CH4 from cattle ranges from 0·02 to 0·12 of GEI (Johnson & Johnson Reference Johnson and Johnson1995). The highest values are associated with diets rich in low-quality fibre, whereas the lowest values are associated with highly intensive feedlots using diets rich in grain (>0·80). There is evidence that CH4 emissions from feedlot cattle are greater during the backgrounding phase than during the finishing phase, due mainly to the characteristics of the diet supplied. For instance, Beauchemin & McGinn (Reference Beauchemin and McGinn2005) reported Y m values of 0·074 v. 0·034 for the backgrounding and finishing phases, respectively: the proportions of forage used were 0·70 and 0·09 for the respective phases. In another experiment, Beauchemin & McGinn (Reference Beauchemin and McGinn2006) reported that growing beef cattle fed a high or low forage diet (70 : 30 and 30 : 70 barley silage and barley, respectively) had Y m values of 0·064 and 0·059, respectively. The results obtained in the current simulation analysis are closer to those reported for the backgrounding phase and for growing cattle, due mainly to the lower amounts of concentrate used in Chilean finishing systems (0·44–0·78) compared to the USA and Canada (>0·90). Although the Y m values for feedlot finishing diets were lower than for grass-only diets, the differences were not as great as expected. This could be due to high pasture quality, especially during springtime, resulting in lower Y m compared to studies with poor quality forage which gives greater Y m values. For instance, Riquelme & Pulido (Reference Riquelme and Pulido2008) reported in vitro dry matter digestibility values of 0·78 for spring pastures in Southern Chile, a value slightly lower than those reported by Quinn et al. (Reference Quinn, May, Di Lorenzo, Ponce, Smith, Parr and Galyean2011) for high-grain diets, which ranged from 0·83 to 0·85. Ominski et al. (Reference Ominski, Boadi and Wittenberg2006) reported that CH4 emissions are influenced by pasture quality and availability, with highest CH4 emissions (0·113 of GEI) observed when quality was low and DM availability limited. Likewise, Boadi et al. (Reference Boadi, Wittenberg and McCaughey2002) concluded that when cattle graze high-quality forage there is a decline in CH4 production, adding that the effects of grain supplementation on CH4 production are marginal when cattle graze good quality pastures. In addition, CH4 production has been positively correlated with organic matter intake and proportion of NDF (Archimède et al. Reference Archimède, Eugène, Marie Magdeleine, Boval, Martin, Morgavi, Lecomte and Doreau2011). Bannink et al. (Reference Bannink, Smits, Kebreab, Mills, Ellis, Klop, France and Dijkstra2010), using a mechanistic Tier 3 simulation model, reported grass net energy content increased from 6·3 to 6·8 MJ/kg DM with an increase in N fertilization from 150 to 450 kg N/ha/year, and the Y m in dairy cattle fed fresh grass herbage decreased from 0·070 to 0·063 with this increased fertilization level. Jones et al. (Reference Jones, Phillips, Naylor and Mercer2011) demonstrated that cattle with high feed efficiency (low residual feed intake) have the potential to contribute to reduced CH4 emissions under grazing systems when provided with a pasture source of high nutritional quality. As a consequence, Jones et al. (Reference Jones, Phillips, Naylor and Mercer2011) suggested that pasture quality plays a significant role in the extent to which CH4 production can be reduced with grain supplementation in grazing animals. The results are particularly relevant to Chilean finishing systems, for they utilize cereal grains (e.g. oats, triticale and barley) or legume grains (e.g. lupin) as strategic supplements during grazing periods depending on price.
The mechanistic model employed in the current paper, COWPOLL, has been widely tested and compared with field data from dairy and beef cattle in the US (Kebreab et al. Reference Kebreab, France, McBride, Odongo, Bannink, Mills, Dijkstra, Kebreab, Dijkstra, Gerrits, Bannink and France2006, Reference Kebreab, Johnson, Archibeque, Pape and Wirth2008), showing reliable and accurate predictions. Kebreab et al. (Reference Kebreab, France, McBride, Odongo, Bannink, Mills, Dijkstra, Kebreab, Dijkstra, Gerrits, Bannink and France2006, Reference Kebreab, Johnson, Archibeque, Pape and Wirth2008) also concluded that using IPCC Tier 2 can result in an overestimate and underestimate of CH4 emissions by c. 12·5 and 9·8% for dairy and feedlot cattle, respectively. However, COWPOLL was less accurate in predicting CH4 emissions from beef compared to dairy cattle (Kebreab et al. Reference Kebreab, Johnson, Archibeque, Pape and Wirth2008). This could be for a number of reasons, including the use of high-grain diets in beef cattle that can impact fluid volume in the rumen and fractional rate of passage, as well as impact the effect of pH on VFA stoichiometry. Moreover, most beef research reported from North America uses ionophores and other additives as part of the diet, which reduce the Y m values due to improved feed efficiency and increased proportion of propionate to acetate in the rumen (Johnson & Johnson Reference Johnson and Johnson1995). The COWPOLL model does not include a CH4 reducing effect for the inclusion of ionophores in the diet. However, Ellis et al. (Reference Ellis, Dijkstra, Bannink, Kebreab, Hook, Archibeque and France2012) recently developed equations to estimate monensin dose-dependent changes in VFA profile and its effect on enteric CH4 production in high-grain-fed beef cattle: their work showed that the inclusion of monensin in the diet increased the molar proportions of propionate and at the same time decreased the molar proportions of acetate and butyrate. Therefore, the simulated CH4 production of diets including monensin in the current paper probably overestimates the actual CH4 production. Appuhamy et al. (Reference Appuhamy, Strathe, Jayasundara, Wagner-Riddle, Dijkstra, France and Kebreab2013) estimated that monensin can reduce enteric CH4 emissions from 14 to 16% in cattle. The simulated results are in agreement with other reports. For example, McGinn et al. (Reference McGinn, Beauchemin, Coates and Colombatto2004) reported that CH4 emissions averaged 0·065–0·071 of GEI in two experiments using similar diets to those used in the current simulation analysis. Similarly, McGeough et al. (Reference McGeough, O'Kiely, Foley, Hart, Boland and Kenny2010a ) reported Y m ranging from 0·063 to 0·084; their experiment assessed the effects of four different times to harvest maize for ensiling and compared them with the effects of an ad libitum concentrate diet, which yielded the lowest value of Y m. Similar values were also reported by Harper et al. (Reference Harper, Denmead, Freney and Byers1999) for cattle grazing on pastures (Y m=0·077−0·084), but these decreased when the same cattle switched to a high-grain diet (Y m=0·019−0·022). Nevertheless, the implementation of this model to predict CH4 emissions for the Chilean national inventory requires validation to confirm its accuracy and reliability under the local conditions. At present, the sulphur hexafluoride tracer technique (SF6) to estimate CH4 emissions is being validated in Chile. In addition, the fermentation stoichiometry coefficients of VFA of the model should be tested and also validated with local cattle, because the actual stoichiometry of the model is based on lactating Friesian dairy cows (mostly Holstein–Friesian) under different lactation stages. Therefore, this coefficient may not be representative of the fermentation conditions in the rumen of Chilean beef cattle. Although most pastures in Southern Chile are mixtures of grasses (e.g. ryegrass, orchard grass and tall fescue) with some legumes (e.g. white clover, red clover and Medicago spp.), it was assumed for simulation purposes that cattle grazed a pure ryegrass pasture, due to lack of information about the proportion of other grasses and legumes in the pasture. In addition, there has been a trend in recent years for cattlemen to use pure ryegrass pastures. However, the presence of legumes may contribute to reduce CH4 emissions. In an experiment with cattle grazing tall fescue (Schedonorus phoenix (Scop.) Holub) with or without ladino white clover (T. repens L.), Pavao-Zuckerman et al. (Reference Pavao-Zuckerman, Waller, Ingle and Fribourg1999) reported 0·20 less CH4 emissions when clover was present in the pasture. Similarly, Benchaar et al. (Reference Benchaar, Pomar and Chiquette2001) reported that CH4 production is lower with legume than with grass forage (−28%), while Buddle et al. (Reference Buddle, Denis, Attwood, Altermann, Janssen, Ronimus, Pinares-Patino, Muetzel and Wedlock2011) reported 0·15 less CH4 emissions with white clover (one of the most common legumes found in grazed systems) compared to perennial ryegrass when fed as a pure diet. In addition, there is evidence that tannins (present in many legumes and other plants) are effective in reducing CH4 emissions from enteric fermentation (Puchala et al. Reference Puchala, Min, Goetsch and Sahlu2005; Hess et al. Reference Hess, Tiemann, Noto, Carulla and Kreuzer2006; Grainger et al. Reference Grainger, Clarke, Auldist, Beauchemin, McGinn, Waghorn and Eckard2009), although the presence of tannins can result in reduced digestibility and intake levels which affect CH4 production when expressed per unit of daily gain.
Daily CH4 emissions in the current simulation analysis were between 152 and 253 g/day, with higher values associated with grass-based systems. These values were greater than those reported by DeRamus et al. (Reference DeRamus, Clement, Giampola and Dickison2003) for young heifers (89–180 g/day), but similar to those for mature cows (165–294 g/day), both grazing ryegrass pasture. In another experiment, Pavao-Zuckerman et al. (Reference Pavao-Zuckerman, Waller, Ingle and Fribourg1999) reported daily CH4 emissions ranging from 95 to 200 g/day for steers and 150–240 g/day for cows. Diets containing more grain increase the starch content available to microbes in the rumen, resulting in a shift in the end-products of fermentation with an increase in propionic acid production at the expense of acetic acid and H2 production. This deprives the methanogen archaea of hydrogen as a source for CH4 production (Ellis et al. Reference Ellis, Dijkstra, Kebreab, Bannink, Odongo, McBride and France2008) and at the same time improves productive animal response. McGeough et al. (Reference McGeough, O'Kiely, Hart, Moloney, Boland and Kenny2010b ) reported that nutritional manipulation through increasing the grain content of the diet resulted in a 0·39 reduction in CH4 output per kilogram of carcass gain. Improving feed efficiency and animal performance are effective means of reducing CH4 emissions in beef cattle (McGeough et al. Reference McGeough, O'Kiely, Hart, Moloney, Boland and Kenny2010b ; Waghorn & Hegarty Reference Waghorn and Hegarty2011).
The latest Chilean GHG inventory employed the recommendations of the IPCC Tier 2 to estimate enteric CH4 losses, but instead of using the most recent value for Y m of 0·065, used a Y m of 0·060 from a previous version of the IPCC (Reference Houghton, Meira Filho, Lim, Treanton, Mamaty, Bonduki, Griggs and Callander1996). In 2006, the IPCC modified the Y m to 0·065±0·010 for dairy cattle plus other cattle fed with low-quality forages or by-products, and 0·030±0·010 for feedlot cattle. The calculation of GEI in the Chilean inventory did not take into account differences in type of diet. Previously, Ellis et al. (Reference Ellis, Bannink, France, Kebreab and Dijkstra2010) evaluated the IPCC Tier 2 model against a large set of independent dairy cattle data and concluded that it does not have the capacity to describe fully changes in fermentation as a result of changes in dietary composition, and is less useful when estimating impacts of various nutritional strategies on CH4 emissions. Alemu et al. (Reference Alemu, Dijkstra, Bannink, France and Kebreab2011) showed that COWPOLL, the same model as used in the present study, was far more accurate in predicting CH4 emissions from dairy cattle than the IPCC Tier 2 approach, and gave predictions of CH4 emissions in response to dietary changes that are more credible than empirical approaches. Similar conclusions were reached by Kebreab et al. (Reference Kebreab, Johnson, Archibeque, Pape and Wirth2008) who compared mechanistic models with IPCC Tier 2 in feedlot situations in the USA. Even if a Y m of 0·065 is used instead of 0·06 in the Chilean GHG inventory, it will not represent Chilean beef production systems adequately. The current results show that cattle fed during the backgrounding and finishing phases, including those fed diets with concentrates ranging from 0·44 to 0·78 inclusion rates, had a Y m value above 0·060 but below 0·065 of GEI. Moreover, cattle under grazing conditions without supplementation reached Y m values close to 0·08 of GEI, which is well above the most recent IPCC recommendations. Johnson & Johnson (Reference Johnson and Johnson1995) indicate that up to 0·12 of GEI can be lost as CH4 in cattle fed high-fibre diets. The Y m value of 0·08 mentioned earlier represents 33% greater than the value used in the last Chilean inventory, i.e. a third more in CH4 emissions per head per year. Due to the lower growth rate of cattle under grazing conditions compared to high-grain-fed cattle, there was a 75% difference in CH4 emissions per kg gain. Several authors (e.g. Benchaar et al. Reference Benchaar, Rivest, Pomar and Chiquette1998; Kebreab et al. Reference Kebreab, France, McBride, Odongo, Bannink, Mills, Dijkstra, Kebreab, Dijkstra, Gerrits, Bannink and France2006, Reference Kebreab, Johnson, Archibeque, Pape and Wirth2008; Ellis et al. Reference Ellis, Bannink, France, Kebreab and Dijkstra2010; Alemu et al. Reference Alemu, Dijkstra, Bannink, France and Kebreab2011) have demonstrated that mechanistic models, and particularly COWPOLL, are capable of predicting enteric CH4 emissions and Y m values with reliable accuracy compared to empirical constructs such as the IPCC recommendations. Thus, national CH4 emission inventories would benefit from using mechanistic models that are diet specific to adjust the Y m values by regions or macro-region. However, its further evaluation against field data as they become available is highly recommended.
The limitation of the current approach is that the mechanistic model has not been fully evaluated using locally available data. At the moment such data are scarce, but as these become more available the model can be evaluated under different local scenarios. If a systemic error is observed, some of the parameters describing digestion and absorption of nutrients could be calibrated to reflect the reality of the production system. It is anticipated that with further modifications that may include changes to VFA stoichiometry and other parameter estimates, Chile can move towards a Tier 3 approach similar to that practiced in the Netherlands (Bannink et al. Reference Bannink, Van Schijndel and Dijkstra2011).
IMPLICATIONS
Adoption of mechanistic models should provide more accurate and reliable estimates of enteric CH4 emissions at different levels and conditions of production (e.g. farm, local, regional or national). In addition, these models provide a valuable tool to assess different scenarios for feeding management prior to implementation at the farm level, or even as a tool to promote mitigation policies at regional or national levels. In this sense, mechanistic models have the advantage of less cost and labour demand compared to other methodologies to estimate CH4. Models can greatly assist such experimental work, by helping to interpret results or suggesting how to perform the experiments. In the Chilean case, the government is committed to reducing GHG emissions but there are no local studies of mitigation options or experiment-based quantification of emissions. The present simulation analysis demonstrates how producers may quantify their current level of emissions and assess their ability to implement mitigation options to reduce these emissions.
This work was supported by the Chilean National Fund for Science and Technology (FONDECYT, Project 11121320; Santiago, Chile). Additionally, the first author acknowledges the funds granted by the Global Research Alliance and Norman E. Borlaug International Agricultural Science and Technology Fellowship Program. US Department of Agriculture.