


Introduction
Biological materials have evolved over millions of years and often are found as complex composites with superior properties compared to their relatively weak original constituents. The toughness of spider silk, the strength and light weight of bamboo, self-healing of bone, high toughness of nacre, and the adhesion abilities of the gecko’s feet are a few of the many examples of high-performance biological materials. Hard biomaterials such as bone, nacre, and dentin have intrigued researchers for decades for their high stiffness, toughness, and self-healing capabilities. They have been reviewed in the context of their hierarchical structure, material properties, and failure mechanisms,Reference Fratzl and Weinkamer1–Reference Dubey and Tomar5 with particular emphasis on their light weight, and the simultaneous possession of high toughness and mechanical strength. Such materials often combine two properties that are contradictory, but essential for their functioning. A unique feature that determines their properties is interfacial interaction between organic and inorganic phases in the form of protein (e.g., chitin [CHI] or tropocollagen [TC])-mineral (e.g., calcite [CAL] or hydroxyapatite [HAP]) interfaces, for example, as in bone and marine exoskeleton. The size of the protein-mineral interface can be enormous, as the mineral components have nanoscale dimensions (i.e., a uniform dispersion of nanoelements leading to an ultralarge interfacial area). For example, in a raindrop-sized volume of natural nanocomposite, the area of the interfacial region can be as large as a football field.Reference Vaia and Giannelis6
In structural studies of such biological materials, it is observed that at the mesoscale (∼100 nm to a few µm), the mineral crystals are preferentially aligned along the length of the organic phase polypeptide molecules in a hierarchical arrangement (e.g., staggered or Bouligand pattern [multiple layers stacking with each other with a total 180o rotation leading to the “helicoidal structure”]), see Figure 1.Reference Landis, Hodgens, Song, Arena, Kiyonaga, Marko, Owen and Mcewen7–Reference Al-Sawalmih, Li, Siegel, Fabritius, Yi, Raabe, Fratzl and Pris11 Interfaces are perceived to play a significant role in stress transfer and the consequent improvements in stiffness and strength of such material systems. However, exactly how a change in the interfacial chemical configuration implies a change in mechanical properties in such materials is a subject of much debate. The length scale and complexity of the microstructure of hybrid interfaces in biological materials make it difficult to study them and to understand the underlying mechanical principles, which are responsible for their extraordinary mechanical performance. Hence, the mechanisms governing the mechanical behavior of such biomaterials have not been understood completely thus far.
A schematic of the hierarchical structure of (a) bone,Reference Dubey and Tomar25–Reference Dubey and Tomar30 from the highest to the lowest length scale: Longitudinal cross-section of the end of a human femur showing the trabecular bone inside; microstructure of trabecular bone resembling a honeycomb structure; scanning electron microscope (SEM) image of the strut-like structures in the microporous structure; one such trabecular strut; a fracture surface of human bone showing mineralized collagen fibrils; and a schematic of staggered and layered assembly of tropocollagen molecules and hydroxyapatite platelets to form a mineralized collagen fibril. (b) Shrimp exoskeleton,Reference Qu, Tomar, Bajaj, Zavattieri, Koslowski and Siegmund19,Reference Qu, Verma and Tomar49,Reference Qu and Tomar50 from the highest to the lowest length scale: Whole shrimp; SEM image of the extracted carapace; SEM image of the full cross-section of the shrimp exoskeleton; laminated structure of exoskeleton microstructure; and a mineralized chitin fibril formed by chitin molecules and calcite platelets.

One of the most important aspects of understanding the influence of interfaces on natural material properties is the knowledge of how stress transfer occurs across organic–inorganic interfaces. The multi-component hierarchical structure of biomaterials results in organic–inorganic interfaces appearing at different length scales (i.e., between the basic components at the nanoscale, between the mineralized fibrils at the microscale, and between the layers of the multilayered structures at the micro- or macroscale) (see Figure 1). Yet, the majority of multiscale approaches for biological materials deal with the upscaling of bulk properties (related to elasticity, viscoelasticity, poroelasticity, or strength), from the scale of basic constituents up to the macroscopic scale of boneReference Morin and Hellmich12–Reference Fritsch and Hellmich15 or invertebrate exoskeleton.Reference Nikolov and Raabe16 However, recent progress in materials science and mechanics provides explicit access to interfacial properties as the origin of the overall bulk properties of the material, such as viscoelasticityReference Shahidi, Pichler and Hellmich17 or strength.Reference Fritsch, Dormieux, Hellmich and Sanahuja18 Accordingly, well-validated multiscale models for bone elasticityReference Fritsch and Hellmich15 and viscoelasticityReference Eberhardsteiner, Hellmich and Scheiner13 allow for straightforward top-down estimation of interfacial stresses occurring in the extrafibrillar space of bone. This is reviewed in more detail in the last two sections of this article, complementing the first two sections that cover bottom-up approaches to interface mechanics via molecular simulations.Reference Qu, Tomar, Bajaj, Zavattieri, Koslowski and Siegmund19–Reference Dubey and Tomar30
Understanding interface mechanics by means of molecular simulations
Several experimental studies have been performed to understand the mechanical behavior of bone and similar hard biological materials at the nanoscale.Reference Lees and Prostak31–Reference Thurner, Erickson, Jungmann, Schriock, Weaver, Fantner, Schitter, Morse and Hansma40 However, experiments to date have not yet measured interfacial strength at the nanoscale interfaces in such materials as a function of interface deformation properties. As mentioned earlier, such measurements are extremely important for the reliable prediction of material behavior at the macroscale. In the absence of such experiments, molecular simulation-based models can play an important role in predicting interface deformation and interface strength-affected material behavior. In bone, where HAP nanocrystals both reside in the hole zones of collagen fibrils and also form larger clusters in the extrafibrillar space,Reference Lees and Prostak31–Reference Hellmich and Ulm34 the mechanical interactions between TC molecules and HAP mineral have been fairly thoroughly analyzed using experiments, modeling, and simulations based on molecular dynamics (MD) schemes.
Among the pioneers in the field are Katti and Katti along with their co-workers,Reference Bhowmik, Katti and Katti20,Reference Bhowmik, Katti, Katti, Devanathan, Caturla, Kubota, Chartier and Phillpot24 who have performed a series of MD and steered molecular dynamics (SMD) simulations in order to understand the interactions between protein and mineral (HAP or aragonite) molecules in biomaterials, see Figure 2a. The number of hydrogen bonds was analyzed as a function of deformation and was confirmed as the main contributing factor of the binding mechanism between the mineral-protein interfaces.Reference Katti, Pradhan and Katti22,Reference Bhowmik, Katti and Katti23 Water was pointed out to significantly influence the interactions between mineral and protein constituents.Reference Bhowmik, Katti and Katti20,Reference Katti, Pradhan and Katti22,Reference Bhowmik, Katti and Katti23 The load-deformation response (Figure 2b) of the protein indicates the effect of mineral proximity on the structural response of proteins in biomaterials (i.e., leading to a higher stiffness of protein chains and a larger amount of work for the chain unfolding process).Reference Bhowmik, Katti and Katti20–Reference Dubey and Tomar25
(a) The mineral-protein combined model showing different segments and pulling direction for steered molecular dynamics simulations. (b) Load-displacement characteristics of the organic phase (protein) in the presence and absence of inorganic mineral phase (aragonite). Reprinted with permission from Reference 24. © 2007 American Chemical Society.
Dubey and Tomar performed 3D ab initio MD (AIMD) simulations to understand atomic interactions in selected TC-HAP interfaces under tensile loading.Reference Dubey and Tomar25 However, AIMD simulations are typically limited to length scales of a few nanometers. Other work by Dubey and TomarReference Dubey and Tomar26–Reference Dubey and Tomar30 provides a mechanistic understanding of interfacial interactions in idealized TC and HAP interfacial biomaterials, considering their hierarchical organization. A 3D atomistic modeling framework combines both organic and inorganic cells to form supercells, as shown in Figure 3, and allows for consideration of both tensile and compressive loading directions. For failure analysis, the tension-shear chain modelReference Ji and Gao41,Reference Ji42 was used to estimate the interfacial shear strength and fracture localization zone width.
A schematic showing cells for molecular dynamics simulation of layered (PC1 and PC2) and staggered (SC1 and SC2) assemblies of tropocollagen and hydroxyapatite.Reference Dubey and Tomar25–Reference Dubey and Tomar30 In PC1 and SC1 cells, tropocollagen molecules (yellow) are aligned in a direction parallel to the c-axis of the hydroxyapatite crystals. In PC2 and SC2 cells, tropocollagen molecules are aligned in a direction normal to the longitudinal c-axis of the hydroxyapatite super cell. Dimensions of hydroxyapatite crystals are approximately the same in all cells. In the central graphic, tropocollagen molecules are shown as multi-color ribbons, and water molecules are shown in cyan. Note: TC, tropocollagen; HAP, hydroxyapatite.
The analyses confirm that a nanoscale staggered arrangement is a preferred structural configuration in such biological materials, maximizing the interfacial contact area under the optimal direction of applied loading with respect to the TC-HAP interface orientation. The analyses also point out that such an arrangement results in higher interfacial strength as well as higher fracture strength. In addition, such a TC-HAP nanocomposite shows toughening and strain hardening behavior, which is attributed to the reconstitution of Coulombic interactions between TC and HAP at the interface during sliding. The dominant tensile failure mechanism at the HAP-TC interface is simply the interfacial separation of TC and HAP, without significant initial HAP deformation.
The NH3+ and COO− groups in TC molecules are strongly attracted to the ions in the HAP surface (Ca2+, PO43− and OH− ions).Reference Posner and Beebe43 Since TC is a flexible chain-like molecule, it elongates on applied deformation, but cleaves off after the point when it is fully stretched. Such cleavage results in local nanoscale interfacial failure. Most biological materials in physiological systems contain water as one of their constituents. The presence of water molecules in TC-HAP biocomposites enhances the overall mechanical strength (Figure 4).Reference Dubey and Tomar27 This is attributed to the water molecule’s affinity toward charged surfaces, such as the HAP surface,Reference Posner and Beebe43 and to the NH3+ and COO− groups in TC, owing to its polar nature and capability to form strong hydrogen bonds. As a result, water acts as an electrostatic bridge between the HAP surface and TC molecules, and strengthens the TC-HAP interface. This strengthening especially plays an important role whenever relative sliding occurs between the HAP surface and TC molecules at the interface.
Tensile and compressive von Mises stress versus strain plots as functions of chemical environmentReference Dubey and Tomar25–Reference Dubey and Tomar30 in the case of (a) supercell layer SC1 loaded in the longitudinal direction and (b) supercell level SC2 loaded in the transverse direction.
Previous studies have shown that hydration also has a stabilizing effect on the collagen triple helix formed by the three polypeptide chains making up a TC molecule,Reference Simone, Vitaglaino and Berisio44 and a solvated TC molecule therefore requires more energy to untie from the HAP surface.Reference Bhowmik, Katti, Katti, Devanathan, Caturla, Kubota, Chartier and Phillpot24 Similar interaction behavior of water at the protein–mineral interface is found in nacre as well.Reference Ghosh, Katti and Katti21,Reference Barthelat and Espinosa45 Water also acts as glue between TC–TC interactions,Reference Zhang, Chippada and Jordan46 and thereby delays the failure of the overall system. Another interesting finding that emerged out of a comparison between stress-strain curves for two different hierarchical levels is that the failure of such biocomposites is predominantly strain-dependent, and not a function of ultimate strength.
Molecular mechanics targeting interface stresses
While the studies discussed so far have focused on the role of interface-related mechanisms in determining overall mechanical deformation properties, the real effect of stresses at the interfaces during the mechanical deformation was not addressed. In this context, important questions arise: For a given peak tensile strength of a given material, what proportion of total strength is attributable to interface strength? What is the contribution of interface slidingReference Phillips, Braun, Wang, Gumbart, Tajkhorshid, Villa, Chipot, Skeel, Kale and Schulten47,Reference Frankland and Harik48 in time-dependent deformation observed in a simple tension test of a given material sample?
Recently, simulations performed by Qu and TomarReference Qu, Tomar, Bajaj, Zavattieri, Koslowski and Siegmund19,Reference Qu, Verma and Tomar49,Reference Qu and Tomar50 have pointed out some important aspects for answering these questions. Figure 5 shows a schematic of the type of interfacial systems analyzed. CHI or TC molecules are embedded in-between CAL or HAP platelets, respectively. Such interfaces are then deformed under tensile and shear modes using established non-equilibrium molecular dynamics (NEMD) and SMD schemes, with a focus on measuring the interfacial shear strength in two separate deformation modes.
Schematic showing the configuration of the analyzed tropocollagen and hydroxyapatite and chitin and calcite interfaces.Reference Qu, Tomar, Bajaj, Zavattieri, Koslowski and Siegmund19,Reference Qu, Verma and Tomar49,Reference Qu and Tomar50
In order to analyze the effect of hydration on interface stress, water (WT) molecules are added to the interface region. The interface separation in Figure 5 was chosen to have one layer of TC (or CHI) molecules in the interface region. Due to computational infeasibility of performing atomistic analysis of supercells with full-length TC (or CHI) molecules, only a segment of the TC (or CHI) full-length molecule is used in the supercells. The widely used atomistic stress measure (virial stress) allows for the generation of stress–strain curves from NEMD simulationsReference Dubey and Tomar25–Reference Dubey and Tomar30 There are two loading directions (as shown in Figure 6): along the molecule length (x-axis) and transverse to the molecule length (y-axis). The simulated supercells are divided into slabs, and three diagonal components of the pressure tensor in each slab are given in the output. The virial stress tensor of each slab and the overall system at the end of the equilibration is recorded as the stress tensor up to the point where 20% strain is achieved. The procedures make it possible to estimate how the measured stress of the loaded material system is distributed inside its interfacial regions, and the stress between the interfaces can be obtained according to the behavior of the corresponding slab of the simulation system.
(a) Schematic showing the loading condition of the interfacial material system and the (b) stress–strain curve for each slab of the system from the bottom to the top layer.Reference Qu, Tomar, Bajaj, Zavattieri, Koslowski and Siegmund19,Reference Qu, Verma and Tomar49,Reference Qu and Tomar50
NEMD simulations using this procedure were performed to predict interface strength by measuring the stress–strain behavior of a thin block of atoms contained in the interfacial region. However, such simulations cannot predict the effect of interface strength on the interface separation mechanism. In order to understand this attribute, SMD simulations were performed. SMD simulations in constant speed modeReference Phillips, Braun, Wang, Gumbart, Tajkhorshid, Villa, Chipot, Skeel, Kale and Schulten47 were used to pull out the upper inorganic crystal (HAP or CAL) from the substrate inorganic crystal in order to replicate the interfacial sliding process. Similar to the case of NEMD simulations, there are two loading directions: along the molecule length (x-axis) and transverse to the molecule length (y-axis) (Figure 7). SMD force was applied to the center of mass of the upper inorganic crystals in a chosen direction. The organic molecules (TC or CHI) and WT molecules in the interface region were not under constraint. The substrate inorganic crystals were fixed at their base.
(a) Force and displacement of the steered molecular dynamics (SMD) structure as a function of time, with the schematic showing the loading condition of the SMD in constant force pulling mode, (b) curve fitting of the MD data with the viscoplastic model (F 0 is defined as the force corresponding to the zero velocity), and (c) the interfacial system is divided into slabs transverse to the loading direction (left-hand figure), and a velocity profile at different time steps is calculated based on the velocity of each slab during the sliding process (right-hand plot). The y-axis refers to the z-coordinate of the system along the transverse of the loading direction.Reference Qu, Tomar, Bajaj, Zavattieri, Koslowski and Siegmund19,Reference Qu, Verma and Tomar49,Reference Qu and Tomar50
In order to quantify the interface sliding process and failure in the interface region, a viscoplastic modelReference Frankland and Harik48 for interfacial sliding was introduced. The viscoplastic failure of the interfaces relates to the applied shear stress, τ, and to the shear velocity gradient (rate of shear deformation),  ${{\partial V} \over {\partial d}}$, after the yield stress, τ0, is reached, as
 $$\tau = {\tau _0} + \mu {{\partial V} \over {\partial d}}.$$
Here, μ is the shear viscosity of interfacial sliding, and d is defined in Figure 7c.
In order to study the effect of shear rate on the viscous behavior of the interfacial systems, different large force increments were applied to the HAP-TC-HAP (and CAL-CHI-CAL) system with one layer of TC (and CHI) molecules, due to the limited space to perform the interfacial sliding with different shear ratesReference Qu, Tomar, Bajaj, Zavattieri, Koslowski and Siegmund19,Reference Qu, Verma and Tomar49,Reference Qu and Tomar50 (Figure 7a). The shear viscosity of the HAP-HAP interface is calculated as 0.0232 Pa s. The viscosity of slurries of HAP was earlier reported to be ∼0.01–1.6 Pa s from experiments,Reference Lelievre, Bernache-Assollant and Chartier51 and the viscosity of montmorillonite hydrate was reported to be ∼0.008 Pa s from MD simulations.Reference Ichikawa, Kawamura, Fujii and Nattavut52 The thickness of the interface region, d, can be determined from the plot in Figure 7c. The yield shear stress, τY, is calculated from the critical force, F 0 (defined in Figure 7b), obtained by the curve fitting, and the interfacial area, A (Figure 7b). The failure shear stress, τF, is calculated from the interface separation force divided by the interfacial area.
Shear stress plays an important role in the failure of the examined TC-HAP and CAL-CHI composite supercells. The lower and upper bounds of the shear strength of the interfacial material systems with organic interfaces or water interfaces could be defined by the yield shear stress, τ Y, and the failure stress, τF, which are used to characterize the plastic shear deformation, where τY < τF. For each of the TC-HAP interfacial systems shown,Reference Qu, Tomar, Bajaj, Zavattieri, Koslowski and Siegmund19,Reference Qu, Verma and Tomar49,Reference Qu and Tomar50 Figure 8a displays the yield shear stress (τY) and the failure stress (τF) calculated using SMD, the interfacial shear strength calculated using NEMD (σ1), the shear strength of the organic TC phase region (or region of HAP cells with WT) (σ3) calculated using NEMD, and the tensile mechanical strength of the organic phase region (or region of HAP cells with WT) (σ4) calculated using NEMD, with respect to the various interfacial components.
Stress, Young’s modulus, and effective viscosity as functions of various interfacial structures and loading directions for (a) a hydroxyapatite (HAP) supercells consisting of two HAP cells placed over each other, either directly (HAP), separated by tropocollagen (TC), water (WT), or both (TC-WT) and loaded in the x- and y-directions, and (b) corresponding calcite (CAL) supercells in which the two CAL cells interact directly (CAL) or are separated by chitin (CHI) and/or water (CHI-WT and WT).Reference Qu, Tomar, Bajaj, Zavattieri, Koslowski and Siegmund19,Reference Qu, Verma and Tomar49,Reference Qu and Tomar50
The right-hand plot in Figure 8a compares the dependence of effective viscosity and Young’s moduli on the interface type. The HAP supercell consists of two HAP cells placed over each other with the thickness (7.5 Angstroms) of the interface region determined from the plot in Figure 7c. The WT supercell consists of the same HAP supercells, but now with WT molecules separating the two. Figure 8b shows similar results in the case of CHI-CAL interfaces.Reference Qu, Tomar, Bajaj, Zavattieri, Koslowski and Siegmund19,Reference Qu, Verma and Tomar49,Reference Qu and Tomar50 In this case, the CAL supercell consists of two CAL cells placed over each other with an interface region of 9.4 Angstroms (also determined from the plot in Figure 7c). The WT supercell consists of the same CAL supercells, but with WT molecules separating the two.
The behavior of the two types of interfacial systems is quite similar. The shear strength of the organic phase (green line, σ3) lies around the lower bounded line of the yield shear stress (blue dotted line, τY). The organic phase is the main contributor to the interfacial shear strength based on Figure 8, where the interfacial shear strength (grey line, σ1) closely matches, and is sometimes a little higher than the shear strength of the organic phases (green line, σ3). However, it is always below the upper bound defined by the failure stress (red dotted line, τF), which indicates the “catastrophic failure” of the interfaces. The mechanical strength of the organic phases (yellow line, σ4) usually lies between the lower and upper bounded line because shear deformation is usually the main contributor to the mechanical behavior of organic phases. Those points that are beyond the upper bound concern hydrated organic interfaces (i.e., TC-WT or CHI-WT). This could be attributed to the much higher contribution of the shear interaction to the overall behavior as well as the higher shear viscosity of the interfacial material systems.
Whatever differing mechanisms are observable in the different investigated systems, all interfacial shear viscosities reported for the HAP-TC-HAP system are on the order of 10–2 Pa s. A question arises as to whether this value is realistic or how it could be checked or validated by independent computational or experimental results.
Continuum micromechanics top-down access to interface viscosity of HAP-water-HAP system
In a series of papers,Reference Morin and Hellmich12–Reference Nikolov and Raabe16 it was shown how the “universal” mechanical properties of bone’s elementary constituents (hydroxyapatite, collagen, water with non-collagenous organics), their universal interaction patterns across multiple length scales, and corresponding universal composition rules for extracellular bone matrices allow for the prediction of a large variety of mechanical properties of different bone tissues observed at the macroscopic scale. In this context, the viscoelasticity of interface-penetrated extrafibrillar mineral clusters (see Figure 9c for the mineral cluster phases, where each of them is envisioned as an interface-penetrated continuum as seen in Figure 10) were identified from downscaling of different, independent macroscopic creep tests. They can be characterized by Kelvin–Voigt parameters of an exponential creep law:Reference Knauss53 a damper with viscosity of ηKV = 1.34 × 10⁵ GP s acts parallel to a spring with constant μKV = 179 MPa. Also, the recently established matrix-interface representation of hydrated creeping materials depicted in Figure 217 delivers exponential creep functions so that a straightforward Reuss averagingReference Yoon, Yang and Cowin54 over (here interface-induced) anisotropy directions uniformly oriented in space yields relations between the aforementioned Kelvin–Voigt parameters and the characteristics of the matrix-interface composite, namely, the shear modulus and Poisson’s ratio of the matrix, μS and νS, and density d and the viscosity ηi of the interface. Mathematically, these relations read as:
 $${1 \over {\mu _{K{\rm{V}}} }} = {{32d(1 - {\rm{\nu }}_s )} \over {15\mu _s (2 - {\rm{\nu }}_s )}}\, \Rightarrow \,d = {{\mu _s } \over {\mu _{K{\rm{V}}} }}\,{{15(2 - {\rm{\nu }}_s )} \over {32(1 - {\rm{\nu }}_s )}},\,\,\eta _{K{\rm{V}}} = {{5a\eta _i } \over {4\pi d}}\, \Rightarrow \,\eta _i = {{4\pi d\eta _{K{\rm{V}}} } \over {5a}}.$$
Micromechanical representation of bone material by means of a six-step homogenization scheme:Reference Fritsch, Hellmich and Dormieux14 (a) macroscopic bone structure; (b) bone microstructure; (c) extravascular bone matrix; (d) extracellular bone matrix; (e) mineralized fibril; (f) hydroxyapatite polycrystal; (g) wet collagen; and (h) hydrated mineral cluster.
Two-dimensional (2D) flat, parallel, spherical interfaces embedded in a linear elastic solid matrix. This is a 2D sketch of a three-dimensional representative volume element.Reference Fritsch, Hellmich and Dormieux14
Accounting for the shear modulus and the Poisson’s ratio of hydroxyapatite, µs = 44.9 GPa and νs = 0.24, and considering an interface radius, a = 50 nm yields the interface density parameter to be d = 0.271 and the interface viscosity to be ηi = 1.83 × 10¹² GPa s m–1. In order to finally retrieve the bulk viscosity related to the fluid within the interfaces, ηi is multiplied by the interface thickness of 1 nm, yielding ηWT = 1.83 × 10¹² Pa s. This value is 14 orders of magnitude larger than the corresponding value obtained from the MD simulations.
The most straightforward answer to this relates to the sliding speed of the crystals involved, with the water interface in between. The MD-based dislocation speed amounts to 40 m s–1, while the typical interface dislocation speeds can be determined from relaxation experiments carried out in the framework of three-point bending tests on bone.Reference Iyo, Maki, Sasaki and Nakata55,Reference Salençon56 The initial maximum normal stress in these tests amounts to 32.6 MPa.Reference Eberhardsteiner, Hellmich and Scheiner13 The corresponding maximum shear stresses act in planes that are inclined by 45° with respect to the cross-sections of the beam, and they are a factor of two smaller than the maximum normal stressReference Salençon56 (i.e., the maximum shear stresses amount to 16.3 MPa, and they refer to the scale of cortical bone material, defined on volumes of typically hundreds of micrometers). Typical stress concentration factors from this cortical scale down to the mineral scale of tens of nanometers range from 1.5 to 2.8.Reference Fritsch, Hellmich and Dormieux14,Reference Gupta, Wagermaier, Zickler, Aroush, Funari, Roschger, Wagner and Fratzl37,Reference Almer and Stock57 This yields matrix-interface composite-related shear stresses ranging from 24 MPa to 45 MPa. At the time of sudden loading, microscopic interface shear tractions T are equal to the shear stresses imposed on the matrix-interface composite at the time instance of sudden loading.Reference Shahidi, Pichler and Hellmich17 The interface tractions T (i.e., the surface forces acting on the interfacial planes) are related to dislocation rates (ξ) via the following viscous interface law:
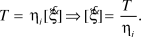 $$T = {\eta _i}[\dot \xi ]\,\, \Rightarrow \,\,[\dot \xi ] = {T \over {{\eta _i}}}.$$
Equation 3, specified for interface tractions T ranging from 24 MPa to 45 MPa and for an interface viscosity amounting to ηi = 1.83 × 10¹² GPa s m–1, suggests that the maximum dislocation rates range from 5.3 × 10⁻¹⁵ m s–1 to 8.3 × 10⁻¹⁵ m s–1, and this is 16 orders of magnitude smaller than the dislocation rate in the MD simulations. The effect of such a huge difference in corresponding shear rates felt by the viscous fluid inside the interfaces qualifies as the main candidate for explaining the viscosity changes: In fact, it is experimentally known for a number of different materialsReference Barnes58–Reference Wagner and Brady60 that increasing shear rates lead to decreased viscosities (or thinning) of viscous materials, a phenomenon also called thixotropy. Hence, the mismatch between MD and downscaled results for the viscosity of water trapped between hydroxyapatite crystals does not reveal any fundamental shortcomings of any of these methods, but rather elucidates the low speed-enhanced, very “glassy” state of the water interfaces under physiological loading conditions.
Comparison of MD results to experimental interface data
The viscosities obtained from MD simulations are also much lower than the experimental results of related material systems, such as collagen gel, which has a viscosity of the order of 105 Pa s.Reference Knapp, Barocas, Moon, Yoo, Petzold and Tranquillo61,Reference Barocas, Moon and Tranquillo62 The much higher shear rates in MD simulations lead to lower measured viscosity values. Considered as Newtonian fluid behavior, the shear rate ( $\dot \gamma$) dependency of the viscosity (μ) of the polymeric molecular structure is quite sensitive (i.e., it increases sharply as the shear rate decreases).Reference Dealy and Wang63,Reference Bylund and Pak64 Due to the computational capability of MD simulation, different shear rates varying from 107 to 109 s–1 were applied to the HAP-TC-HAP system with one layer of TC molecules. Fitting with the widely used power law relation,
 $$\mu = B{\dot \gamma ^{n - 1}},$$
with the parameters B = 42.49 Pa s and n = 0.7034; however, it is still not enough to capture the full picture of the viscosity-shear relationship, because shear rate is still much higher than that used in creep or stress relaxation experiments (i.e., 10–6 to 10–2 s–1,Reference Dealy and Wang63,Reference Franck65 too low to be generated using MD simulations). A recent study reported the viscous behavior of the biointerface systems at the infinite shear rate that, together with the material intrinsic property (i.e., zero-shear viscosity, μ0), can be used to estimate the properties beyond the observation range using extrapolation methods such as the cross model,Reference Dealy and Wang63,Reference Franck65
 $$\mu = {\mu _\infty } + {{{\mu _0} - {\mu _\infty }} \over {1 + {{(C\dot \gamma )}^m}}},$$
where μ∞ is the infinite shear viscosity obtained from the MD simulation, C is the cross time constant, and m is known as the cross rate constant. With the viscosities of collagen materials at the lower shear rate from previous studiesReference Knapp, Barocas, Moon, Yoo, Petzold and Tranquillo61,Reference Barocas, Moon and Tranquillo62,Reference Newman, Cloitre, Allain, Forgacs and Beysens66 and our infinity shear rate viscosity, the cross model parameters were obtained as C = 3845.7 s and m = 2.002.Reference Qu, Tomar, Bajaj, Zavattieri, Koslowski and Siegmund19,Reference Qu, Verma and Tomar49,Reference Qu and Tomar50 Figure 11Reference Qu, Tomar, Bajaj, Zavattieri, Koslowski and Siegmund19,Reference Qu, Verma and Tomar49,Reference Qu and Tomar50 displays the viscosity versus shear rate behavior as a plot of log(μ) versus log( $\dot \gamma$). The cross model extrapolation captures the significant shear thinning behavior of the material within the low shear rate region and gives the idea of upscaling the MD viscosity results with the decreasing of the shear rate. The overall shear-rate-dependent viscous behavior of the material is predicted with the combination of the cross model and MD simulations.
Plot showing viscosity as a function of shear rate obtained by the curve fitting of the literature dataReference Coussot59,Reference Bylund and Pak64 and the molecular dynamics simulation resultsReference Qu, Tomar, Bajaj, Zavattieri, Koslowski and Siegmund19,Reference Qu, Verma and Tomar49,Reference Qu and Tomar50 using the power law in Equation 3 and the cross model in Equation 4.
Summary
Hard biological materials such as nacre, bone, and marine crustacean exoskeletons exhibit remarkable mechanical performance despite the fact that they are made up of relatively weaker constituents. Several underlying mechanical principles for structural design of such materials have been suggested. For example, one principle is the alignment of mineral-protein interfaces along the loading directions. An MD study of TC-HAP biomaterials shows that a composite is best poised to handle the load if the protein molecules are in contact with mineral crystals with their longitudinal axis parallel to the mineral surface and along the loading direction of the composite. The second principle is the staggered arrangement of hard mineral crystals in a soft protein matrix, leading to a unique mechanism of load transfer where crystals bear the normal load and protein transfers the load via shear. The third principle is that the failure of such polymer-ceramic type composites is dominantly peak strain dependent instead of peak strength dependent. Also, the presence of moisture at the interface enhances the stability and strength of such biomaterials by supporting the cross-linking mechanism due to the polar nature of the water molecule.
One common feature that strongly stands out in most hard biological materials structures is the presence of interfaces at multiple hierarchical levels. It seems that Nature has designed these interfaces for optimum multifunctional performance during the course of evolution. Interfacial forces play a key role during deformation and failure of such biomaterials. Inorganic phases in the material systems carry the uniaxial tensile loading, while the organic phases mainly carry the shear load. Organic interfacial systems exhibit plastic shear deformation, and the yield and failure shear stress define the lower and higher bounds of the interfacial strength. The shear viscosity of interfacial systems shows a highly shear rate dependent behavior; however, the full picture of this behavior cannot be captured using MD simulations without assistance from experimental techniques and extrapolation. Interfacial interaction between the soft phase and hard phase is responsible for the redistribution of stresses and directly affects the toughness and strength of the natural materials. Further, the design of the organic–inorganic interface along with the critical length of the mineral constituent also potentially contributes to strengthening the biomaterials against failure and in affecting their overall mechanical performance.
Acknowledgments
T.Q. acknowledges support from the US Department of Energy Grant DE-SC0008619, D.V. acknowledges support from National Science Foundation Grant CMMI-1131112, and M.S. and C.H. acknowledge financial support from the European Research Council under grant #257023.



