1. Introduction
Soft boundaries in proximate contact with a fluid are of fundamental importance in a wide variety of disciplines, ranging over tribology, material science, biophysics and beyond (Higginson Reference Higginson1962; Dowson Reference Dowson1995; Zhang Reference Zhang2005; Scaraggi & Persson Reference Scaraggi and Persson2014; Rallabandi et al. Reference Rallabandi, Saintyves, Jules, Salez, Schönecker, Mahadevan and Stone2017; Karan, Chakraborty & Chakraborty Reference Karan, Chakraborty and Chakraborty2020a). The widespread requirement of appropriately modelling the mechanical interactions therein has led to the emergence of the discipline of soft lubrication (Skotheim & Mahadevan Reference Skotheim and Mahadevan2004, Reference Skotheim and Mahadevan2005). The applications are manifold, including but not limited to: cellular and bacterial propulsion and targeted drug delivery (Secomb et al. Reference Secomb, Skalak, Özkaya and Gross1986; Trouilloud et al. Reference Trouilloud, Yu, Hosoi and Lauga2008; Zhao et al. Reference Zhao, Ukidve, Krishnan and Mitragotri2019), colloidal motion in confined flow domains (Brenner Reference Brenner1961; Tabatabaei, van de Ven & Rey Reference Tabatabaei, van de Ven and Rey2006; Urzay, Smith & Glover Reference Urzay, Smith and Glover2007), bio-mimetic functionalization with soft coatings (Peach et al. Reference Peach2012; Gao et al. Reference Gao, Liu, Peng, Zhu, Zhao, Li and Yuan2019) and surface force characterization apparatus (Shubin & Kékicheff Reference Shubin and Kékicheff1993; Butt, Cappella & Kappl Reference Butt, Cappella and Kappl2005; Jones & Hart Reference Jones and Hart2005; Chadwick & Liao Reference Chadwick and Liao2008; Wang, Dhong & Frechette Reference Wang, Dhong and Frechette2015; Ostromohov et al. Reference Ostromohov, Rofman, Bercovici and Kaigala2020; Zhang et al. Reference Zhang, Bertin, Arshad, Raphael, Salez and Maali2020).
Innovations in surface probing technologies have enabled the monitoring of several activated biological and engineering surface processes in situ and in real time, such as the conformational change of lysozyme during hydrolysis (Radmacher et al. Reference Radmacher, Cleveland, Fritz, Hansma and Hansma1994), adaptive alterations related to the functionality of membrane proteins (Müller et al. Reference Müller, Fotiadis, Scheuring, Müller and Engel1999), softness characterization of bubbles, cells and other materials (Steinberger et al. Reference Steinberger, Cottin-Bizonne, Kleimann and Charlaix2008; Leroy et al. Reference Leroy, Steinberger, Cottin-Bizonne, Restagno, Léger and Charlaix2012; Guan et al. Reference Guan, Barraud, Charlaix and Tong2017) and more. These problems are hallmarked by exclusive fluid–structure interactions under the broad ambit of elastohydrodynamics (Cawthorn & Balmforth Reference Cawthorn and Balmforth2010; Chakraborty & Chakraborty Reference Chakraborty and Chakraborty2011; Mukherjee, Chakraborty & Chakraborty Reference Mukherjee, Chakraborty and Chakraborty2013; Pandey et al. Reference Pandey, Karpitschka, Venner and Snoeijer2016; Temizer & Stupkiewicz Reference Temizer and Stupkiewicz2016; Naik, Chakraborty & Chakraborty Reference Naik, Chakraborty and Chakraborty2017; Rubin et al. Reference Rubin, Tulchinsky, Gat and Bercovici2017; Christov et al. Reference Christov, Cognet, Shidhore and Stone2018; Karan, Chakraborty & Chakraborty Reference Karan, Chakraborty and Chakraborty2018b; Anand, David & Christov Reference Anand, David and Christov2019; Wang & Christov Reference Wang and Christov2019; Boyko et al. Reference Boyko, Eshel, Gat and Bercovici2020; Karan et al. Reference Karan, Chakraborty, Chakraborty, Wereley and Christov2020b,Reference Karan, Das, Mukherjee, Chakraborty and Chakrabortyc; Sunil et al. Reference Sunil, Agarwal, Karan, Chakraborty and Chakraborty2020). Inevitably, the action of a dynamically actuated surface probe apparatus over a deformable surface mediated by a thin viscous fluid layer, typical to a frequently encountered class of applications under the broad ambit of scanning probe microscopy (SPM) (Steinberger et al. Reference Steinberger, Cottin-Bizonne, Kleimann and Charlaix2008; Leroy et al. Reference Leroy, Steinberger, Cottin-Bizonne, Restagno, Léger and Charlaix2012; Guan et al. Reference Guan, Barraud, Charlaix and Tong2017), plays a critical role in deciphering the underlying physics in a wide variety of problems of these kinds.
Seminal advancements in elastohydrodynamics (EHD) have built up crucial capabilities of predicting the force response in a well-established contactless softness characterization methodology (Steinberger et al. Reference Steinberger, Cottin-Bizonne, Kleimann and Charlaix2008; Leroy & Charlaix Reference Leroy and Charlaix2011) and collision and rebound dynamics for approach and recession loading of a SPM probe on incompressible soft coatings (Wang, Tan & Frechette Reference Wang, Tan and Frechette2017; Tan, Wang & Frechette Reference Tan, Wang and Frechette2019). However, these studies lack sufficient generalization to accommodate large amplitudes of dynamic loading and exclusive interfacial interactions in the event that the nearby solid substrates are instantaneously located in extreme close proximity.
A generic consideration of two solid surfaces in nearby vicinity needs to account for at least two essential types of non-hydrodynamic interaction forces, namely, the electrostatic and the van der Waals interactions. While their descriptions may get significantly involved in practice, some of the essential physics of interest may be captured by the classical DLVO theory (Derjaguin & Landau Reference Derjaguin and Landau1941; Verwey Reference Verwey1947) that accounts for the two main interactions: the attractive Lifshitz–van der Waals and the repulsive electrostatic double layer interactions. The theory considers the electrostatic potential at any point in the liquid to be time-averaged potentials at the same point resulting from the movements of the ions, alternatively known as the mean field approximation. Typically, the electrostatic potential is induced due to the electrical double layer phenomenon, characterized by a charged substrate being screened by a fluid layer of opposite charge that further includes a sublayer of fixed charge and another sub-layer of mobile charges. The van der Waals forces fundamentally originate from time-dependent dipoles in atoms or molecules, and are manifest in the form of various types of dipole–dipole interactions. While DLVO forces are not traditionally accounted for in the classical elastohydrodynamic analysis, their effects are by no means trivial when assessed in purview of the dynamic loading on account of surface probe movements. This may be attributed to the fact that a trivial algebraic linear superposition of the combined hydrodynamic and DLVO forces may not be adequate to explain the underlying physics of interaction and dynamic response, because both the substrate deformation as well as the instantaneous distance of separation between the proximate surfaces remain unknown a priori at every time instant due to a two-way dynamic coupling between the deformation and the flow.
Here, we bring out a theoretical framework for addressing dynamically actuated axisymmetric motion of a spherical probe over a deformable soft substrate with a viscous fluid layer between the two, explicitly accounting for DLVO force-modulated elastohydrodynamic interactions. While many soft surfaces in nature and biology exhibit nonlinear elasticities, we appeal to a simplified physical paradigm of a linear constitutive model of elastic deformation of a soft substrate coating (stratified material) on a rigid platform due to lubrication forces, in an effort to address the essential physics of interest as per the focal theme of this work. An additional exclusive feature of the present model is the consideration of a large amplitude of movement of the probing sphere, by introducing a time-dependent scale for the vertical coordinate in the fluid domain. Operationally, we perform a time-dependent coordinate transformation to this end. Further, since the fluid film gap and its time rate of change strongly affect the hydrodynamic pressure and the DLVO forces, each of these corresponds to what are essentially modes of two-way coupling between pressure on the substrate and its deformation. To enable capturing this effect, we employ a numerical scheme developed using a discrete Hankel-transformation theory (Baddour & Chouinard Reference Baddour and Chouinard2015). This allows us to capture the two modes of the two-way coupling –substrate deformation comparable to sphere–substrate gap similar to Wang et al. (Reference Wang, Tan and Frechette2017), and, coupling of hydrodynamic pressure with time rate change of substrate deformation similar to Leroy & Charlaix (Reference Leroy and Charlaix2011), amidst the electrostatic and van der Waals interactions over interfacial scales. Additionally, to assess the impact of the substrate deformation on the system force interactions as compared with the situation where the substrate is asymptotically rigid, we derive a theoretical closed-form expression of the total force in the latter scenario, based on linear superposition of the hydrodynamic and DLVO forces, and show that the same may turn out to be grossly inappropriate in unveiling an accurate quantitative accounting of the dynamical interactions for deformable substrates.
The highlights of our findings include that DLVO forces tend to play dominant roles in dictating the dynamic response of the systems below a threshold limit of frequency of the probe oscillation, when the amplitude of oscillation is large. Under such conditions, we show that the DLVO forces can lead to significant magnification of up to O( $10^{2}$) and O(
 $10$) in the maximal sphere–substrate force and substrate deformation, respectively. Pertaining to the high-frequency oscillation assisted elasticity characterization methodology by Leroy & Charlaix (Reference Leroy and Charlaix2011), we find that high oscillation amplitude degenerates the requisite sinusoidal force response to some extent, but it still remains conducive to the recovery of the storage and loss moduli (variables required for the elasticity characterization), and their recovered values remain independent of the amplitude of oscillation. We also identify the optimal oscillation frequency for recovering appreciable sensitivity of the storage and loss moduli to the sphere–substrate separation for the particular geometric and loading conditions considered herein. Studying variants of cases assessed by Wang et al. (Reference Wang, Tan and Frechette2017), we reveal that higher substrate material compressibility makes the substrate effectively softer, i.e. it allows more deformation for identical loading conditions (this softening gets smaller as substrate thickness increases). Lastly, by contrasting the computed force with the force based on the aforementioned algebraic superposition, we find that the latter approach misses out on some key features that the former captures. In particular, for the high-frequency oscillations, the latter does not capture the phase lag in force, and the sinusoidal variations in the force when the oscillation amplitude is high. On the other hand, for low-frequency oscillations in the presence of DLVO forces, the magnitude of the force estimated by such an intuitive superposition principle is shown to be quantitatively inaccurate by at least a factor of 2. These results appear to be critical in the limit when the object under motion is in close proximity to the solid boundary, typically encountered in many practical situations of contemporary relevance, in view of the ever-increasing impact of biologically inspired engineering having several applications including targeted drug delivery, cellular transport and adhesion, colloidal sedimentation, bio-mimetic structures, in addition to the specific technological perspectives of surface probe based measurements.
2. Mathematical framework
2.1. Model set-up
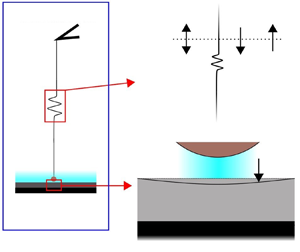
The physical set-up for this study is presented in figure 1. The probe is attached to an actuator by a spring with a spring constant  $K_{{S}}$. The oscillatory/approach/recession loading is imposed on the actuator, which is transmitted to the sphere. Various limiting cases of the situation, including those corresponding to finite spring constant (Wang et al. Reference Wang, Tan and Frechette2017; Tan et al. Reference Tan, Wang and Frechette2019) and infinite spring constant (Leroy & Charlaix Reference Leroy and Charlaix2011), have been addressed earlier in different physical scenarios, along with certain simplifying assumptions.
Representation of the physical set-up; the table above presents the expressions for  $H_{ I}^{*}$ and
 ${\partial H_{ I}^{*}}/{\partial t^{*}}$ for the three loading situations; the sphere profile referenced to the
 $r^{*}$-axis,
 $H^{*}$, is related to
 $H_{ I}^{*}$ as per (2.1) and the two are identical when the spring is rigid.

Time is represented by  $t^{*}$. For the fluid domain,
 $r^{*}-z^{*}$ is used as the coordinate system, and, for the substrate domain,
 $r^{*}-\bar {z}^{*}$ is used as the coordinate system. The line passing through
 $O$ and
 $P$ is henceforth referred to as the ‘centreline’. The radius of the sphere is
 $R$. Undeformed substrate thickness is
 $L$. The ratio of
 $L$ to
 $R$ is denoted by
 $\beta$. The mean separation over time, of the lowest point of sphere from the origin, is
 $D$. The ratio of
 $D$ to
 $R$ is denoted by
 $\epsilon$. For oscillatory loading,
 $\omega$ and
 $h_0$ respectively are the oscillation frequency and amplitude imposed on the actuator. For approach and recession loading,
 $\omega h_0$ is the constant speed imposed on the actuator. The ratio of
 $h_0$ to
 $D$ is denoted by
 $\alpha$. During approach/recession loading, the actuator moves a distance of
 $2h_0$, leading to a common value of
 $h_0$ for the amplitude for all three modes of loading. Compression of the spring is denoted by
 $l_{{S}}^{*}$. Fluid–substrate interface deflection, henceforth referred to as ‘deflection’, is represented by
 $l^{*}$. The sphere's profile, i.e. the fluid–sphere interface referenced to the
 $r^{*}$-axis, is represented by
 $H^{*}$. The fluid velocity field is denoted by
 $\boldsymbol {v}^{*}$, substrate displacement field is denoted by
 $\boldsymbol {u}^{*}$,
 $p_{{hd}}^{*}$ is the hydrodynamic pressure,
 $p_{{EDL}}^{*}$ is the electrical double layer (EDL) disjoining pressure,
 $p_{{vdW}}^{*}$ is the van der Waals pressure,
 $p^{*}$ is the net effective pressure and
 $F^{*}$ is the force between sphere and substrate.
The intervening fluid is an incompressible homogeneous isotropic Newtonian fluid with density and viscosity as  $\rho$ and
 $\mu$, respectively. The substrate is a homogeneous isotropic linear-elastic solid, with Lamé's first parameter and the shear modulus as
 $\lambda$ and
 $G$, respectively. Alternatively, the substrate's compliance is quantified by its Young's modulus and Poisson's ratio,
 $E_{{Y}}$ and
 $\nu$, respectively.
In the lubrication zone, the expression for  $H^{*}$ is,
 \begin{equation} H^{*} = H_{{I}}^{*}+l_{{S}}^{*}, \end{equation}
where  $H_{{I}}^{*}$ is given as (Leroy & Charlaix Reference Leroy and Charlaix2011),
 \begin{equation} H_{{I}}^{*} = D+\frac{r^{*2}}{2R}+ \begin{cases} h_0\cos(\omega t^{*}), & \text{oscillatory}, \\ h_0(1-\omega t^{*}), & \text{approach}, \\ -h_0(1-\omega t^{*}), & \text{recession}. \end{cases} \end{equation}
Here,  $H_{{I}}^{*}$ is a hypothetical imposed profile for the sphere referenced to the
 $r^{*}$-axis, that converges to the actual profile for the sphere,
 $H^{*}$, when the attached spring is rigid.
For the situation where  $K_{{S}}$ is infinite (i.e. loading is effectively imposed directly on the sphere),
 $l_{ S}^{*} = 0$. On the other hand, for finite
 $K_{{S}}$, spring compression, which is simply the result of force between sphere and substrate, is given as,
 \begin{equation} l_{{S}}^{*} = \frac{F^{*}}{K_{{S}}} = \frac{2{\rm \pi}}{K_{{S}}}\int_{0}^{\infty}p^{*}r^{*}\,\textrm{d}r^{*}. \end{equation}
2.2. Governing equations and boundary conditions
The flow dynamics of the intervening fluid are governed by the continuity equation,
 \begin{equation} \frac{1}{r^{*}} \frac{\partial (r^{*}v_{r}^{*})}{\partial r^{*}} + \frac{\partial v_{z}^{*}}{\partial z^{*}} = 0, \end{equation}
and the momentum-conservation equation (or the Navier–Stokes equation),
 \begin{gather} \frac{\partial v_{r}^{*}}{\partial t^{*}}+v_{r}^{*}\frac{\partial v_{r}^{*}}{\partial r^{*}}+v_{z}^{*}\frac{\partial v_{r}^{*}}{\partial z^{*}} ={-}\frac{\partial p_{{hd}}^{*}}{\partial r^{*}} + \frac{\partial^{2} v_{r}^{*}}{\partial z^{*2}}+\frac{1}{r}\frac{\partial}{\partial r^{*}}\left(r^{*} \frac{\partial v_{r}^{*}}{\partial r^{*}}\right)-\frac{v_{r}^{*}}{r^{*2}}, \end{gather}
 \begin{gather} \frac{\partial v_{z}^{*}}{\partial t^{*}}+v_{r}^{*}\frac{\partial v_{z}^{*}}{\partial r^{*}}+v_{z}^{*}\frac{\partial v_{z}^{*}}{\partial z^{*}} ={-}\frac{\partial p_{{hd}}^{*}}{\partial z^{*}} + \frac{\partial^{2} v_{r}^{*}}{\partial z^{*2}} + \frac{1}{r^{*}} \frac{\partial}{\partial r^{*}} \left(r^{*} \frac{\partial v_{z}^{*}}{\partial r^{*}}\right). \end{gather}
These governing equations are closed by the no-slip and no-penetration conditions at the fluid–sphere interface, i.e. at  $z^{*}=H^{*} = H_{ I}^{*}+l_{{S}}^{*}$,
 \begin{gather} v_r^{*} = 0, \end{gather}
 \begin{gather} v_z^{*} = V_{{I}}^{*}+V_{{S}}^{*}, \end{gather}
where,
 \begin{gather} V_{{I}}^{*} = \left\{ \begin{array}{@{}ll} \displaystyle -\omega h_0\sin(\omega t^{*}), & \text{oscillatory}, \\ \displaystyle -\omega h_0, & \text{approach}, \\ \displaystyle \omega h_0 , & \text{recession}, \end{array} \right. \end{gather}
 \begin{gather} V_{{S}}^{*} = \frac{\partial l_{{S}}^{*}}{\partial t^{*}}, \end{gather}
the no-slip and no-penetration conditions at the fluid–substrate interface, i.e. at  $z^{*} = -l^{*}$,
 \begin{gather} v_r^{*} = 0, \end{gather}
 \begin{gather} v_z^{*} ={-}\frac{\partial l^{*}}{\partial t^{*}} ={-}V_{{C}}^{*}, \end{gather}
zero velocity and zero hydrodynamic pressure conditions at the far end of the lubrication zone, i.e. as  $r^{*} \gg R^{{1}/{2}}(H_{ I}-{r^{*2}}/{2R})^{{1}/{2}}$,
 \begin{equation} v_r^{*}\rightarrow 0,\quad v_z^{*} \rightarrow 0,\quad p_{{hd}}^{*} \rightarrow 0, \end{equation}
and zero radial velocity and symmetric axial velocity and hydrodynamic pressure conditions at the centreline, i.e. at  $r = 0$,
 \begin{equation} v_r^{*} = \frac{\partial v_z^{*}}{\partial r^{*}} = \frac{\partial p_{{hd}}^{*}}{\partial r^{*}} = 0. \end{equation}
The substrate displacement is governed by the mechanical equilibrium equation,
 \begin{equation} \boldsymbol{\nabla}^{*}\boldsymbol{\cdot}\boldsymbol{\sigma^{*}} = 0, \end{equation}
where  $\boldsymbol {\sigma ^{*}}$ is the substrate domain Cauchy–Green stress tensor. For a linear elastic solid, it is given in terms of the strain tensor,
 $\boldsymbol {\nabla }^{*} \boldsymbol {u}^{*}$ as,
 \begin{equation} \boldsymbol{\sigma^{*}} = \lambda\text{tr}(\nabla^{*} \boldsymbol{u}^{*})\boldsymbol{I}+G\left(\nabla^{*} \boldsymbol{u}^{*}+(\nabla^{*} \boldsymbol{u}^{*})^{\text{T}}\right), \end{equation}
where the superscript ‘T’ implies transposition. Upon expanding (2.11) using (2.12), the two components of the mechanical equilibrium equation are obtained as,
 \begin{gather} \frac{\partial^{2} u_{r}^{*}}{\partial \bar{z}^{*2}} + \left(1+\frac{\lambda}{G}\right) \frac{\partial^{2} u_{\bar{z}}^{*}}{\partial r^{*} \partial \bar{z}^{*}} + \left(2+\frac{\lambda}{G}\right) \left(\frac{\partial^{2} u_{r}^{*}}{\partial r^{*2}} + \frac{1}{r^{*}} \frac{\partial u_{r}^{*}}{\partial r^{*}} - \frac{u_{r}^{*}}{r^{*2}} \right) = 0, \end{gather}
 \begin{gather} \left(2+\frac{\lambda}{G}\right)\frac{\partial^{2} u_{\bar{z}}^{*}}{\partial \bar{z}^{*2}} + \left(1+\frac{\lambda}{G}\right) \left(\frac{\partial^{2} u_{r}^{*}}{\partial r^{*} \partial \bar{z}^{*}} + \frac{1}{r^{*}} \frac{\partial u_{r}^{*}}{\partial \bar{z}^{*}}\right) + \left(\frac{\partial^{2} u_{\bar{z}}^{*}}{\partial r^{*2}} + \frac{1}{r^{*}} \frac{\partial u_{\bar{z}}^{*}}{\partial r^{*}} \right) = 0. \end{gather}
These governing equations are closed by the zero-displacement condition at the far end of the lubrication zone, i.e. for  $r^{*} \gg R^{{1}/{2}}(H_{ I}-{r^{*2}}/{2R})^{{1}/{2}}$,
 \begin{equation} u_r^{*}\rightarrow 0,\quad u_{\bar{z}}^{*} \rightarrow 0, \end{equation}
zero-displacement condition at the substrate–platform interface, i.e. at  $\bar {z}^{*} = L$,
 \begin{equation} u_r^{*} = u_{\bar{z}}^{*} = 0, \end{equation}
zero radial displacement and symmetric axial displacement at the centreline, i.e. at  $r^{*}=0$,
 \begin{equation} u_r^{*} = \frac{\partial u_{\bar{z}}^{*}}{\partial r^{*}} = 0, \end{equation}
and the traction balance condition at the fluid–substrate interface, i.e. at  $\bar {z}^{*} = 0$. The traction balance condition is expressed as,
 \begin{equation} \boldsymbol{\sigma^{*}}\cdot\hat{n} = \boldsymbol{\breve{\sigma}^{*}}\cdot\hat{n}, \end{equation}
where  $\boldsymbol {\breve {\sigma }^{*}}$ is the fluid domain (Eulerian) stress tensor and is given in terms of the fluid domain strain rate tensor
 $\boldsymbol {\nabla }^{*} \boldsymbol {v}^{*}$ as,
 \begin{equation} \boldsymbol{\breve{\sigma}_{F}^{*}} ={-}p^{*}\boldsymbol{I}+\mu\left(\boldsymbol{\nabla}^{*} \boldsymbol{v}^{*}+(\boldsymbol{\nabla}^{*} \boldsymbol{v}^{*})^{\text{T}}\right), \end{equation}
and  $\hat {n}$ is the normal vector to the fluid–substrate interface in the deformed configuration, which approximates as
 $\hat {z}$ under the small-strain regime for the substrate domain deformation. Hence, the expanded form of traction balance condition, (2.17), is,
 \begin{gather} \frac{\partial u_{r}^{*}}{\partial \bar{z}^{*}}+\frac{\partial u_{\bar{z}}^{*}}{\partial r^{*}} = \frac{\mu}{G}\left(\frac{\partial v_r^{*}}{\partial z^{*}}+\frac{\partial v_z^{*}}{\partial r^{*}}\right), \end{gather}
 \begin{gather} \frac{\partial u_{\bar{z}}^{*}}{\partial \bar{z}^{*}} + \left(\frac{\lambda}{\lambda+2G}\right)\left(\frac{\partial u_{r}^{*}}{\partial r^{*}}+\frac{u_{r}^{*}}{r^{*}}\right) ={-}\left(\frac{1}{\lambda+2G}\right)\left(p^{*}-\mu\frac{\partial v_z^{*}}{\partial z^{*}}\right). \end{gather}
2.3. Pressure components and net effective pressure
It is an established consensus in the colloidal science discipline that any two proximal particles in a colloidal suspension experience short-range interaction forces that arise out of electrostatic interactions between the different subcomponents of the particles and the solvent. When any set-up, involving these short-range interactions between two objects, is subjected to flow, the time scale for the interactions are typically much smaller than the smallest characteristic time scale for the typical flow condition. Hence, the classical DLVO theory (Derjaguin & Landau Reference Derjaguin and Landau1941; Verwey Reference Verwey1947) of the equilibrium in colloidal systems, which is often employed to explain colloidal stability, is applicable to quantify the mentioned short-range interactions (even in the presence of flow). An elaborate mathematical description of DLVO interactions is presented in Israelachvili (Reference Israelachvili2011), and we present a brief description on them as pertinent to our study. DLVO interactions are the combination of two interactions – EDL interactions and van der Waals (vdW) interactions. These interactions are often modelled as interaction energies between the objects. When the objects are a sphere and a plane, as is the case here, these interactions are quantified as interaction potentials between the two objects ( $W_{ EDL}^{*}$ and
 $W_{ vdW}^{*}$),
 \begin{gather} W_{{EDL}}^{*} = 64{\rm \pi} \mathscr{R}\varepsilon\varepsilon_{0}\varPsi^{2}\left(\frac{k_{ B}T}{q}\right)^{2}\exp\left(-\kappa \mathscr{D}\right), \end{gather}
 \begin{gather} W_{{vdW}}^{*} ={-}\frac{A_{{sfw}}\mathscr{R}}{6 \mathscr{D}}, \end{gather}
where  $\displaystyle \varPsi = \tanh ({q\psi _0}/{4 k_{{B}}T})$,
 $q$ is elementary charge,
 $\psi _0$ is the surface potential (which is taken equal for the fluid–sphere interface and the fluid–substrate interface),
 $k_{{B}}$ is the Boltzmann constant,
 $T$ is temperature,
 $\kappa$ is the inverse of the Debye length, given as
 $\kappa = \sqrt {{2c_{0}q^{2}}/{\varepsilon \varepsilon _{0} k_{{B}}T}}$,
 $\varepsilon$ and
 $\varepsilon _0$ are, respectively, the relative permittivity of the electrolytic solution and permittivity of free space,
 $c_0$ is the electroneutral concentration of the
 $1:1$ electrolytic solution we are considering as the intervening fluid (taken as 1 mM throughout our computations) and
 $A_{{sfw}}$ is Hamaker's constant, which is typically of the order of
 $10^{-21}$ Joules (Israelachvili Reference Israelachvili2011). In (2.20),
 $\mathscr {R}$ is the radius of the sphere and
 $\mathscr {D}$ is the separation between the sphere and plane (when the plane is assumed rigid). The force between the sphere and plane, corresponding to the EDL and vdW interactions respectively, is simply,
 \begin{equation} F_{{EDL}}^{*} ={-}\frac{\delta W_{{EDL}}}{\delta \mathscr{D}},\quad F_{{vdW}}^{*} ={-}\frac{\delta W_{{EDL}}}{\delta \mathscr{D}}. \end{equation}
Similar to (2.20) and (2.21a,b), there are interaction potentials and corresponding forces for a plane–plane pair as well, except that they are in terms of per unit area (i.e. the force is indeed a pressure). It can be shown that, in the limit of  $\mathscr {D} \ll \mathscr {R}$, we can consider non-hydrodynamic pressure terms between the sphere and plane, which follow the expressions corresponding to the plane–plane pair, and integration of these terms yields (2.21a,b). Since the sphere–substrate separation is always smaller than the radius of the sphere for our set-up, we exploit this simplification and incorporate DLVO forces in our framework as contributions of these non-hydrodynamic pressure terms to the net effective pressure (Serayssol & Davis Reference Serayssol and Davis1986; Urzay Reference Urzay2010).
We henceforth term these non-hydrodynamic pressure components as the EDL disjoining pressure and vdW pressure, and their expressions are,
 \begin{gather} p_{{EDL}}^{*} = 64{\varPsi}^{2}c_0k_{ B}T\exp\left(-\kappa (H_{{I}}^{*}+l^{*}+l_{{S}}^{*})\right), \end{gather}
 \begin{gather} p_{{vdW}}^{*} ={-}\frac{A_{{sfw}}}{6{\rm \pi}(H_{{I}}^{*}+l^{*}+l_{{S}}^{*})^{3}}. \end{gather}
Upon incorporating the DLVO pressure components (2.26), the net effective pressure  $p^{*}$ appearing in the traction balance condition (2.19) is,
 \begin{equation} p^{*} = p_{{hd}}^{*}+p_{{EDL}}^{*}+p_{{vdW}}^{*}. \end{equation}
2.4. Scaling and transformation
A key aspect of the current study is that we enable a large amplitude for the motion of the sphere in comparison with the average separation of the sphere from the origin. Enabling this large amplitude implies that the  $z$-scale (which classically scales with the separation of sphere from origin) varies drastically with time over the sphere's range of motion. As a result, instead of non-dimensionalizing the governing equations and boundary conditions straight away, we perform a transformation of the system of governing equations and boundary conditions, which is essentially the combination of a coordinate transformation (on the independent variables –
 $r^{*}$,
 $z^{*}$,
 $\bar {z}^{*}$ and
 $t^{*}$) and non-dimensionalization (on the dependent variables –
 $\boldsymbol {v}^{*}$,
 $\boldsymbol {u}^{*}$,
 $p_{{hd}}^{*}$,
 $p_{{EDL}}^{*}$,
 $p_{{vdW}}^{*}$ and
 $p^{*}$ and
 $F^{*}$). The transformed variables are represented by the same notation as their original counterparts but with the superscript
 $^{*}$ dropped. This transformation is such that the obtained transformed variables are non-dimensional based on the characteristic scales of the variables. In practice, this approach, as compared with straightforward non-dimensionalization, introduces additional terms in the governing equations and boundary conditions. The sequential steps for the transformation procedure and the transformed governing equations and boundary conditions are presented in sections S1 and S2 of the supplementary material available at https://doi.org/10.1017/jfm.2021.595, respectively. The system dimension ratios and relation between original and transformed system variables are presented in table 1.
Notations of length scale ratios and transformed expressions of system variables.

The expressions for  $k$,
 $H_{{I}}$ and
 $H$, based on the transformation procedure, are,
 \begin{gather} k = \left\{ \begin{array}{@{}ll} 1 & \alpha \ll 1 \\ 1+\alpha\cos(t) & \alpha \sim 1 \text{ oscillatory} \\ 1+\alpha (1-t) & \alpha \sim 1 \text{ approach} \\ 1-\alpha (1-t) & \alpha \sim 1 \text{ recession} \end{array} \right. \end{gather}
 \begin{gather} H_{{I}} = 1+\frac{r^{2}}{2} + \left\{ \begin{array}{@{}ll} \displaystyle \alpha\cos(t) & \alpha \ll 1 \text{ oscillatory} \\ \displaystyle \alpha (1-t) & \alpha \ll 1 \text{ approach} \\ \displaystyle -\alpha (1-t) & \alpha \ll 1 \text{ recession}\\ \displaystyle 0 & \alpha \sim 1 \\ \end{array} \right. \end{gather}
 \begin{gather} H = H_{{I}}+\varGamma_{{S}}l_{{S}}, \end{gather}
where  $\varGamma _{{S}} = {\theta _{{S}}}/{k\epsilon }$. Similarly, the expression for
 $\varGamma$, which will appear at multiple places in the analysis ahead, is
 $\displaystyle \varGamma = {\theta }/{k\epsilon }$.
To get the expression for  $\theta _{{S}}$, we use (2.3). This gives us
 $\theta _{{S}} = {k \epsilon \varPi R}/{K_{{S}}}$, and (2.3) transforms to,
 \begin{equation} l_{{S}} = 2{\rm \pi}\int_{0}^{\infty}pr\,\textrm{d}r. \end{equation}
On the other hand, the expressions for the EDL disjoining pressure and vdW pressure (2.22) transform into,
 \begin{gather} p_{{EDL}} = 32{\varPsi}^{2}\exp\left({-}k\epsilon \kappa R(H_{{I}}+\varGamma l+\varGamma_{{S}} l_{{S}})\right), \end{gather}
 \begin{gather} p_{{vdW}} ={-}\frac{1}{(H_{{I}}+\varGamma l+\varGamma_{{S}} l_{{S}})^{3}}. \end{gather}
The net effective pressure appearing in the traction balance condition (2.23) transforms into,
 \begin{equation} p = \frac{\mu\omega\alpha}{k^{2}\epsilon\varPi}p_{{hd}}+\frac{2c_0k_{{B}}T}{\varPi}p_{{EDL}}+\frac{A_{{sfw}}}{6k^{3}{\rm \pi}\epsilon^{3}R^{3}\varPi}p_{{vdW}}. \end{equation}
Based on (2.27), we now obtain the expression for  $\varPi$. Since the net effective pressure is the sum of the hydrodynamic and non-hydrodynamic pressure components, its scale depends on the dominant pressure component(s). For certain imposed dynamic parameters, the relative contributions of the different components of the pressure vary over the sphere's range of motion. Therefore, we prescribe
 $\varPi$ such that the maximum magnitude of
 $p^{*}$ is expected to assume during the complete range of motion of the sphere is unity scaled. Accordingly,
 \begin{equation} \varPi = \frac{\mu\omega\alpha}{\epsilon(1-\alpha)^{2}}+2c_0 k_{B} T + \frac{1}{(1-\alpha)^{3}}\frac{A_{{sfw}}}{6{\rm \pi}\epsilon^{3}R^{3}}. \end{equation}
Next, we obtain the expression for  $\delta$, and re-iterate the transformed mechanical equilibrium equation ((S13) in the supplementary material),
 \begin{gather} \frac{\partial^{2} u_{r}}{\partial \bar{z}^{2}} + \frac{\delta}{k^{{1}/{2}}\epsilon^{{1}/{2}}}\left(1+\frac{\lambda}{G}\right) \frac{\partial^{2} u_{\bar{z}}}{\partial r \partial \bar{z}} + \frac{\delta^{2}}{k\epsilon} \left(2+\frac{\lambda}{G}\right) \left(\frac{\partial^{2} u_{r}}{\partial r^{2}} + \frac{1}{r} \frac{\partial u_{r}}{\partial r} - \frac{u_{r}}{r^{2}} \right) = 0, \end{gather}
 \begin{gather} \left(2+\frac{\lambda}{G}\right)\frac{\partial^{2} u_{\bar{z}}}{\partial \bar{z}^{2}} + \frac{\delta}{k^{{1}/{2}}\epsilon^{{1}/{2}}}\left(1+\frac{\lambda}{G}\right) \left(\frac{\partial^{2} u_{r}}{\partial r \partial \bar{z}} + \frac{1}{r} \frac{\partial u_{r}}{\partial \bar{z}}\right) + \frac{\delta^{2}}{k\epsilon} \left(\frac{\partial^{2} u_{\bar{z}}}{\partial r^{2}} + \frac{1}{r} \frac{\partial u_{\bar{z}}}{\partial r} \right) = 0. \end{gather}
For a substrate that is sufficiently thin, the deformation extends from the fluid–substrate interface to the substrate–platform interface, and therefore, the substrate thickness  $L$ turns out to be the scale for
 $\bar {z}^{*}$, giving us
 $\delta = \beta$. On the other hand, for a substrate that is thick enough to behave like a semi-infinite space, the scale for
 $\bar {z}^{*}$ is clearly independent of
 $L$. Considering (2.29), we observe that, if we consider
 $\delta \gg k^{{1}/{2}}\epsilon ^{{1}/{2}}$, we recover an unrealistic estimation for
 $u_{\bar {z}}$ (we obtain a solution independent of
 $r$, which is not possible with radially varying load on the fluid–substrate interface). Hence, we deduce that, for a sufficiently thick substrate,
 $\delta = k^{{1}/{2}}\epsilon ^{{1}/{2}}$. Collating these scaling arguments, we prescribe
 $\delta = \min (\beta ,k^{{1}/{2}}\epsilon ^{{1}/{2}})$.
Lastly, we obtain the expression for  $\theta$, and re-iterate the
 $\bar {z}$-component of the traction balance condition at fluid–substrate interface ((S17b) in the supplementary material),
 \begin{equation} \frac{\partial u_{\bar{z}}}{\partial \bar{z}} + \frac{\delta}{k^{{1}/{2}}\epsilon^{{1}/{2}}}\left(\frac{\lambda}{\lambda+2G}\right)\left(\frac{\partial u_{r}}{\partial r}+\frac{u_{r}}{r}\right) ={-}\frac{\delta\varPi}{\theta(\lambda+2G)}\cdot\left[p-\left\{\left(\frac{1}{k^{2}}\frac{\mu\omega\alpha}{\epsilon\varPi}\right)\left(2k\epsilon\frac{\partial v_z}{\partial z}\right)\right\}\right]. \end{equation}
Since the substrate deforms in response to the pressure at the fluid–substrate interface, and given that the deformed shape of the fluid–substrate interface is not far deviated from the horizontal, the scale for  $\theta$ is obtained by equating the scales of the leading-order terms of the left-hand side and right-hand side of the
 $\bar {z}$-component of the traction balance condition, (2.30). Thus, we get
 $\theta = {\delta \varPi }/{(\lambda +2G)}$. Examining the expression, we observe that, for an incompressible substrate material,
 $\nu = 0.5$ gives
 $\lambda \rightarrow \infty$ and, therefore,
 $\theta = {\delta \varPi }/{(\lambda +2G)}$ becomes zero. However, for substrates that are not significantly thin, the deformation for an incompressible substrate is not necessarily close to zero. To remedy this issue, for incompressible substrates, we take the expression for
 $\theta$ as
 ${\delta \varPi }/{(\lambda _{{C}}+2G)}$, where
 $\lambda _{{C}}$ is calculated from
 $G$ as per the expression
 ${2G\nu _{{C}}}/({1-2\nu _{{C}}})$ (or from
 $E_{{Y}}$ as per the expression
 ${E_{{Y}}\nu _{{C}}}/({(1+\nu _{{C}})(1-2\nu _{{C}})}))$ with
 $\nu _{{C}} = 0.49$. The consequence of this work around is that the non-dimensional fluid–substrate deflection
 $l$ gets diminished. This diminution is small for values of
 $\nu _{{C}}$ close to 0.5 (hence
 $\nu _{{C}}$ is chosen as 0.49). Further, the diminution of
 $l$ does not creep into its dimensional expression
 $l^{*}$, because
 $\theta$ (which gets multiplied to
 $l$ in order to obtain
 $l^{*}$) is magnified to the same extent to which
 $l$ is diminished (see § 2.6).
2.5. Key assumptions
We now state certain key assumptions and constraints, which enable us to simplify the formulation in order to obtain a solution while keeping the essential features of the physical set-up intact.
(i) The Womersley number is small,
 $\displaystyle \frac {\epsilon ^{2}\rho \omega R^{2}}{\mu } \ll 1 \implies D \ll \sqrt {{\mu }/{\rho \omega }}$. In other words, the Stokes flow approximation (i.e. negligible acceleration of the flow) is applicable.
(ii) We assume that, at the instant when the sphere is separated maximally from the origin, lubrication approximation holds true, i.e.
$\epsilon \ll 1$.(iii) Looking at the expression for
$k$ in (2.24a) and observing that many of the variable scales and different terms in the pertinent equations include $k^{{1}/{2}}$ in their expressions, we observe that negative values of $k$ cannot be accommodated. This implies that one is constrained to consider values of $\alpha$ less than unity and take the maximum time (starting from $t^{*}=0$ or $t = 0$) for approach or recession loading as $t_{{max}}^{*}={2}/{\omega }$ or $t_{{max}}=2$. These constraints of our framework restrict us to consider only part of the range of sphere motion addressed by Wang et al. (Reference Wang, Tan and Frechette2017), a limitation that we aim to resolve in further works. Furthermore, with these constraints, it is evident that $k$, as well as ${\textrm {d}k}/{\textrm {d}t}$, is either much smaller than or of the same order as unity. Keeping this in view along with item (ii), we examine (S7) in the supplementary material, and observe that lubrication approximation remains valid for the entire range of motion of the sphere.


2.6. Reynolds equation and Hankel-space pressure-deflection relation
The assumptions pertinent to the flow domain, as presented in § 2.5, render the flow domain governing equations simplified to those for Stokes flow under the lubrication approximation. Hence, we follow the standard approach for such problems and obtain the velocity fields and subsequently the Reynolds equation,
 \begin{equation} \frac{1}{12r}\frac{\textrm{d}}{\textrm{d}r}\left[r\left(H_{{I}}+\varGamma l+\varGamma_{{S}} l_{{S}}\right)^{3} \frac{\textrm{d}p_{{hd}}}{\textrm{d}r}\right] = V, \end{equation}
subject to the boundary conditions,
 \begin{equation} \left.\frac{\textrm{d} p_{{hd}}}{\textrm{d} r}\right|_{r=0} = 0, \quad \left.p_{{hd}}\right|_{r\rightarrow \infty} \rightarrow 0. \end{equation}
In (2.31),  $V=V_{{I}}+V_{{S}}+V_{{C}}$, where the expressions for
 $V_{{I}}$,
 $V_{{S}}$ and
 $V_{{C}}$ are given in equations S9a, S9b and S10b of the supplementary material, re-iterated below,
 \begin{gather} V_{{I}} = \left\{ \begin{array}{@{}ll} \displaystyle -\sin(t), & \text{oscillatory} \\ \displaystyle -1, & \text{ approach} \\ \displaystyle 1, & \text{recession} \end{array} \right. \end{gather}
 \begin{gather} V_{{S}} = \frac{\varGamma_{{S}}}{\alpha}\left[k\frac{\partial l_{{S}}}{\partial t}+\frac{kl_{{S}}}{\theta_{{S}}}\frac{\textrm{d}\theta_{{S}}}{\textrm{d}t}\right], \end{gather}
 \begin{gather} V_{{C}} = \frac{\varGamma}{\alpha}\left[k\frac{\partial l}{\partial t}+\frac{kl}{\theta}\frac{\textrm{d}\theta}{\textrm{d}t} -\frac{r}{2}\frac{\textrm{d}k}{\textrm{d}t}\frac{\partial l}{\partial r}\right]. \end{gather}
Employing a Hankel-transformation approach similar to Harding & Sneddon (Reference Harding and Sneddon1945) (see § S3 of the supplementary material), we obtain the Hankel-space deflection-pressure relation,
 \begin{equation} \tilde{l} = X\tilde{p}, \end{equation}
where  $X$ is the compliance function, which represents the combined effect of the substrate's compliance properties and its thickness. It is given as,
 \begin{equation} X = \frac{\beta}{\delta}\left(\frac{\lambda+2G}{G}\right)\left[\frac{\varLambda_{(3,2)} \left(1-\textrm{e}^{{-}4\gamma x}\right)-4\varLambda_{(1,2)}\gamma x\textrm{e}^{{-}2\gamma x}}{2\varLambda_{(1,3)}\gamma x \left(1+\textrm{e}^{{-}4\gamma x}\right)+\left\{(4\varLambda_{(2,2)}+4G^{2}) \gamma x+8\varLambda_{(1,1)} \gamma^{3}x^{3}\right\}\textrm{e}^{{-}2 \gamma x}}\right], \end{equation}
with
 \begin{equation} X ={-}\frac{\beta}{\delta}\left(\frac{\lambda+2G}{G}\right)\left[\frac{\varLambda_{(1,2)}}{\varLambda_{(1,3)}+\varLambda_{(2,2)}+G^{2}}\right]\quad \text{at }x=0, \end{equation}
where,  $\varLambda _{(a,b)} = (\lambda +aG)(\lambda +bG)$,
 $\gamma = {\beta }/({k^{{1}/{2}}\epsilon ^{{1}/{2}}})$ and
 $\tilde {l}$ and
 $\tilde {p}$ are the zeroeth-order Hankel transforms of
 $l$ and
 $p$ (see (S22) of the supplementary material for the definition of the Hankel transforms).
We consider the case of an incompressible substrate. As discussed in § 2.4, using the regular expression for  $\theta$ (i.e.
 ${\delta \varPi }/({\lambda +2G})$) leads to its value becoming zero (because
 $\lambda \rightarrow \infty$). On the other hand, examining (2.35), we see that
 $X$ approaches infinity – this occurs because the power of
 $\lambda$ is higher (three) in the denominator and lower (two) in the numerator of
 $X$. Hence, the product of
 $\theta$ and
 $X$ becomes indeterminate but cannot be ruled to be necessarily zero – this product is of interest here because it manifests in obtaining the dimensional expression of deflection
 $l^{*}$. To remedy the said indeterminacy, we first set the expression for
 $\theta$ to
 ${\delta \varPi }/({\lambda _{{C}}+2G})$, as specified in § 2.4, and next make corresponding changes to the traction balance condition (see (S27) of the supplementary material), and get,
 \begin{equation} X = \frac{\beta}{\delta}\left(\frac{\lambda_{{C}}+2G}{G}\right)\left[\frac{\varLambda_1\left(1-\exp\left({-}4\gamma x\right)\right)-\varLambda_2\gamma x\exp\left({-}2 \gamma x\right)}{\varLambda_3\gamma x \left(1+\exp\left({-}4\gamma x\right)\right)+\left\{\varLambda_4 \gamma x+\varLambda_5 \gamma^{3}x^{3}\right\}\exp\left({-}2 \gamma x\right)}\right], \end{equation}
with
 \begin{equation} X ={-}\frac{\beta}{\delta}\left(\frac{\lambda_{{C}}+2G}{G}\right)\left[\frac{\varLambda_2}{2\varLambda_3+\varLambda_4}\right]\quad \text{at }x=0, \end{equation}
where  $\boldsymbol {\varLambda } = [\varLambda _i]_{i=1,\ldots ,5} = [1, 4, 2, 4, 8]$. The expression for
 $X$ in (2.36) compared to that in (2.35) shows that, due to using
 $\lambda _{{C}}$,
 $X$ is diminished to the same extent as
 $\theta$ is magnified. Hence,
 $l$, obtained as per (2.34), is also diminished to the same extent, while
 $l^{*}$ is not diminished or magnified.
Having derived the Hankel-space expression for the deflection in terms of the pressure, in § S4 of the supplementary material, we have discussed expressions for  $X$ in combinations of the different limits of substrate thickness and substrate material compressibility.
2.7. Key parameters
Below, we discuss some of the key non-dimensional parameters that appear in the mathematical formulation detailed above. Also, when applicable, we explicate the restrictions on these parameters in the studies reported by Leroy & Charlaix (Reference Leroy and Charlaix2011) and Wang et al. (Reference Wang, Tan and Frechette2017).
(i)
$\alpha = h_0/D$, which quantifies the smallness or largeness of the sphere amplitude. Its value is restricted to the interval [0,1). The case of small amplitude of sphere motion corresponds to $\alpha \ll 1$, and the framework of Leroy & Charlaix (Reference Leroy and Charlaix2011) is restricted to this regime, apart from being restricted to considering only oscillatory motion of the sphere and not approach and recession.(ii)
$\delta$, which quantifies the depth into the substrate until which appreciable deformation occurs. Re-iterating the discussion at the end of § 2.4, we assert that, for a thin substrate, $\delta$ is simply $\beta$, whereas for a semi-infinite substrate, $\delta$ is deduced to be $\sqrt {k\epsilon }$. Hence, there is a cross-over regime of thickness of the substrate, corresponding to $\beta \sim \sqrt {k\epsilon }$, which falls into neither of the thin and semi-infinite limits.(iii)
$\nu$, which quantifies compressibility of the substrate material. The limit of $\nu = 0$ corresponds to a hypothetical ‘perfectly compressible’ limit whereas $\nu = 0.5$ corresponds to the incompressible limit, as discussed in § S3 of the supplementary material. Since a multitude of biological and polymeric materials exhibit appreciable incompressibility, focussing on such materials, the framework by Wang et al. (Reference Wang, Tan and Frechette2017) is restricted to the case of $\nu = 0.5$.(iv)
$\varGamma$, which quantifies the first mode of two-way coupling between the effective pressure on the substrate and its deformation. Examining (2.26) and (2.31), we observe that for $\varGamma \not \ll 1$, hydrodynamic as well as non-hydrodynamic pressure components become dependent on the substrate deformation, which in turn is itself dependent on the net effective pressure. Essentially, the pressure components and substrate deformation are interdependent and their respective governing equations need to be solved simultaneously to arrive at a converged solution. This interplay essentially leads to a two-way coupling between pressure on the substrate and its deformation. Furthermore, there is a similar two-way coupling between force on the spring and its deformation, quantified by $\varGamma _{{S}}$. The framework presented by Leroy & Charlaix (Reference Leroy and Charlaix2011) did not consider presence of a spring, i.e. $\varGamma _{{S}}$ is zero, and was restricted to study situations where $\varGamma$ is negligible.(v)
$\varGamma /\alpha$, which quantifies the second mode of two-way coupling between the pressure on the substrate and its deformation (this mode is found to be strong only when the DLVO forces are either absent or small when compared with hydrodynamic pressure). Examining (2.31), we observe that, for $\varGamma /\alpha \sim 1$, the hydrodynamic pressure becomes dependent on the time rate of change of substrate deformation, which in turn is itself dependent on the net effective pressure. This two-sided interdependence is another mode of two-way coupling between the effective pressure on the substrate and its deformation. There is a similar two-way coupling between force on the spring and the time rate of its deformation, quantified by $\varGamma _{{S}}/\alpha$.(vi) Additionally, there are two more non-dimensional parameters, which, although they do not appear in the mathematical formulation, are instrumental in determining the system dynamics when DLVO interactions are present. They are
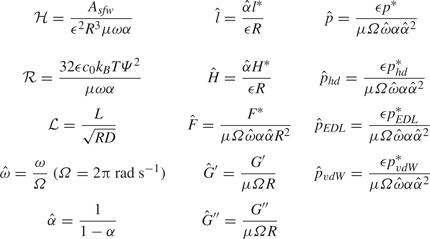
$\mathcal {H}$ and $\mathcal {R}$, which compare the strengths of the vdW pressure and EDL disjoining pressure to hydrodynamic pressure. The expressions for these parameters are presented in table 2. The frameworks developed by Leroy & Charlaix (Reference Leroy and Charlaix2011) and Wang et al. (Reference Wang, Tan and Frechette2017) did not consider DLVO interactions, i.e. in the purview of their analysis, $\mathcal {H} = \mathcal {R} = 0$.


Normalized system variables and parameters.

3. Solution methodology
Equations (2.31) (supported by (2.33)), (2.34) and (2.25), subject to the boundary condition (2.32), coupled with the expression for  $X$ as per (2.35) or (2.36) depending on whether the substrate material is compressible or incompressible, respectively, and the expressions for the non-hydrodynamic pressure components as presented in (2.26), constitute the set of equations representing any physical system of interest. The solution for these equations is obtained by marching on a discretized
 $t$-grid. The solution methodology is presented ahead.
For any particular case being studied, at any specific instance of the oscillation/range of motion, the EHD interaction between the effective pressure and deflection can either be ‘one-way coupled’ (OWC), i.e. the pressure is independent of deflection as well as the spring compression, or ‘two-way coupled’ (TWC), i.e. the pressure is dependent on deflection or spring compression or both. Re-iterating the discussion in § 2.7, we recognize that the two-way coupling between the effective pressure and deflection may occur in two modes – first, the deflection or spring compression or both are comparable to the gap between sphere and substrate in the absence of substrate deformation and the spring compression ( $H_{{I}}^{*}$), which occurs when
 $\varGamma \not \ll 1$ or
 $\varGamma _{{S}} \not \ll 1$ or both, and second, the time rate of change of the deflection is comparable to the time rate of change of the gap between the sphere and substrate in the absence of substrate deformation and spring compression
 $({\partial H_{{I}}^{*}}/{\partial t^{*}})$, which occurs when
 ${\varGamma }/{\alpha }$ or
 ${\varGamma _{{S}}}/{\alpha }$ or both multiplied by
 \begin{equation} \max\left(1,\left|\frac{1}{\theta}\frac{\textrm{d}\theta}{\textrm{d}t}\right|, \left|\frac{1}{k}\frac{\textrm{d}k}{\textrm{d}t}\right|\right) \end{equation}
is not much smaller than unity. Hence, if one or more of these conditions occurs, the coupling is considered to be TWC or else OWC.
For OWC, the hydrodynamic pressure,  $p_{{hd}}$, is solved straightaway using (2.31) as,
 \begin{equation} p_{{hd}} ={-}\frac{3V_{ I}}{H_{{I}}^{2}}. \end{equation}
Similarly, the non-hydrodynamic pressure components are given as their terms in (2.26), with the  $\varGamma l$ and
 $\varGamma _{ S} l_{ S}$ terms dropped for each, i.e.
 \begin{equation} \left. \begin{gathered} p_{{EDL}} = 32\varPsi\exp\left({-}k\epsilon KRH_{{I}}\right), \\ p_{{vdW}} ={-}\frac{1}{H_{{I}}^{3}}. \end{gathered} \right\} \end{equation}
Once the pressure components and thus the net effective pressure is obtained, the solution for deflection is obtained directly using (2.34).
For two-way coupling, the deflection is obtained by numerically solving the discretized versions of the involved equations. We employ a multi-variable Newton–Raphson scheme for the same, and details of the procedure are presented in § S4 of the supplementary material.
4. Results and discussion
The system variables of interest are the force between the sphere and substrate and the fluid–substrate interface deflection. To explain the results, we resort to the ‘normalized variables’, which are the original dimensional variables (ones with the superscript  $^{*}$) normalized with appropriate physical scales. These normalized variables are annotated using the
 $\hat {}$ symbol. Similar to the normalized variables, we use two non-dimensional DLVO parameters,
 $\mathcal {H}$ and
 $\mathcal {R}$, as discussed in § 2.7 and presented in table 2. We note that normalized time
 $\hat {t}$ is identical to the transformed time
 $t$, since time has been transformed using a constant. Also, the deflection presented henceforth corresponds to the deflection at the origin (at
 $r=0$).
For the limiting case of an asymptotically rigid substrate and in the absence of a spring, the total force between the sphere and the substrate will simply be a linear superposition of the individual contributions of the hydrodynamic force, EDL disjoining force and vdW force, and will follow the closed-form expression,
 \begin{equation} \left. \begin{aligned} F_{ rigid}^{*} & = 2{\rm \pi}\int_{r^{*}=0}^{r^{*}\rightarrow\infty} p_{ rigid}^{*}r^{*}\,\textrm{d}r^{*} \\ & = 2{\rm \pi} R^{2}\left[-\frac{3\mu\omega\alpha V_{ I}}{k}+\frac{64c_0k_{ B}T\varPsi^{2}}{\kappa R}\exp\left({-}k\epsilon\kappa R\right)-\frac{A_{sfw}}{12{\rm \pi} k^{2}\epsilon^{2}R^{3}}\right].\\ \implies\quad \hat{F}_{ rigid} & = \frac{2{\rm \pi}(1-\alpha)}{\mu\omega\alpha}\left[-\frac{3\mu\omega\alpha V_{ I}}{k}+\frac{64c_0k_{ B}T\varPsi^{2}}{\kappa R}\exp\left({-}k\epsilon\kappa R\right)-\frac{A_{sfw}}{12{\rm \pi} k^{2}\epsilon^{2}R^{3}}\right]. \end{aligned} \right\} \end{equation}
In the equation above, the first, second and third terms in the square braces correspond to the contributions of hydrodynamic pressure, EDL pressure and vdW pressure to the total force. We present the contrast of force in the system with the prediction as per (4.1) in the results discussed ahead.
In § 4.1, we study approach and recession loading. We first consider approach loading for the scenario where a spring connects the actuator to the sphere. Here, we study variations of the cases studied by Wang et al. (Reference Wang, Tan and Frechette2017). We next consider approach and recession loading for the scenario where the sphere is connected directly to the actuator ( $K_{{S}} \rightarrow \infty$ and
 $l_{{S}} = 0$). Here, we assess the effects of the loading speed on the force and deflection behaviour, in the presence and absence of DLVO forces. In § 4.3, we study oscillatory loading, focussing on the implications of the oscillation frequency, oscillation amplitude and DLVO forces for the force response of the substrate in a non-contact softness characterization technique by Leroy & Charlaix (Reference Leroy and Charlaix2011). In § 4.4, considering low-frequency high-amplitude oscillatory loading, we conduct parametric analyses which delineate the exclusive effects of DLVO forces on the extreme force and deformation behaviour of the system. In the interest of brevity in the main article, we have presented some auxiliary results in section S7 of the supplementary material.
4.1. Approach and recession loading
4.1.1. Approach loading with actuator connected to sphere via spring
Here, we consider cases which are variants of those studied by Wang et al. (Reference Wang, Tan and Frechette2017). We first consider the cases with the same spring constant, presented in figure 2, and assess the effect of substrate thickness and compressibility on deflection and force. In figure 2(a), time evolution of deflection for different combinations of thickness and compressibility are presented (see caption of the figure for details). We observe that higher thickness and higher compressibility (i.e. lower  $\nu$) lead to higher deflection. As the thickness varies from
 $\hat {\beta } = 0.5$ to
 $\hat {\beta } = 82$, the deflection magnifies by a factor of five. Further, for each
 $\hat {\beta }$, varying
 $\nu$ from 0.5 to 0 leads to growth in deflection. This growth, at
 $t=2$ (i.e. at the end of sphere motion), is by a factor of approximately two for
 $\hat {\beta } = 0.5$ and of approximately 1.25 for
 $\hat {\beta } = 82$. Expectedly, the deflection increases with increasing time, i.e. with decreasing gap between the sphere and origin (which amounts to increasing pressure). The most saturated lines correspond to the results obtained by Wang et al. (Reference Wang, Tan and Frechette2017) (having
 $\nu$ = 0.5), and their contrast to the lower saturation lines for each line type demonstrates the exclusive effect of substrate material compressibility. In figure 2(b), variations of the force with the gap for different combinations of thickness and compressibility, as well as for the rigid case, are presented. We observe that the contrast in force between different combinations of thickness and compressibility is much weaker in comparison with that in deflection. By comparing the computed force with the prediction of (4.1), we can observe that the presence of a spring and a soft substrate layer causes the maximum force to be significantly reduced as compared with the case of a rigid substrate (by a factor of approximately 0.2). Furthermore, we also observe that the sphere–substrate separation distance remains approximately three to four times greater than the separation that would occur for a rigid substrate and in the absence of a spring. Overall, in the cases studied in figure 2, the effects of substrate material compressibility and substrate layer thickness are delineated, pertaining to a scenario of approach loading. We observe that both the cases with high substrate material compressibility and high substrate thickness allow large deflection, i.e. they make the substrate effectively more compliant. This effect is compounded by the coupling of these factors. Keeping figure 2(a) in focus, we analyse this coupling as an additional contribution of higher substrate material compressibility over the contribution of increasing substrate layer thickness towards allowing for larger deformation. Lastly, for the thin substrate layer, any extent of substrate material compressibility brings approximately a finite deflection, which amounts to an increment by multiple orders of magnitude when compared with an incompressible substrate material. Notably, the deflection in the incompressible limit is O(
 $\gamma ^{2}$) smaller and is proportional to the Laplacian of the effective pressure rather than the effective pressure itself; see (S31) of the supplementary material for the expression of the deflection in line with the analysis presented in Chandler & Vella (Reference Chandler and Vella2020), and § S7.3 of the supplementary material for a comparison of radial deflection profile as per our modelling and based on the scaling and solution obtained by Chandler & Vella (Reference Chandler and Vella2020). The smallness of deflection in the thin incompressible limit is in line with the expectations set in § S4 of the supplementary material, which state that the ‘hardening’ effect of substrate material incompressibility diminishes as the substrate thickness alters from thin to semi-infinite.
Variation of (a) normalized deflection at the origin  $\hat {l}_{{O}}$ with normalized time
 $t$ and (b) normalized force
 $\hat {F}$ with normalized gap between the sphere and substrate at the origin
 $\hat {H}_{{S,O}}+\hat {l}_{{O}}$; DLVO forces are considered absent; common system parameter values are:
 $R = 1\ \textrm {mm}$,
 $D = 12\ \textrm {nm}$,
 $h_0 = 10\ \textrm {nm}$,
 $L = [0.38\ \textrm {mm}$ (
 $\hat {\beta } = 82$),
 $9.38\ \mathrm {\mu }\textrm {m}$ (
 $\hat {\beta } = 2$),
 $2.34\ \mathrm {\mu }\textrm {m}$ (
 $\hat {\beta } = 0.5$), 93.81 nm (
 $\hat {\beta } = 0.02$)],
 $\hat {\omega } = 0.3613$,
 $E_{{Y}} = 0.75\ \textrm {MPa}$,
 $\nu = [0, 0.3, 0.4, 0.5]$,
 $\mu = 1\ \textrm {mPa}\ \textrm {s}$,
 $K_{{S}} = 9.381\ \textrm {N}\ \textrm {m}^{-1}$; substrate thickness, parametrized by
 $\hat {\beta } = {\beta }/{\sqrt {\epsilon (1+\alpha )}}$ to assist in comparing with Wang et al. (Reference Wang, Tan and Frechette2017), is represented by line type –, solid lines are for
 $\hat {\beta } = 82$, dashed-dot lines are for
 $\hat {\beta } = 2$, dashed lines are for
 $\hat {\beta } = 0.5$, dotted lines are for
 $\hat {\beta } = 0.02$; decreasing colour saturation (also depicted with arrows in panel a) for each line type represents decreasing
 $\nu$ as
 $0.5 \rightarrow 0.4 \rightarrow 0.3 \rightarrow 0$; in panel (b), the solid blue line depicts the force prediction as per (4.1).

We next study the effect of variation of the spring constant on the force, and the additional contribution of the presence of DLVO forces, as presented in figure 3. Here, we restrict our analysis to a substrate thickness of  $\hat {\beta } = 0.02$ in order to highlight the exclusive effects of the spring. The substrate is thin and highest normalized deflection
 $\hat {l}_{{O}}$ over the complete set of results presented in figure 3 is 0.2. From both panels, we observe that lowering of
 $\hat {K}_{{S}}$ causes significant diminution in force – variation of
 $\hat {K}_{{S}}$ from 800 to 200 causes
 $\hat {F}$ at
 $t = 2$ to be diminished from
 ${\sim }6 - 8$ to
 ${\sim }1.2 - 1.5$ in panel (a) and from
 ${\sim }52.5$ to
 ${\sim }12.5$ in panel (b). The physical principle behind this observation is the following. For each of the cases considered here, the total force is repulsive. Higher
 $\hat {K}_{{S}}$ implies a stiffer spring, which compresses less in response to force, thus allowing the sphere and substrate to become closer and, as a result, the pressure and force increase. Next, we analyse the additional contribution of DLVO forces by considering the panels one by one. Using figure 3(a), we analyse the additional contribution of the vdW pressure over the hydrodynamic pressure (
 $\mathcal {R} = 0$ i.e. EDL disjoining pressure is absent). We observe that, for the range of
 $H$ considered, the vdW force causes a diminution of up to
 ${\sim }25\,\%$ in
 $\hat {F}$ at
 $t=2$. We see that higher
 $\mathcal {H}$ leads to larger diminution. This is because the vdW pressure is attractive and acts to counter the hydrodynamic pressure, which is repulsive for approach loading. However, the vdW pressure does not dominate the hydrodynamic pressure and thus its contribution to the total force (which remains repulsive) is diminutive in nature. Identical trend is observed for all values of
 $\widehat {K_{{S}}}$ (i.e. all line styles).
Variation of normalized force  $\hat {F}$ with normalized time
 $t$ for (a) different combinations of
 $K_{{S}}$ and
 $\mathcal {H}$ and (b) different combinations of
 $K_{{S}}$ and
 $\mathcal {R}$; common system parameter values are:
 $R$ = 1 mm,
 $D$ = 12.25 nm,
 $h_0$ = 9.75 nm,
 $L$ = 0.94
 $\mathrm {\mu }$m,
 $\hat {\omega }=93.9\times 10^{-3}$,
 $E_{{Y}}$ = 0.75 MPa,
 $\nu$ = 0.5,
 $\mu$ = 1 mPa s,
 $K_{{S}}$ = [1.2194
 $\textrm {N}\ \textrm {m}^{-1}$ (
 $\hat {K}_{{S}} = 100$),
 $2.4388 \ \textrm {N}\ \textrm {m}^{-1}$ (
 $\hat {K}_{{S}}$ = 200),
 $4.8777 \ \textrm {N}\ \textrm {m}^{-1}$ (
 $\hat {K}_{{S}}$ = 400),
 $9.7554\ \textrm {N}\ \textrm {m}^{-1}$ (
 $\hat {K}_{{S}}$ = 800)]; spring constant
 $K_{{S}}$, parametrized by
 $\hat {K}_{{S}} = {\alpha \epsilon K_{{S}}}/{\mu \omega R}$ to assist in comparing with Wang et al. (Reference Wang, Tan and Frechette2017), is represented by line type –, solid lines are for
 $\widehat {K_{{S}}} = 800$, dashed-dot lines are for
 $\widehat {K_{{S}}} = 400$, dashed lines are for
 $\widehat {K_{{S}}} = 200$, dotted lines are for
 $\widehat {K_{{S}}} = 100$; in panel a and its inset,
 $\mathcal {R} = 0$, and decreasing colour saturation (also depicted with arrows) for each line type represents decreasing value of
 $\mathcal {H}$ as
 $14.1860 \rightarrow 10.6395 \rightarrow 7.0930 \rightarrow 3.5465 \rightarrow 0$; in panel (b),
 $\mathcal {H} = 7.0930$ for all lines, thin lines (having lower magnitude) are for
 $\mathcal {R} = 0$ and normal thickness lines are for
 $\mathcal {R} = 117.5$; the solid blue lines in the insets depict the force predictions as per (4.1). (a) Without EDL disjoining pressure. (b) With EDL disjoining pressure.

Subsequently, using figure 3(b), we analyse the additional contribution of EDL disjoining pressure over vdW pressure and hydrodynamic pressure. Comparing the thick and thin lines, we can see a clear and dominating effect of EDL disjoining pressure, as introducing a  $\psi _0$ of 25 mV (which corresponds to
 $\mathcal {R} = 117.5$) leads to a magnification in force by a factor of
 ${\sim }4$ (for
 $\widehat {K_{{S}}} = 200$) to
 ${\sim }8$ (for
 $\widehat {K_{{S}}} = 800$). Higher magnification will be recovered for higher values of
 $\mathcal {R}$. It is observed that variation in
 $\mathcal {H}$ has a negligible effect when the EDL disjoining pressure is present. The most saturated lines in figure 3(a) correspond to cases obtained by Wang et al. (Reference Wang, Tan and Frechette2017) (having
 $\mathcal {H} = 0$), lower saturation lines in figure 3(a) demonstrate the additional effects of vdW pressure and figure 3(b) demonstrates the further additional effects of the EDL disjoining pressure. Lastly, we observe that the force predicted by (4.1) may be three to fifteen times larger than the actual force in the presence of a spring (the factor can be seen to depend on the DLVO force parameters and the spring constant) under the sole influence of the spring deformation (as the substrate deformation is negligible).
Overall, in the cases studied in figure 3, the effects of spring stiffness and DLVO forces are delineated, pertaining to a scenario of approach loading on a close-to-rigid substrate, gaining three key insights. First, a softer spring leads to smaller force, as it compresses more in response to the force and hence does not allow narrower separation between sphere and substrate, thus arresting any further growth in the effective pressure (please note that, for all cases, the total force is repulsive). Second, the vdW interaction, for the range of values of  $\mathcal {H}$ considered, causes diminution in the force by up to
 ${\sim }25\,\%$. Third, when present, the EDL disjoining pressure heavily dominates both the vdW pressure and hydrodynamic pressure, leading to growth in the total force by up to an order of magnitude.
4.2. Approach and recession loading with actuator connected to sphere directly
Here, we assess the effect of the loading speed on deflection and force response for approach and recession loading when the actuator is connected to the sphere directly (i.e.  $l_{{S}} = 0$). The substrate thickness is comparable to the lubrication zone radial length scale (
 $\beta = 5\times 10^{-3}$).
We first consider the purely hydrodynamic situation, presented in figure 4. Nearly identical plots apply for both approach and recession loading, as the approach loading leads to positive values and the recession loading leads to negative values, the magnitude being approximately same. Looking at figure 4(a), the normalized force is equal for all the speeds. Based on the expression for the normalized force (table 2), this implies that  $|F^{*}|$ is linearly dependent on loading speed and higher in magnitude for higher loading speed. Indeed, the coupling between pressure and deflection is predominantly one way. Thus, the paradigm of algebraic linear superposition applies, and the computed force matches the prediction from (4.1) (with
 $\psi _0$ and
 $A_sfw$ as zero):
 $|\hat {F}| ={6{\rm \pi} }/{\hat {H}_{{S,O}}} \approx {6{\rm \pi} }/({\hat {H}_{{S,O}}+\hat {l}_{{O}}})$. Looking at the inset, we observe that the contrast between approach and recession loading gets smaller for the lower loading speed. Looking at figure 4(b), we find, as expected, that higher loading speed leads to higher deflection.
Variation of (a) magnitude of normalized force  $|\hat {F}|$ and (b) magnitude of normalized deflection at origin
 $|\hat {l}_{{O}}|$ with sphere–substrate separation at the origin
 $\hat {H}_{{S,O}}+\hat {l}_{{O}}$, for approach and recession loading; DLVO forces are absent; common system parameter values are:
 $R$ = 1 mm,
 $D$ = 50 nm,
 $h_0$ = 45 nm,
 $L$ = 5
 $\mathrm {\mu }$m,
 $\hat {\omega }$ =
 $[10^{-1}, 10^{-2}, 10^{-3}, 10^{-4}]$,
 $E_{{Y}}$ = 17.5 MPa,
 $\nu$ = 0.45,
 $\mu$ = 1 mPa s; loading category is represented by line type
 $-$, solid lines are for approach loading, dashed-dot lines are for recession loading; decreasing colour saturation (also depicted with arrows in inset of panels a and b) for each line type represents decreasing value of
 $\hat {\omega }$ as
 $10^{-1} \rightarrow 10^{-2} \rightarrow 10^{-3} \rightarrow 10^{-4}$; all axes are log scaled; the solid blue line in panel a and its inset depicts the force prediction as per (4.1), and is close to the computed force owing to the absence of spring and negligible deformation of the substrate.

We next consider the situation when the DLVO forces are present ( $A_{{SFW}}$
 $10^{-21}$ J,
 $\psi _0$ = 100 mV), presented in figure 5. In keeping with the inference from the analysis of figure 3(b), the EDL disjoining pressure is the dominating effective pressure component, causing repulsive force and positive deflection. For a small sphere–substrate gap, identical behaviour is observed for approach and recession loading. Furthermore, there is no appreciable effect of the loading speed, as
 $\hat {l}$ (and thus
 $l^{*}$) is identical for all
 $\hat {\omega }$ and
 $\hat {F}$ is proportional to
 $\hat {\omega }$ (implying
 $F^{*}$ is identical for all
 $\hat {\omega }$). This occurs because the DLVO pressure components, which are not dependent on the direction and the speed of motion but only on the separation, are the main contributors to the force and deflection at small to medium sphere–substrate gaps. As we consider higher sphere–substrate gaps, the effect of loading speed, as well as contrast between approach and recession loading, is observed. At a sufficiently large sphere–substrate gap (such that the DLVO pressure components are negligible), the force and the deflection are negative for the recession loading and remain positive for the approach loading. As compared with the situation without DLVO forces, we observe that the force (
 $F^{*}$) and deflection (
 $l^{*}$) are magnified by one to two orders of magnitude due to the presence of DLVO forces. Lastly, by comparing the computed force with the predictions of (4.1), we observe that the maximum magnitude of force as predicted by (4.1) is approximately 1.3 times the maximum magnitude of the computed force. Exclusively because of the extreme close proximity, the substrate deforms by the same order as the separation distance itself, indicating a significant alteration of the flow domain geometry owing to the substrate softness.
Variation of (a) magnitude of normalized force  $|\hat {F}|$ and (b) magnitude of normalized deflection at the origin
 $|\hat {l}_{{O}}|$ with sphere–substrate separation at the origin
 $\hat {H}_{{S,O}}+\hat {l}_{{O}}$, for approach and recession loading; DLVO forces are present with
 $A_{{sfw}} = 10^{-21}$ J and
 $\psi _0 = 100$ mV; common system parameter values are:
 $R$ = 1 mm,
 $D$ = 50 nm,
 $h_0$ = 45 nm,
 $L$ = 5
 $\mathrm {\mu }$m,
 $\hat {\omega }$ =
 $[10^{-1}, 10^{-2}, 10^{-3}, 10^{-4}]$,
 $E_{{Y}}$ = 17.5 MPa,
 $\nu$ = 0.45,
 $\mu$ = 1 mPa s; loading category is represented by line type
 $-$, solid lines are for approach loading, dashed-dot lines are for recession loading; decreasing colour saturation (also depicted with an arrow in panel a) for each line type represents decreasing value of
 $\hat {\omega }$ as
 $10^{-1} \rightarrow 10^{-2} \rightarrow 10^{-3} \rightarrow 10^{-4}$; the thin solid blue lines in panel are the predictions of (4.1); all axes are log scaled.

Overall, in the cases studied in figures 4 and 5, we have analysed the effects of the loading speed and presence of DLVO forces, pertaining to approach and recession loading, onto a substrate that is moderately thick and soft, i.e. the substrate layer thickness is comparable to the lubrication region radial length scale and its elasticity parameters are such that  $\hat {l}$ maximizes to
 ${\sim}1$ for the cases studied. We have found that, in the absence of DLVO forces, the force and deflection are strongly and linearly dependent on the loading speed – higher loading speed leads to higher magnitude for both. Furthermore, the deflection remains small, leading to the analytical expression
 $|\hat {F}| = {6{\rm \pi} }/{\hat {H}_{{S,O}}} \approx {6{\rm \pi} }/({\hat {H}_{{S,O}}+\hat {l}_{{O}}})$ holding true. However, in the presence of DLVO forces (with moderate values of
 $A_{{sfw}}$ and
 $\psi _0$), the effect of the loading speed vanishes on the force characteristics and the variation of deflection with the sphere–substrate gap (
 $\hat {H}_{{S,O}}+\hat {l}_{{O}}$). This occurs because the DLVO forces dominate the force and deflection, and these forces are dependent on the gap and not on the loading speed. Furthermore, the deflection in the presence of DLVO forces is appreciable, and its consequence leads to a larger sphere–substrate gap with a smaller force.
This last observation is a manifestation of a key feature of coupling between the pressure components (and therefore the force) with deflection, and the self-diminishing nature of repulsive pressure/force. We elaborate on this below, first emphasizing three preliminary phenomena. First, the expressions for the DLVO pressure components, (2.26), indicate that both grow in magnitude with decreasing magnitude of  $H_{{I}}^{*}+l_{{S}}^{*}+l^{*}$, i.e. the sphere–substrate gap. Similarly, the hydrodynamic pressure in one-way coupling follows the expression in (3.2), which indicates similar dependence of the sphere–substrate gap. Even in two-way coupling, this dependence often remains as is qualitatively. Second, the profile of the sphere (2.2) is such that the pressure components assume their maximum magnitude at the origin. As a result, the force is observed to typically follow the same sign as the net pressure at origin, i.e. if the net pressure at the origin is repulsive, the force is repulsive and vice versa. Third, the spring deformation
 $l_{{S}}$ and the deflection
 $l$ follow the (2.25) and (2.34), i.e. a repulsive pressure and force leads to positive
 $l_{{S}}$ and
 $l$, and vice versa. The combined effect of these three preliminary phenomena is that when the net effective pressure at the origin (and thus force) is repulsive, they cause positive spring deformation and deflection, which increases the sphere–substrate gap and leads to diminution in the magnitude of the net effective pressure at the origin and the force, in comparison with the limiting case where there is no spring and the substrate is rigid. This effect can be succinctly called as the ‘self-diminishing nature of repulsive pressure/force’. A less stiff spring as well as a more compliant substrate enhances this effect. Furthermore, the converse of this effect can occur when the net effective pressure at the origin (and thus force) is attractive, which can be succinctly called as the ‘self-magnifying nature of attractive pressure/force’.
4.3. High-frequency oscillatory loading
SPMs are often actuated with high-frequency oscillations for a variety of applications, a major one being the characterization of the viscoelastic behaviour of materials. The theoretical principle of this characterization paradigm was utilized by Leroy & Charlaix (Reference Leroy and Charlaix2011) in designing a methodology for fluid-mediated non-contact elasticity characterization of delicate substrates. The oscillation amplitude is typically restricted to a small value (in comparison with the mean separation of sphere from origin) so that the force response stays appreciably close to sinusoidal and, hence, interpretation of the storage and loss moduli from the force response becomes possible (Phan-Thien & Mai-Duy Reference Phan-Thien and Mai-Duy2017). A key aspect of this methodology is that the mediating fluid and the soft substrate together cause a force response from which one can recover the storage modulus and loss modulus well known in the viscoelasticity characterization paradigm. These moduli are intrinsically coupled with the elastic modulus of the substrate and viscosity of the fluid, and hence, knowing the viscosity of the fluid enables one to obtain the elastic modulus of the substrate. In this subsection, we study variants of one of the cases studied by Leroy & Charlaix (Reference Leroy and Charlaix2011). Material properties (fluid as well as substrate) and substrate thickness are identical for all the results presented. We first present illustrative cases, highlighting the force and deflection characteristics for four contrasting loading conditions. Subsequently, we assess how the oscillation frequency, and the oscillation amplitude, when the oscillation frequency is high, affect the variation of storage and loss moduli with average sphere–origin separation.
4.3.1. Illustrative cases
We consider four contrasting illustrative cases. The quasi-steady state time evolution of the force  $\hat {F}$ is presented in figure 6. It is observed that the explicit temporal derivative terms occurring on the right-hand side of (2.31) have significant magnitude for high-frequency oscillations, and thus, there is an initial transience in the system behaviour before it acquires a quasi-steady state (we have illustrated this initial transience in figure S5 of the supplementary material). The quasi-steady system behaviour, especially the force response, is also strongly dictated by these temporal derivative terms.
Quasi-steady state variation of force  $F^{*}$ with time
 $t^{*}$ for (a)
 $\hat {\omega } = 10^{1}$,
 $\alpha = 0.02$, (b)
 $\hat {\omega } = 10^{1}$,
 $\alpha = 0.70$ (DLVO forces are present with
 $A_{{SFW}} =$ 10
 $^{-20}$ J and
 $\psi _0 =$ 2.5 V, i.e.
 $\mathcal {H}$ = 0.091 and
 $\mathcal {R} =$ 90.15), (c)
 $\hat {\omega } = 10^{3}$,
 $\alpha = 0.02$, (d)
 $\hat {\omega } = 10^{3}$,
 $\alpha = 0.70$; common system parameter values are:
 $R$ = 10
 $\mathrm {\mu }$m,
 $D$ = 50 nm,
 $L$ = 1
 $\mathrm {\mu }$m,
 $E_{{Y}}$ = 1 MPa,
 $\nu$ = 0.45,
 $\mu$ = 100 mPa s; for panels (c,d), system behaviour in the presence and in absence of DLVO forces are practically identical; thick solid lines are the computed solution, dashed lines are the most appreciable sinusoidal fit to the computed solution (inapplicable for panel b); thin solid blue lines depict the force prediction by (4.1).

(i) The first illustrative case corresponds to low-frequency oscillations with low amplitude (
$\hat {\omega } = 10^{1}$ and $\alpha$ = 0.02), presented in figure 6(a). The coupling of pressure and deflection is one-way (indicating that the substrate remains practically rigid), and the computed force coincides with the force prediction by (4.1) (thin blue line). Furthermore, the force response is sinusoidal and has a lag of ${\rm \pi}$/2 in comparison with the oscillatory loading. The presence or absence of DLVO forces for this case is found to be inconsequential, as the separation is always large enough for them to be negligible.(ii) The second illustrative case corresponds to low-frequency oscillations with high amplitude (
$\hat {\omega } = 10^{1}$ and $\alpha = 0.7$), presented in figure 6(b). Here, we consider the DLVO forces to be present, with $A_{{SFW}} = 10^{-20}$ J and $\psi _0 = 2.5$ V, i.e. $\mathcal {H}$ = 0.091 and $\mathcal {R} = 90.15$. The force response is observed to be significantly different from sinusoidal, and is considerably close to the prediction of (4.1), except for part of the range of the sphere motion where it is closest to the origin and approaching the origin. Looking at this range of motion, we observe that the maximum magnitude of the force, as predicted by (4.1), is approximately twice as large compared with the maximum magnitude of the force as obtained from the present numerical solution. This is attributed to the substrate deformation induced enhancement in the sphere–substrate separation causing appreciable decrease in the sphere–substrate force, which is a manifestation of the self-diminishing nature of the repulsive pressure/force due to softness of the substrate.(iii) The third illustrative case corresponds to high-frequency oscillations with low amplitude (
$\hat {\omega } = 10^{3}$ and $\alpha$ = 0.02), presented in figure 6(c). The presence or absence of DLVO forces for this case is found to be inconsequential, as the separation is always large enough for them to be negligible. While the force varies sinusoidally with time, it is significantly different from the prediction by (4.1) in both magnitude and phase. This observation is in stark contrast with the first illustrative case, and is the premise for obtaining the storage and loss moduli for the non-contact softness characterization methodology of soft materials by Leroy & Charlaix (Reference Leroy and Charlaix2011).(iv) The fourth illustrative case is of high-frequency oscillations with high amplitude (
$\hat {\omega } = 10^{3}$ and $\alpha$ = 0.7), presented in figure 6(d). While variation of the force with time cannot be claimed to be perfectly sinusoidal, it is close enough to the presented approximately by a sine-curve fit. Lastly, like (i) and (iii), the presence or absence of DLVO pressure components for this case turns out to be inconsequential. However, unlike (i) and (iii), the cause is that the hydrodynamic pressure is significantly larger than DLVO pressure components, owing to the high oscillation frequency. Here, we note that the approximate sine fit for the force response is such that the ratio of $F^{*}$ to $h_0$ remains the same for this illustrative case and the third illustrative case, i.e. the recovered storage and loss moduli will be the same for these cases. This implies that large oscillation amplitude as well as the presence of DLVO forces does not significantly affect the recovered storage and loss moduli for a substrate material. Lastly, we can see that (4.1) predicts a maximum magnitude of the force which is nearly twice as large compared with that obtained from the numerical solution. Also, similar to figure 6(c), the force as per the numerical solution is not in phase with the force predicted by (4.1). In addition, the sinusoidal nature of the force response is not apparent from the prediction of (4.1).


Based on the analysis of these illustrative cases, we observe that DLVO forces are crucial only for low-frequency loading with sufficiently large amplitude, and therefore, we have relegated studying their effects to § 4.4. Lastly, elucidating some aspects of the underlying physical effects, we have presented the quasi-steady time evolution of the pressure components at the origin for some of the illustrative cases in figure S6 of the supplementary material.
4.3.2. Effect of loading conditions on storage and loss moduli
We first assess the effects of oscillation frequency on the behaviour of low-amplitude oscillations. We consider one of the cases studied by Leroy & Charlaix (Reference Leroy and Charlaix2011), and study its storage and loss modulus ( $\hat {G}^{\prime }$ and
 $\hat {G}^{\prime \prime }$) variations with the mean sphere–origin separation for oscillation frequencies ranging from
 $\hat {\omega } = 10^{0}$ to
 $\hat {\omega } = 10^{5}$. The storage and loss moduli are recovered from the force responses for a given oscillatory loading – we briefly discuss the mathematical details in section S6 of the supplementary material.
Variations of  $\hat {G}^{\prime }$ and
 $\hat {G}^{\prime \prime }$ with
 $\epsilon$ for
 $\hat {\omega } = 10^{1}, 10^{3}, 10^{4}$ are presented in figure 7. For
 $\hat {\omega } = 10^{1}$,
 $\hat {G}^{\prime }$ is insensitive to
 $\epsilon$ for values of
 $\epsilon$ higher than approximately
 $3\times 10^{-3}$. Similarly, for
 $\hat {\omega } = 10^{4}$, both
 $\hat {G}^{\prime }$ and
 $\hat {G}^{\prime \prime }$ become insensitive to
 $\epsilon$ for values of
 $D$ lower than approximately
 $2.5\times 10^{-3}$. These insensitivities are exaggerated as one moves to more extreme frequencies in either direction – for
 $\epsilon$ varying between
 $0.5\times 10^{-3}$ and
 $5\times 10^{-3}$, for
 $\hat {\omega } = 10^{1}$,
 $\hat {G}^{\prime }$ is insensitive to
 $\epsilon$, and, for
 $\hat {\omega } = 10^{5}$, both
 $\hat {G}^{\prime }$ and
 $\hat {G}^{\prime \prime }$ are insensitive to
 $\epsilon$. Hence, we deduce that
 $\hat {\omega } = 10^{3}$ is the suitable frequency to recover appreciable sensitivity of
 $\hat {G}^{\prime }$ and
 $\hat {G}^{\prime \prime }$ to
 $\epsilon$ for the considered range of material properties and loading conditions.
Variation of storage modulus  $G^{\prime }$ (solid lines), and loss modulus
 $G^{\prime \prime }$ (dotted line) with
 $\epsilon$, for
 $\hat {\omega }$ =
 $10^{1}$ (a),
 $10^{3}$ (b) and
 $10^{4}$ (c); common system parameter values are:
 $R$ = 10
 $\mathrm {\mu }$m,
 $h_0$ = 1 nm,
 $L$ =1
 $\mathrm {\mu }$m,
 $E_{{Y}}$ = 1 MPa,
 $\nu$ = 0.45,
 $\mu$ = 100 mPa s; circle markers in (b) are the values obtained by Leroy & Charlaix (Reference Leroy and Charlaix2011).

Here, we note that we are studying the substrate deformation behaviour considering its deformation to be quasi-static, i.e. we do not consider the presence of transience in the elastic deformation. However, for excitations of the substrate at higher frequencies (in the MHz and GHz ranges), elastic waves and acoustic waves can occur and dictate the dynamics of the system. Indeed, in the context of SPM, elastic waves are utilized for subsurface imaging, detection of buried defects, voids in electronic components and more (Shekhawat et al. Reference Shekhawat, Srivastava, Dravid and Balogun2017; Quesson et al. Reference Quesson, Vanneer, Vanrie, Vanes, Piras, Hatakeyama, Mohtashami, Navarro, Duivcnvoorde and Sadeghian2018), but are not brought into the scope of the present analysis that is restricted to slower excitations.
4.4. Low-frequency oscillatory loading
In this subsection, we delineate the effects of the presence of DLVO forces on the extremes of force and deflection response for low-frequency high-amplitude oscillations of the sphere ( $\hat {\omega }$ = 1,
 $\alpha$ = 0.9). To this end, we present parametric variations of the maximum attractive (positive), maximum repulsive (negative) and mean magnitudes of the force and deflection over one complete oscillation, with the parameters
 $\mathcal {H}$ and
 $\mathcal {R}$. We take the range of
 $A_{{sfw}}$ as
 $10^{-22}$ J to
 $10^{-20}$ J, and the range of
 $\psi _0$ as 25–2500 mV. These values of Hamaker's constant and surface potential represent the range of typical values that occur in many engineering and biological materials (Hunter Reference Hunter1986; Israelachvili Reference Israelachvili2011).
We assess the effect of vdW pressure first, presented in figure 8. EDL disjoining pressure is considered absent and the substrate thickness is comparable to the lubrication zone radial length. For the range of  $A_{{SFW}}$ considered,
 $\mathcal {H}$ varies from 0.007 to 0.7, indicating that the vdW pressure does not dominate over the hydrodynamic pressure.
Variation with  $\mathcal {H}$ of maximum attractive (negative), maximum repulsive (positive) and mean magnitudes over one complete oscillation of (a) normalized force
 $\hat {F}$ and (b) normalized deflection at origin
 $\hat {l}_{{O}}$; EDL disjoining pressure is considered absent; common system parameter values are:
 $R$ = 1 mm,
 $D$ = 50 nm,
 $h_0$ = 45 nm,
 $L$ = [0.5 mm (semi-infinite), 5
 $\mathrm {\mu }$m (thick), 50 nm (thin)],
 $\hat {\omega }$ = 1,
 $E_{{Y}}$ = 17.5 MPa,
 $\nu$ = 0.45,
 $\mu$ = 1 mPa s; solid lines are for ‘maximum repulsive’, dashed-dot lines are for ‘maximum attractive’ and dotted lines are for ‘mean’; decreasing colour saturation for each line type represents decreasing substrate thickness as semi-infinite
 $\rightarrow$ thick
 $\rightarrow$ thin; time evolution of normalized pressure components and effective pressure at origin for
 $\mathcal {H}=0.7$ (i.e.
 $A_{{sfw}} = 10^{-20}$ J) for semi-infinite substrate is presented in the inset of panel a; thin blue lines in panel a depict the force prediction by (4.1).

We first assess the force characteristics, presented in figure 8(a). In the inset, time evolution of the different pressure components for  $\mathcal {H} = 0.7$ is presented. The counteraction of hydrodynamic pressure and vdW pressure for the first half of the sphere oscillation and their co-action for the second half of the sphere oscillation lead to a distinctly weaker repulsive pressure and the mean pressure as compared with the attractive pressure. This effect is reflected in the force characteristics, where the maximum repulsive force is much smaller than the maximum attractive force, and the mean force is further smaller. Next, the attractive force can be seen to exhibit its self-magnifying nature. This effect manifests as two features of the force characteristics. First, the magnitude of the maximum attractive force decreases as the substrate thickness decreases (i.e. substrate allows lesser deflection), and second, the growth rate of the maximum attractive force increases with
 $\mathcal {H}$ (higher
 $\mathcal {H}$ leads to higher deflection and magnifies the attractive force more strongly). Lastly, we note that the deflection is significant only when the force is attractive. As a result, the deflection, and therefore the substrate thickness, does not strongly affect the maximum repulsive force characteristics.
We assess the deflection characteristics next, as presented in figure 8(b). The deflection characteristics exhibit more pronounced but qualitatively similar trends as compared to the force characteristics. This occurs because the deflection characteristics correspond to the deflection at the origin, where the vdW pressure is the strongest. In contrast, the force depends on the interplay of pressure components along the increasing radial distances as well, where the vdW pressure attenuates faster than the hydrodynamic pressure.
We next assess the effect of EDL disjoining pressure, as presented in figure 9. The vdW pressure is considered to be present with  $A_{{sfw}} = 10^{-20}$ J (
 $\mathcal {H} = 0.7$), and the substrate thickness is comparable to the lubrication zone radial length. For the range of
 $\psi _0$ considered,
 $\mathcal {R}$ varies from 7 to 700. We see that, except for sufficiently low values of
 $\psi _0$ (
 $\approx$25 mV and lower), the EDL disjoining pressure strongly dominates the vdW pressure and the hydrodynamic pressure, and is the primary and virtually the sole contributor to the deflection and the force characteristics. Indeed, considering smaller (than
 $10^{-20}$ J) magnitudes of
 $A_{{SFW}}$ leads to miniscule changes in the force and deflection characteristics.
Variation with  $\mathcal {R}$ of maximum attractive (negative), maximum repulsive (positive) and mean magnitudes over one complete oscillation of (a) normalized force
 $\hat {F}$ and (b) normalized deflection at origin
 $\hat {l}_{{O}}$; vdW pressure is present with
 $A_{{SFW}}$ = 10
 $^{-20}$ J, i.e.
 $\mathcal {H}$ = 0.7; common system parameter values are:
 $R$ = 1 mm,
 $D$ = 50 nm,
 $h_0$ = 45 nm,
 $L$ = [0.5 mm (semi-infinite), 5
 $\mathrm {\mu }$m (thick), 50 nm (thin)],
 $\hat {\omega }$ = 1,
 $E_{{Y}}$ = 17.5 MPa,
 $\nu$ = 0.45,
 $\mu$ = 1 mPa s; solid lines are for ‘maximum repulsive’, dashed-dot lines are for ‘maximum attractive’ and dotted lines are for ‘mean’; decreasing colour saturation for each line type represents decreasing substrate thickness as semi-infinite
 $\rightarrow$ thick
 $\rightarrow$ thin; thin blue lines in panel a depict the force prediction by (4.1).

We now take a look at the force characteristics presented in figure 9(a). The maximum attractive force is, as expected, much smaller in comparison with the maximum repulsive force and the mean force. The maximum repulsive force as well as the mean force increases with increasing  $\mathcal {R}$ in an almost linear manner, the former being approximately an order of magnitude larger than the first. Furthermore, the force is higher for thinner substrates. This occurs because a thinner substrate is effectively more rigid. Accordingly, it allows less deflection and thus restrains the self-diminishing nature of the repulsive force. Looking at the deflection characteristics presented in figure 9(b), we observe that the rate of increase of deflection gets smaller as we consider higher values of
 $\mathcal {R}$, a feature that is much subtler for the force characteristics. Deflection at larger
 $\mathcal {R}$ is higher, and, thus, it invokes the self-diminishing nature of the repulsive pressure more strongly, causing the said feature of the deflection response. On the other hand, since the force depends on the pressure along the radial length as well, this feature is less prominent in the force characteristics. Apart from this distinction, the deflection and the force characteristics are qualitatively similar.
Lastly, using both figures 8 and 9, and comparing the computed force characteristics with the prediction of (4.1), we make two observations. First, the force characteristics for the thin substrate are reasonably close to the prediction of (4.1), indicating that the thin substrate deforms negligibly enough to be asymptotically rigid. Second, under dominant vdW attraction, the interaction force can be higher by approximately 20 % due to substrate softness. Under dominant EDL mediated interactions, 40 % reduction in the said force (repulsive for this case) may be obtained due to substrate softness. These alterations are attributable to the self-magnification of the attractive interactions and self-reduction of the repulsive interactions when the substrate is soft enough, due to non-trivial alterations in the separation distance that may not be quantified by order of magnitude based theoretical estimates as presented in (4.1).
Overall, we gain three important insights. First, the self-magnifying nature of the attractive force and the self-diminishing nature of the repulsive force are the underlying phenomena behind multiple features of force and deflection characteristics. Second, when the EDL disjoining pressure is active, it strongly dominates the vdW pressure and thereby the force and deflection behaviour of the system. Third, the presence of DLVO forces can lead to magnification in the force characteristics of up to two orders of magnitude and in the deflection characteristics of up to an order of magnitude.
4.4.1. Cutoff distance for dominance of DLVO forces
For a situation where the DLVO forces are present in addition to hydrodynamic force, an important aspect of the interplay between these forces is the extent of sphere motion at which the DLVO forces become dominant over the hydrodynamic force. This extent is quantified by  $\hat {H}_{ I,O}$.
Keeping this in view, in figure 10, we present the variation of this ‘cutoff’  $\hat {H}_{ I,O}$ (named as
 $\hat {H}_{ I,O (cut\text {-}off, DLVO\text {-}hd)}$) with
 $\mathcal {R}$, corresponding to the system studied in figure 9. We obtain
 $\hat {H}_{ I,O (cut\text {-}off, DLVO\text {-}hd)}$ by two methods. The first method is based on the computed solution, i.e. we use the computed solution to numerically evaluate the contribution of DLVO forces to total force,
 \begin{equation} \left|\int_{r=0}^{r^{*}\gg \sqrt{k\epsilon}R}2{\rm \pi}(p_{ EDL}^{*}+p_{ vdW}^{*})r^{*}\,\textrm{d}r^{*}\right|, \end{equation}
and the contribution of hydrodynamic force to total force,
 \begin{equation} \left|\int_{r=0}^{r^{*}\gg \sqrt{k\epsilon}R}2{\rm \pi} p_{ hd}^{*}r^{*}\,\textrm{d}r^{*}\right|. \end{equation}
The second method is based on comparison of expressions in (4.1), i.e.
 \begin{equation} \left|\frac{64c_0k_{ B}T\varPsi^{2}}{\kappa R}\exp({-}k\epsilon\kappa R)-\frac{A_{sfw}}{12{\rm \pi} k^{2}\epsilon^{2}R^{3}}\right| \end{equation}
represents the contribution of DLVO forces to total force and  $|-({3\mu \omega \alpha V_{ I}})/{k}|$ represents the contribution of hydrodynamic force to total force.
Variation with  $\mathcal {R}$ of the cutoff value of
 $H_{ I,O}$ where the contribution of DLVO force to total force exceeds ten times the contribution of hydrodynamic force to total force (named
 $\hat {H}_{ I,O (cut-off, DLVO-hd)}$), corresponding to figure 9, for (a) the thin substrate (
 $L$ = 50 nm) and (b) the semi-infinite substrate (
 $L$ = 0.5 mm); the solid lines are based on the computed solutions and the square markers are obtained by comparing the terms in (4.1).

Looking at figure 10, we can see that the  $\hat {H}_{ I,O (cut\text {-}off, DLVO\text {-}hd)}$ based on the two methods match when the substrate is thin but do not agree when the substrate is semi-infinite. This occurs because the thin substrate corresponds to the limiting scenario when the substrate deformation turns out to be small enough compared with the characteristic length scale of the flow domain, so that the precise knowledge of the flow domain geometry at each instance of time is known a priori. This is physically reminiscent of a set-up where there is no spring connecting the actuator and the sphere and the substrate layer is asymptotically close to rigid. Accordingly, the closed-form analytical expression of the force between the sphere and substrate as obtained in (4.1) stands applicable. Hence, we infer that corresponding to the thin substrate limit of figure 9, one may thus directly obtain the cutoff value of
 $\hat {H}_{ I,O}$ where the DLVO force will become dominant over the hydrodynamic force, by using an order of magnitude analysis based on (4.1), corroborating its intuitive paradigm of linear superposition of force components. However, for the other limiting scenario, corresponding to the semi-infinite substrate limit, the substrate deforms to an extent that is comparable to the characteristic length scale of the flow domain so that the precise knowledge of the flow domain geometry at every time instant is not known a priori. Hence, as observed in figure 10(b), the
 $\hat {H}_{ I,O (cut\text {-}off, DLVO\text {-}hd)}$ based on the numerical solution does not quantitatively agree with the measure of theoretical cutoff following the order of magnitude analysis based on (4.1).
5. Conclusion
We have combined lubrication theory and solid linear elasticity to model the elastohydrodynamic interactions due to a pre-programmed axisymmetric movement of a rigid, spherical probe in proximity to a soft substrate coating atop a rigid platform separated by a thin layer of viscous fluid, by taking into account some essential aspects of electrostatic and vdW interactions. Our results reveal that these interactions lead to overwhelming effects in dynamic response, by magnifying the substrate deformation tenfold and the force response up to two orders of magnitude, in low-frequency high-amplitude oscillation limits.
To observe the exclusive effects of spring deformation and substrate deformation on the force response characteristics of the system, we also compared the computed forces for the different situations studied herein, with the theoretical force estimate obtained from mere linear superposition of the respective force components applicable under the limiting scenario of the absence of a spring and the presence of an asymptotically rigid substrate. We observed that the latter theoretical force estimate fails to capture some key features of two-way coupling between the flow and the substrate deformation. Accordingly, for approach and recession loading at low speeds and oscillatory loading at low frequency, the order-of-magnitude based algebraically additive force estimate has been shown to be grossly inaccurate, primarily because the said force estimation does not capture the self-magnifying nature of the attractive force and the self-diminishing nature of the repulsive force, otherwise inevitable artefacts of the intricately coupled two-way fluid–structure interactions over interfacial scales. On the other hand, for high-frequency oscillatory loading, the theoretical estimate is unable to capture the lag in the force response, a key component of the formalism for substrate softness characterization as outlined in Leroy & Charlaix (Reference Leroy and Charlaix2011). Furthermore, it does not predict a sinusoidal response with high amplitudes of oscillation of the probing sphere, an effect that is well captured otherwise from the computed solutions.
A major class of experimental situations where the above findings become useful pertains to the applications of SPM. Premised on this consideration, we studied variants of cases addressed by Leroy & Charlaix (Reference Leroy and Charlaix2011) and Wang et al. (Reference Wang, Tan and Frechette2017) which were not solvable by their respective theoretical frameworks. From the variants of cases addressed by Wang et al. (Reference Wang, Tan and Frechette2017), we have observed that the substrate material compressibility leads to higher substrate deformation and the presence of DLVO forces can lead to up to an order of magnitude magnification in the sphere–substrate force. From the variants of cases by Leroy & Charlaix (Reference Leroy and Charlaix2011), we observed that an increase in the oscillation amplitude leads to some degeneration in the sinusoidality of the sphere–substrate force response, but it remains appreciably close (with identical lag) to the sinusoidal force response recovered for low-amplitude oscillations. Similarly, the presence of DLVO forces does not affect system behaviour appreciably for high-frequency oscillations, as the high frequency leads to much larger hydrodynamic pressure that overwhelms the non-hydrodynamic interactions over interfacial scales. Further, by varying the frequency of oscillatory loading, we identified the order of the most suitable frequency for softness characterization of a particular substrate that was studied by Leroy & Charlaix (Reference Leroy and Charlaix2011). Lastly, we conducted parametric studies to delineate the exclusive effects of DLVO forces on the extremes of force and deformation behaviour of the system. We arrived at two key inferences based on the collective computations. First, higher substrate thickness and higher substrate compressibility (quantified as lower Poisson's ratio) allow for larger substrate deformation and hence make the substrate effectively softer. Second, when the pressure and the substrate deformation are TWC, the effective pressure as well as the interaction force, when summarily attractive is self-magnifying (i.e. substrate deformation acts to magnify magnitude of the effective pressure) and when summarily repulsive is self-diminishing (i.e. substrate deformation acts to diminish the magnitude of effective pressure).
Whereas the present study focusses on some key physical considerations that have not been highlighted a priori, there are certain obvious assumptions that deem further avenues of model refinement. For instance, in addition to DLVO forces, other short-range forces, including acid-base, hydration, solvation and steric interactions may lead to some discrepancies between observed dynamical responses and theoretical predictions, typically below liquid film thicknesses to the tune of 5 nm. At the geometric length scales that this study deals with, additional physical effects, such as wall slip, electrokinetics, capillarity and more, can also affect the system response in a rather decisive manner (Vinogradova & Feuillebois Reference Vinogradova and Feuillebois2000; Talapatra & Chakraborty Reference Talapatra and Chakraborty2008; Chakraborty & Chakraborty Reference Chakraborty and Chakraborty2010; Dey, Chakraborty & Chakraborty Reference Dey, Chakraborty and Chakraborty2011; Goswami & Chakraborty Reference Goswami and Chakraborty2011; Bakli & Chakraborty Reference Bakli and Chakraborty2012; Bandopadhyay & Chakraborty Reference Bandopadhyay and Chakraborty2012b; Kar, Maiti & Chakraborty Reference Kar, Maiti and Chakraborty2015; Bandopadhyay et al. Reference Bandopadhyay, Mandal, Kishore and Chakraborty2016; Karan, Chakraborty & Chakraborty Reference Karan, Chakraborty and Chakraborty2018a; Silkina, Asmolov & Vinogradova Reference Silkina, Asmolov and Vinogradova2019; Zhao et al. Reference Zhao, Zhang, van den Ende and Mugele2020).
While the above aspects indeed offer obvious avenues of further augmenting the present theory, the framework developed here is structured to be generic and flexible with a capability of predicting and complementing the experimental measurements provided by state-of-the art surface probing apparatus, by unveiling certain key aspects of the dynamic response of a flexible substrate that may even fall beyond the capabilities of experimental measurements. In addition, the non-DLVO effects and special facets of hydrodynamic interactions, mentioned above, may be suitably integrated into the model without altering the essential foundation of the theoretical framework. This opens up possibilities of developing more versatile theoretical models aimed at a wide range of soft-lubrication studies, holding utilitarian importance in application areas ranging from SPM to targeted drug delivery and even biomimetics over micrometre and nanometre scales. Furthermore, this study can inspire explorations that accommodate the inevitable effects of material softness in the existing research on traditional continuum scale transport phenomena (Ganguly & Chakraborty Reference Ganguly and Chakraborty2004; Yavari et al. Reference Yavari, Sadeghi, Saidi and Chakraborty2012; Priyadarshani et al. Reference Priyadarshani, Awasthi, Karan, Das and Chakraborty2021) as well as on mesoscale modelling dealing with exotic physical effects at the nanometric scale emerging out of finite particle size effects, rarefied gas flow and so on (Chakraborty & Durst Reference Chakraborty and Durst2007; Chakraborty & Padhy Reference Chakraborty and Padhy2008; Dongari, Durst & Chakraborty Reference Dongari, Durst and Chakraborty2010; Bandopadhyay & Chakraborty Reference Bandopadhyay and Chakraborty2012a).
Supplementary material and movies
Supplementary material and movies are available at https://doi.org/10.1017/jfm.2021.595.
Funding
P.K., J.C. and S.C. acknowledge the financial support of the Ministry of Human Resource Development, Government of India. J.C. thanks the DST-INSPIRE program of the Government of India (DST/INSPIRE Faculty Award/2016/DST/ INSPIRE/04/2015/002825) as well as the ISIRD Funding (IIT/SRIC/ME/MFD/201718/70) from IIT Kharagpur for the computational resources. S.C. acknowledges Department of Science and Technology, Government of India, for Sir J. C. Bose National Fellowship.
Declaration of interests
The authors report no conflict of interest.