Introduction
Local seed system and genetic diversity
Farmers in marginal areas of production environments employ high levels of crop genetic diversity in order to maintain food security. As a result, their livelihood strategy has an important secondary output: the maintenance of genetic diversity. Agroecosystems in these areas are often characterized by low soil fertility, drought, highly variable rainfall and the farmers' use of few external inputs. Formal seed supply appears to be weak in these marginal areas of production (Tripp, Reference Tripp2001). Consequently, a major strategy for availing of, and providing access to, seed has its source in the farmers themselves, i.e. the local seed system (Hardon and De Boef, Reference Hardon, De Boef, De Boef, Amanor, Wellard and Bebbington1993). The local or informal seed system is described as seed saving, selection and exchange practices, associated knowledge, and social relationships (Almekinders and Louwaars, Reference Almekinders and Louwaars1999). They are important not only for rural livelihoods but also for the conservation and evolution of crop diversity on-farm (Louette et al., Reference Louette, Charrier and Berthaud1997; Bellon, Reference Bellon2004; Hodgkin et al., Reference Hodgkin, Rana, Tuxill, Balma, Subedi, Mar, Karamura, Valdivia, Collado, Latournerie, Sadiki, Sawadogo, Brown, Jarvis, Jarvis, Padoch and Cooper2007). The exchange of seed and varieties among villagers, and the relative isolation of local varieties in their production environments, may contribute to the existence of genotypes that are adapted to the specific environment in which they are cultivated, i.e. local adaptation. Much of the literature on seed systems cites the importance of social relationships that facilitate seed flows and exchange in networks (Almekinders et al., Reference Almekinders, Louwaars and De Bruijn1994; McQuire, Reference McQuire2007; De Boef and Bishaw, Reference De Boef, Bishaw, Thijssen, Bishaw, Beshir and De Boef2008). Badstue et al. (Reference Badstue, Bellon, Berthaud, Juárez, Manuel Rosas, Solano and Ramírez2006) address the social arrangements that shape the particular case of maize seed and information flows on which farmers depend in specific communities in Mexico. However, relatively little is known about the individuals who play significant roles in these networks and the processes associated with seed dissemination, exchange of seeds and varieties. Furthermore, the link between the functioning of the local seed system and its key players needs to be analysed in the context of assessing in what manner they contribute to on-farm management of Plant Genetic Resources for Food and Agriculture (PGRFA) (FAO, 1996; De Boef et al., Reference De Boef, Dempewolf, Byakweli and Engels2010; FAO, 2010).
Social seed network analysis
Subedi et al. (Reference Subedi, Chaudhary, Baniya, Rana, Tiwari, Rijal, Sthapit and Jarvis2003) studied social seed networks in order to understand flows of rice genetic material, enhance the knowledge associated with seed flows and identify related nodal farmers in Nepal. Based on their work, social seed network analysis was developed for analysing local seed systems. As a participatory tool, it complements many other methods that have their roots primarily in participatory rural appraisal (PRA), but that are nowadays applied in the context of (a) strategies for the implementation of on-farm management of PGRFA, within the context of in situ conservation and use; (b) participatory crop improvement (including participatory varietal selection (PVS) and participatory plant breeding); and (c) the promotion of seed sector development (De Boef and Thijssen, Reference De Boef and Thijssen2007).
The case of barley (Hordeum vulgare L.) in Tigray, Ethiopia
In Ethiopia, the population is highly dependent on agriculture characterized by low productivity. The local seed system plays a fundamental role, not only because of the limited capacity of the formal system, but primarily because of the diverse nature and structure of agriculture (McQuire, Reference McQuire2007; Bishaw et al., Reference Bishaw, Sahlu, Simane, Thijssen, Bishaw, Beshir and De Boef2008). Tigray is one of the major barley-growing regions. Abay et al. (Reference Abay, Waters-Bayer and Bjørnstad2008) show that despite significant efforts in formal barley breeding, local varieties and the local seed system have remained dominant. The annual barley seed requirement is primarily met with seed produced, saved and exchanged by farmers. Similarly, practices exist for most other food (cereal, pulse and oil) crops in the region, given the dominance of the informal seed system in Ethiopia (Bishaw et al., Reference Bishaw, Sahlu, Simane, Thijssen, Bishaw, Beshir and De Boef2008). Research conducted by the barley breeding programme of Mekelle University revealed that local varieties outperformed introduced (improved) varieties (Abay and Bjørnstad, Reference Abay and Bjørnstad2009). As a result, researchers of Mekelle University expressed an interest to further understand the functioning of seed flows. This study builds on the work carried out for social seed network analysis in Nepal (Subedi et al., Reference Subedi, Chaudhary, Baniya, Rana, Tiwari, Rijal, Sthapit and Jarvis2003; Poudel et al., Reference Poudel, Sthapit and Shrestha2009); documents flows of barley seed within and among communities; identifies nodal and connector farmers within the seed networks; and characterizes the seed networks in seven villages, in barley-growing areas in Tigray. Its integrated application in the context of conservation, breeding and seed sector development is critical. The objective of the study was to examine the application of ‘social seed network analysis’ to (a) support strategies that contribute to the implementation of on-management of PGRFA through farmer conservation and use; (b) strengthen the effectiveness of strategies that contribute to crop improvement, including PVS; and (c) design strategies that promote local seed sector development as a means of enhancing seed security and promoting the dissemination of superior varieties.
Materials and methods
Preparation
Three activities preceded the seed survey, which was carried out at household level. First, regional and district agricultural officials were consulted to assist the selection of study districts. Secondly, a PRA was completed in order to understand the importance of barley in those districts. Thirdly, key informants were interviewed, and focus group discussions (FGD) were conducted to document the knowledge and obtain basic data on the local seed system.
Study sites
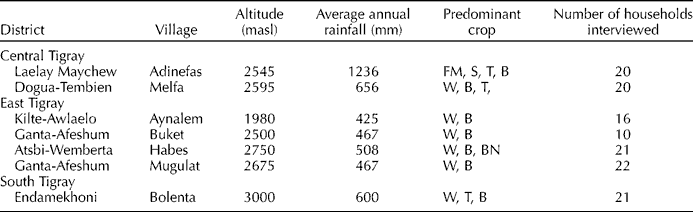
Districts were identified based on their importance in barley production, agroecology and barley consumption preferences. One village was randomly selected from each district. Table 1 provides some background information on the study sites.
Characterization of study sites for analysing social seed networks, Tigray, Ethiopia, 2008

masl, metres above sea level; B, barley; BN, beans; FM, finger millet; S, sorghum; T, tef; W, wheat.
Household seed system survey
The survey included approximately 20 farmer households per village, which were randomly selected from the seven villages (Table 1). The household interviews were conducted in the local language, Tigrigna, by the first author, acting as principal researcher, and her students from Mekelle University. The survey included the following key questions: (a) From whom do you usually get barley seed? (b) From whom did you obtain barley seed during the last growing season? (c) To whom do you usually provide seed? (d) To whom did you give seeds during the last growing season? and (e) Who usually asks you for seed?
Seed source data analysis
The collected data were recorded in Microsoft Excel. Initially, they were analysed to characterize the seed flows within and beyond villages, with further differentiation for seed sources such as own, neighbours, relatives and markets. In cases where the exchange was both within and outside the village, seed sources were further characterized as exchanges with relatives, purchased from markets or as loans. Seed sources for distinct varieties were also recorded and disaggregated.
Seed network data analysis
For seed network analysis and mapping, the data collected through the survey were coded and transformed into VNA data format. Descriptive statistics and social network analysis were performed using NetDraw, version 2.41 (Borgatti, Reference Borgatti2005). The households were considered as node data, while flows of seed and varieties (transactions) between households were treated as tie data. It should be realized that households beyond those included the survey are included in the analysis, as they could be sources of seed of the household that did participate in the survey. The seed and variety flows were coded to generate the numerical values in the analysis. The three measures of centrality outlined below were computed to estimate the importance of the households in the social network, using the NetDraw software. The respective formulas for the centrality measures are based on social network analysis by Wasserman and Faust (Reference Wasserman and Faust1994) and further adapted to social seed network analysis by Poudel et al. (Reference Poudel, Sthapit and Shrestha2009).
(1) Degree centrality measures the degree of connectivity of an individual household with others in the network. A high value indicates that the household has many direct connections with other households. Degree centrality facilitates the identification of households that act as nodes within the seed network; for its interpretation, both the measures and the network map are helpful.
(2) Betweenness centrality measures the relationship of a household with others, in terms of the position that it occupies in controlling or influencing flows within the network. A higher value means more indirect connections and greater impact on the network. Households with a high betweenness centrality play important roles in connecting members to others within the network; the measure facilitates the identification of households that are vital as connectors within the seed network. Similarly, for degree centrality, betweenness centrality can be interpreted by analysing the outcomes of the calculation and the network map.
(3) Harmonic closeness centrality measures the accessibility of an individual household, by the other members of the network. It measures the position of the household in the network; i.e. how close the household is to others in the network. The measure is an indicator of those households that provide access to seeds and varieties in the network; its use is meaningful when working with connected networks; for example, analysing seed or variety flows among communities or villages.
The assembly of centrality measures provides relevant and detailed information, which is often difficult to measure. It also generates information for assessing seed flows within the context of on-farm PGRFA management, PVS and local seed sector development. The measures can help conservationists to identify nodal and connecter farmers responsible for maintaining and introducing new materials, and those who are a reliable source of seeds of local varieties (Poudel et al., Reference Poudel, Sthapit and Shrestha2009). Within PVS, the information obtained through the measures is crucial for defining strategies and analysing the impact made by introducing research materials or new varieties, through mother baby trials for example (Snapp, Reference Snapp1999; Bänziger and De Meyer, Reference Bänziger, De Meyer, Cleveland and Soleri2002), and consequently, by assessing acceptance of those introduced materials and their respective flows through the networks. The measures may be useful support for local seed sector development by assessing patterns of seed flows and seeking ways in which to strengthen these flows by supporting the farmers engaged in either technical, organizational, marketing or commercial aspects (De Boef et al., Reference De Boef, Dempewolf, Byakweli and Engels2010).
Results
The data gathered through the household seed system survey provided information on the sources and flows for both seed and varieties. The seed network analysis used centrality data and the seed flow map to provide information on networks and seed flows within and between villages, and on the specific role of certain households within those networks and flows. The role of those households in the networks was then analysed to determine their potential contribution to on-farm management, PVS or local seed sector development.
Seed sources and flows
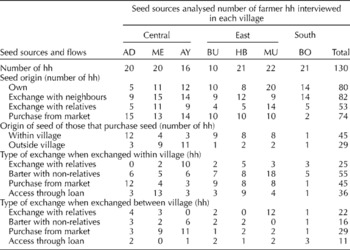
Farm-saved (own) seed was prominent in barley in all the villages. Most of the households that were interviewed used their own seed. In the villages Ayanalem, Buket and Mugulat, the principal source of seed for farmers was farm-saved, but not necessarily their own seed; neighbours were a key source. In Buket, all the households used seed obtained from the market, while in Mugulat, many farmers obtained seed from relatives. The village Adinefas was somewhat dissimilar to the others, since the principal seed source was the market, possibly due to the fact that the village often suffers drought conditions. Table 2 illustrates the multiple sources of seed used by farmers. A higher proportion of seed was purchased within the villages rather than from outside the villages, which may indicate the farmers' preference to purchase seed from local farmers or traders. The exchange of seed flows within the villages was mainly non-cash based. A major share of the respondent households indicated that they obtained seed through exchange with non-relatives within villages, whereas a much minor share of the farmers exchanged seed with relatives when obtaining seed with other villages. In Buket and Mugulat, the exchange of seed with non-relatives was much higher due to the farmers' need to renew or replace their seed every year, or every other year. The need to replace seed so frequently is due to problems that the farmers have with soil fertility and the fact that the soil quality is too poor for seed production. When analysing the seed flows between villages, it was observed that the sources were primarily through purchasing from the market or exchanging with relatives.
Barley seed sources analysed through social seed network analysis, in seven study villages, in three barley-growing zones in Tigray, Ethiopia, 2008

AD, Adinefas; ME, Melfa; AY, Aynalem; BU, Buket; HB, Habes; MU, Mulugat; BO, Bolenta; hh, household.
Flows and sources of varieties
The seed sources, and consequently the flows, were analysed as flows of varieties. Table S1 of the supplementary material (available online only at http://journals.cambridge.org) illustrates the demand for specific barley varieties as expressed by the respondents in the survey. Respondents indicated that they obtain seed of the variety ‘Saesa’ from their neighbours, relatives and markets. For other popular varieties, ‘Burguda’ and ‘Guanaza’, the frequency with which the varieties are exchanged is much lower than ‘Seasa’. From the 35 respondents who cultivated ‘Burguda’, 13 exchanged the variety with relatives, while nine exchanged the variety with neighbours. The table also shows that for a number of varieties, farmers used multiple seed sources. Since demand was dominated by the popular variety ‘Saesa’, the supply for this variety was between 10 and 15% of the respondents who provided seed to neighbours, relatives and/or sold it through the market. For supply, the flow within the village was much more dominant, as illustrated in Table S2 of the supplementary material (available online only at http://journals.cambridge.org). Rare varieties appeared to be sourced from farms that maintain a broad variety portfolio. Abay et al. (Reference Abay, Waters-Bayer and Bjørnstad2008) found, for example, that barley varieties ‘Atsa’ and ‘Keyiho’ were mostly preferred and used in mixtures with other dominant varieties. It was observed that more seed was sourced (or purchased) in markets beyond the village for the varieties ‘Embaye’, ‘Hanfetz’ and ‘Keyiho’. The latter was only found in mixtures with other varieties of barley or wheat.
Analysis of centrality data
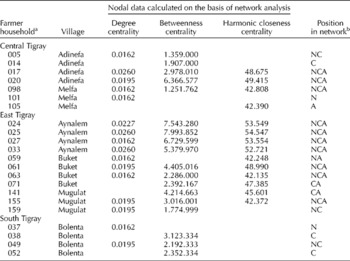
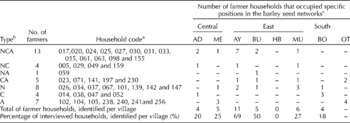
Based on the analysis of information gathered through the survey with the 130 respondents in the seven villages, a seed network analysis was conducted. Since additional households could also be indicated beyond the respondents, the network consisted a total of 303 members. Table 3 provides the measures for degree centrality, betweenness centrality and harmonic closeness centrality for those farmer households that take active roles either as nodal, connector and/or as access farmers, and combinations of those roles, within the seed network. Table 4 summarizes the characterization of farmer households and villages.
Characterization of the four most prominent farmer households that play active but dissimilar roles within the seed network and their nodal data calculated through social seed network analysis, in three barley-growing zones in Tigray, Ethiopia, 2008

a The number ‘017’ means the code for the household 017 in the data file.
b N, nodal farmer; C, connector farmer; A, access farmer; combinations such as NC means a farmer that is characterized as both nodal and connecter.
Characterization of farmer households and villages occupying the different position in the social seed network for barley, Tigray, Ethiopia, 2008

a The number ‘017’ means the code for the farmer household 017 in the data file.
b N, nodal farmer; C, connector farmer; A, access farmer; combinations such as NC means a farmer who is characterized as both nodal and connecter.
c AD, Adinefas (20); ME, Melfa (20); AY, Aynalem (16); BU, Buket (10); HB, Habes (21); MU, Mulugat (22); and BO, Bolenta (21). OT: other villages, with farmers connecting between or providing access to villages included in the seed network analysis.
When considering the farmers who scored for degree centrality, 26 members were found to have direct links with more than four members. These households could be considered nodal farmers (N) that carry a high level of importance for the seed flow. However, higher degree centrality shows only direct connectedness within the networks, not the connections between the networks or subnetworks. Among those 26 nodal farmers, 17 households could be characterized as connectors (NC, nodal and connector farmer). These households were also connected with other members of the network, occupying positions between networks, and with access to the seed of non-interviewed network members, either directly or indirectly. The farmers with a high degree centrality combined with betweenness centrality could be considered a resource for other farmers to acquire the seed in the network. Thirteen households could be characterized as NCA farmers (NCA, nodal, connector and access farmer). Most interestingly, seven of these NCA farmers were found in the village Aynalem, namely farmers with the following codes ‘024’, ‘025’ and ‘033’. These farmers scored high for all three measures. In other villages, a few more NCA farmers were identified, namely ‘020’ in Adinefa, ‘061’ in Buket and ‘155’ in Mugulat. Although most of the households with high closeness centrality were also found to occupy nodal positions (N), and demonstrated better connections (C), some households such as ‘102’, ‘104’ and ‘105’ in Melfa only occupied positions that supported access within the network and as such were important for the seed flow in the community. Non-respondent network members were identified either as farmers who were both connectors and also provided access or as farmers who solely provided access. This is logical since the farmers were indicated as seed sources by those households that participated in the survey (Table 3). Another important observation to be made based on Table 3 is that in Habes, none of the households interviewed appeared to take key positions in the seed network.
Analysis of network map
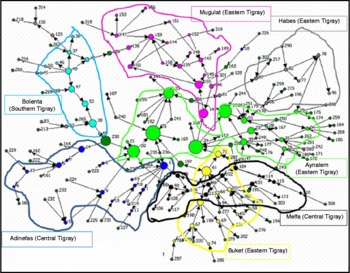
The network map obtained from the social network analysis is presented in Fig. 1. It shows the map based on the degree centrality and is useful for identifying nodal farmers and characterizing seed flows. The size of the node denotes the degree centrality of the households; those with a large dot are more important as nodes, as they are connected with more network members. Figure 1 confirms the previously mentioned results that showed the high incidence of nodal farmers in Aynalem; six of its members play central roles in the network. The differences between the villages are clearer, where some members, for example in Buket and Mugulat, show many connections, while others, for example Bolenta and Melfa, indicate seed flows but with less direct and indirect connections. The figure further verifies the specific position of Habes, where farmers to some degree are connected but where none of them can be characterized as nodal farmer. The overlapping seed flow of Buket and Melfa villages could be due to the linkages introduced through the PVS project of Mekelle University and development interventions and exposure visits by Adigrat Diocesan Catholic Secretariat, an non-governmental organisation operating in both villages.
Farmers' social seed networks showing the degree centrality of farmers and villages based on data gathered through a seed flow questionnaire in three barley-growing zones in Tigray, Ethiopia, 2008 (n = 7 villages; 130 households). Colour represents the following villages:  , Adinefas (Central Tigray); ●, Melfa (Central Tigray);
 , Aynalem (Eastern Tigray);
 , Buket (Eastern Tigray);
 , Habes (Eastern Tigray);
 , Mugulat (Eastern Tigray);
 , Bolenta (Southern Tigray);
 , other villages. The number represents the code for the household in the data file; node size is an indication for the degree centrality of the household; and arrows indicate the direction of the seed flow. A colour version of this figure can be found online at journals.cambridge.org/pgr.

Discussion
Characterization of seed network members
The characterization of members in seed networks using measures of centrality provides detailed information on the role that those farmers play in the network, and as such on their potential contribution to conservation, crop improvement and seed business development. A farmer with a high degree centrality may not have high betweenness centrality or closeness centrality or vice versa. Therefore, farmers need to be characterized as nodes, access providers, connectors or combinations of the same. The reality can be simple, as farmers play straightforward roles in seed networks. Understanding their role will help us to be more effective in conservation, breeding or seed interventions. Social seed network analysis provides such details, and farmers can be approached in a more appropriate manner for various different purposes. Understanding the farmers' position in seed networks can be useful for the design of interventions or strategies targeting conservation, participatory crop improvement, variety and seed dissemination, and seed business development.
On-farm PGRFA management
Social seed network analysis is important for studying local seed systems in the context of conservation of PGRFA. Understanding the patterns of exchange and flows of seed within and among communities, and identifying nodal and connector farmers within seed networks, are critical for the design and implementation of strategies that target on-farm PGRFA management (Sthapit et al., Reference Sthapit, Shrestha, Subedi, Shrestha, Upadhyay, Eyzaguirre, Thijssen, Bishaw, Beshir and De Boef2008). This understanding will contribute to the integration of a genetic resource and livelihood perspective for strengthening local seed systems (De Boef et al., Reference De Boef, Dempewolf, Byakweli and Engels2010). Farmer seed management consists of the selection of varieties and seed for the next planting season, and for seed storage, transfer, exchange or mixtures (Bellon et al., Reference Bellon, Berthaud, Smale, Aguirre, Taba, Aragón, Díaz and Castro1997; Smale and Bellon, Reference Smale, Bellon, Wood and Lenné1999; Hodgkin et al., Reference Hodgkin, Rana, Tuxill, Balma, Subedi, Mar, Karamura, Valdivia, Collado, Latournerie, Sadiki, Sawadogo, Brown, Jarvis, Jarvis, Padoch and Cooper2007). Nodal farmers in the community networks are vital for maintaining crop diversity on-farm and managing the processes involved in it (Subedi et al., Reference Subedi, Chaudhary, Baniya, Rana, Tiwari, Rijal, Sthapit and Jarvis2003). Farmers with a high betweenness centrality connect the other members, or subnetwork, in the community and promote flow of seeds. Such farmers connect two or more subnetworks that are not directly connected through other farmers. However, these farmers are often also fragile as connectors; the links could be disrupted if those farmers discontinue with farming, migrate to other places, or if they do not have a successor. One such example can be seen in the analysis conducted in Tigray, in household ‘025’, which links three major networks in the map. This household plays a vital role as connector; however, if this household were to discontinue its role, three networks would be fragmented, thus weakening the overall functioning of the seed network. The tool, when embedded within a larger context of community biodiversity management (Sthapit et al., Reference Sthapit, Shrestha, Subedi, Shrestha, Upadhyay, Eyzaguirre, Thijssen, Bishaw, Beshir and De Boef2008), or on-farm PGRFA management, may serve for communities to recognize this weak point. FGD with the farmers in Habes, which was identified to be vulnerable in its seed network with few nodal and connector farmers, in the follow-up local seed business project (LSB) that started in 2009, revealed that the farming community wants to form community seed banks. It planned to do this by collecting the seed of every crop and variety that the members have in their possession and identifying those varieties that are becoming rare at the community level. The reason why they want to do this is because they think that the varieties are in danger of extinction, owing to changes in agriculture and the introduction of new varieties and other crops. Herewith the community members in this village gave follow-up in practices to the results of the social seed network analysis. The community members explained that varieties differ in quality attributes such as taste, texture, colour, use, smell, medicinal properties or even cultural associations; farmers appreciate this variation in attributes. Through these kinds of locally initiated and autonomous innovations, and with some formal support, farming communities that become knowledgeable of the seed networks are members of. They can take the necessary steps to maintain varieties in their locality. Herewith the tool contributes to building collective action in ensuring facilitating seed flows, thereby creating a (new) collective basis for supporting the seed network, herewith adding a required collective basis to sustain the seed network (Badstue et al., Reference Badstue, Bellon, Berthaud, Juárez, Manuel Rosas, Solano and Ramírez2006). Consequently, social seed network analysis becomes a practical and participatory tool for farming communities taking conscious and collective actions that contribute to on-farm management of PGRFA within their local seed systems (FAO, 1996; FAO, 2010).
Households that occupy key positions in the network are important for seed flows and for genetic resource conservation. Therefore, one way of contributing to on-farm PGRFA management is to stabilize seed flows or support key farmers in the network. Such support could be given by providing training on seed production and management, by increasing access to genetic materials or by providing information. Other measures could include creating awareness on the value of local varieties among the key farmers or providing economic incentives in seed supply (De Boef et al., Reference De Boef, Dempewolf, Byakweli and Engels2010). Social seed network analysis is instrumental in locating those farmers who occupy critical positions in communities as nodes, using high levels of diversity; as access providers, being important sources of seed for others; or as connecters, linking communities. Such farmers can be identified, and their awareness or recognition of their critical role could be enhanced, or specific actions could be initiated to strengthen their position, as a means to contributing to on-farm PGRFA management. It is clear that those interventions target the use of local varieties and their dissemination within the community, and in a direct manner, they strengthen on-farm management as a strategy contributing to in situ conservation of PGRFA.
PVS
Social seed network analysis supports collaboration between farmers and plant breeders by identifying those farmers who play key roles in seed networks. Such farmers are critical in sharing information relevant for selection and are in a crucial position for boosting dissemination. Identifying farmers as partners in plant breeding is a critical step towards effective PVS. Farmers who can be identified as nodes, access providers and/or connector farmers will be important actors in deploying new varieties, and this is a second argument in favour of involving them. PVS, mother–baby trials in particular, is not only a tool for identifying well-adapted varieties (PVS), but is also a strategy to speed up the dissemination of new materials through the farmer seed system (Witcombe et al., Reference Witcombe, Joshi and Joshi1996, Snapp, Reference Snapp1999, Bänziger and De Meyer, Reference Bänziger, De Meyer, Cleveland and Soleri2002; Ashby, Reference Ashby, Ceccarelli, Guimarães and Weltzien2009). Herewith, the use of social seed networks in the context of PVS could be a critical instrument to speed up variety deployment as means to contribute to climate adaptation. PVS should not be treated in isolation; it needs to be well embedded in strategies that support local seed systems (Almekinders et al., Reference Almekinders, Thiele and Daniel2006; Bishaw and Turner, Reference Bishaw and Turner2008). Not only does social seed network analysis provide information on farmers that may act as partners in selection, but it also provides inputs in embedding crop improvement in seed supply. Varieties that are disseminated upon testing through PVS appear to adapt across farms, in the target environments (Atlin et al., Reference Atlin, Paris, Courtois, Bellon and Reeves2002). The involvement of farmers in the voluntary testing of varieties is an important step for testing adaptability. Once farmers adapt varieties tested through PVS, they can be easily distributed from farmer to farmer (e.g. in the case of prevalently autogamous crops, farmers in the neighbouring villages should request seed from the village where material was first tested). For example, seed from eight barley varieties was distributed to farmers through different channels, following PVS in Habes (Tigray), in 2004. Individual farmers were soon the main participants of varietal evaluation, as well as a seed producer group and village administrators, further disseminating the varieties to other farmers. By 2005, the varieties had spread up to 40 km from Habes. This seed flow following PVS indicates that seed of valued varieties was spread within and beyond the village. Since their involvement in the LSB project (2009), farmers in Habes have been engaged in the commercial production of barley varieties (both local and improved) that have been identified through PVS for the local market.
Increasing the effectiveness of dissemination
Seed flows can be between farmers within the same village or beyond the village, between villages, districts or regions. Local seed systems should be supported with formal seed, particularly to enhance access to new technologies. Of course, the networks operate when the farmers' supply and demand for seed of varieties is met, but a critical element remains the introduction of new materials. A common view is that a nodal farmer (a farmer with higher degree centrality) is important for the supply of seed materials within villages. However, their importance may be lessened if connected with farmers who are already well connected with other members. Connector farmers in the network, those who occupy key positions in connecting otherwise unconnected subnetworks, may be more strategic in disseminating materials. In order to be most effective in disseminating quality seed and in meeting the demand for improved and local varieties, social seed network analysis needs to find the right balance in identifying nodal and connector farmers. Moreover, understanding of seed flows through social seed network analysis can be a useful tool for designing strategies to respond to climate change.
Local seed sector development
Cash-based seed transactions within village markets indicate the presence of farmers who sell seed. The relative importance of seed purchase can vary and is influenced by seasons, household status and levels of production (David and Sperling, Reference David and Sperling1999). However, in related studies, we found that the high dependence on barley in the market is closely linked to the renewal and enhancement of rare varieties (Abay et al., Reference Abay, Waters-Bayer and Bjørnstad2008). This implies the sourcing of seed off-farm, not only when there are seed shortages, or when households are faced with seed insecurity. Social seed network analysis can assist in the identification of households or farmers, which can further strengthen the local seed systems. The analysis is also useful for designing interventions related to agricultural extension, seed dissemination and the development of seed businesses; these are ways to enhance the effectiveness of the informal seed network that may contribute to increasing seed security and climate change resilience.
The baseline study undertaken in 2009, in the LSB project, indicated that members of the newly established farmer producers' cooperative in Habes selected farmers to join according to the following criteria: ample and tangible experience in seed production; creativity in seed production; hardworking; commitment to work to contract, punctuality; ability to persuade others; and participation in social networks (Abay and Fitiwy, Reference Abay and Fitiwy2010; Kassa et al., Reference Kassa, Gessesse and Muruts2010). Such farmer-based organizations have good opportunities to flourish in locally based seed business. The LSB project supports the cooperative by providing training in leadership and organizational management. Most members have good local knowledge in the production of seeds. For example, one innovative female member of the cooperative multiplied several barley varieties, by informally collecting small amounts of seed from distinct places and multiplying them in her backyard. This woman now owns some of the best varieties in the area.
The seed producer cooperative receives technical assistance in seed production from rural extension services. In a nutshell, when some of the above prevailing conditions exist, as in the case of Habes, the particular capabilities and interests of farming communities can lead to the establishment of seed-producing cooperatives and the implementation of necessary interventions.
Social seed network analysis: final reflections on the tool
As a participatory and analytical tool, social seed network analysis increases the understanding of complex flow of seed and varieties within and among villages. Nodal and connector farmers can be identified, and more complex patterns of flows within and between villages can be visualized. The identification of nodal farmers is critical for the implementation of strategies that contribute to on-farm PGRFA management. The identification of connector farmers is a critical step towards revealing the more vulnerable links within the networks. In this way, specific interventions that aim to contribute to strengthening the networks can be designed, enhancing the vitality of the network or local seed system. It should, however, be realized that tool provides data that situated in time, and that it does not cover long-term insights in the continued role that farmers identified play. Herewith, a critical limitation of the current application of the tool is identified, with its relevance in particular for the design of strategies supporting on-farm management of PGRFA, but to a lesser degree for PVS, variety dissemination and LSB development. The application of the tool in three barley-growing zones in Tigray demonstrated that it is a valuable instrument for designing strategies to implement PVS, identifying key farmers to be approached for the selection and dissemination of improved varieties and for establishing ways to enforce informal systems through LSB development.
Acknowledgements
We would like to thank the Norwegian Programme for Development, Research and Higher Education for their support in financing the study. We thank also the Government of the Netherlands for their support of the LSB Project, from 2009 to 2012. We greatly appreciate the fundamental contribution made by farmers and stakeholders to the study, through their participation in the survey, interviews and several discussions. We are also very grateful to the students of Mekelle University who contributed to the study by conducting the interviews. Finally, we would like to thank Diwakar Poudel, of the Norwegian University of Life Sciences, for his efforts in introducing social seed network analysis so that we could apply the tool, following initial endeavours in Nepal and in Tigray, Ethiopia.