Introduction
In the northern hemisphere, most wild geese populations have shown increasing or stable trends over the past 10 years. Exceptions, however, are the “grey” geese Anser populations where 15 of 35 populations have declined, especially in East Asia. In China, four of the six wintering populations of grey geese are declining (Anser cygnoides, A. albifrons, A. erythropus, A. anser) while two populations (A. serrirostris and A. indicus) are currently considered stable (Fox and Leafloor Reference Fox and Leafloor2018). While A. indicus, commonly known as the Bar-headed Goose, is considered stable, in parts of its range significant increases have been recorded in the past decade (Liu et al. Reference Liu, Zhang, Li, Ma, Lu and Qian2017).
The Bar-headed Goose is endemic to Asia, breeding on the high plateaus of central Asia and wintering in China from southern Tibet east to Guizhou, and from Pakistan east to Myanmar (Miyabayashi and Mundkur Reference Miyabayashi and Mundkur1999). Within China, major wintering areas include south-central Tibet Autonomous Region (hereafter referred to as Tibet; Bishop et al. Reference Bishop, Yanling, Zhouma and Binyuan1997) and the Yunnan-Guizhou Plateau. The Bar-headed Goose wintering population in north-east Yunnan and western Guizhou provinces has increased slightly from 5,300 in 2005 (Yang Reference Yang, Li, Yang and Yang2005) to <7,200 in 2013 (Yang and Zhang Reference Yang and Zhang2014). In contrast, by 2014 wintering numbers of Bar-headed Geese in Tibet increased over sixfold since surveys first began in the early 1990s (Liu et al. Reference Liu, Zhang, Li, Ma, Lu and Qian2017).
Historical information on the distribution and abundance of Bar-headed Goose wintering in Tibet is scant and geographically limited to only a few locations of its currently known range (Appendix S1 in the online supplementary material). Socio-political instability and food shortages in Tibet during the late 1950s and early 1960s (Richardson Reference Richardson1962) as well as famine conditions in other parts of China during The Great Leap Forward (1958-1962; Dikötter Reference Dikötter2011) likely resulted in widespread hunting of wild game such as geese. In 1962 the People’s Republic of China issued administrative guidelines that included species for state protection because of their endangered status and banned indiscriminate hunting and mass-killing hunting gear (Li Reference Li2007). Nevertheless, hunting continued to be a problem throughout Tibet and the rest of China during the 1970s and 1980s (Lu Reference Lu, Moser and Prentice1993, Yeh Reference Yeh2009). Under the 1988 Wildlife Protection Law, Bar-headed Goose is protected within Tibet under a Class Two designation that allows their take only under special, permitted circumstances. Currently, illegal hunting appears to be minimal in Tibet, although poaching of waterfowl remains a concern throughout the rest of China (MaMing et al. Reference MaMing, Zhang, Blank, Ding and Zhao2012).
For this study, we conducted a series of winter surveys for Bar-headed Goose in south-central Tibet over 27 years, a period that coincided with rapid Bar-headed Goose population growth. We hypothesized that in addition to the cessation of hunting, the population growth of Bar-headed Goose is being driven by environmental conditions including agricultural land use patterns and climate change. Here we present results from our winter surveys and review studies on land use changes on the Tibet wintering grounds, studies of climate change on both the wintering and breeding grounds, and the establishment of protected areas. We discuss the potential influence of these factors on the growth of the Bar-headed Goose wintering population in Tibet.
Methods
Study area
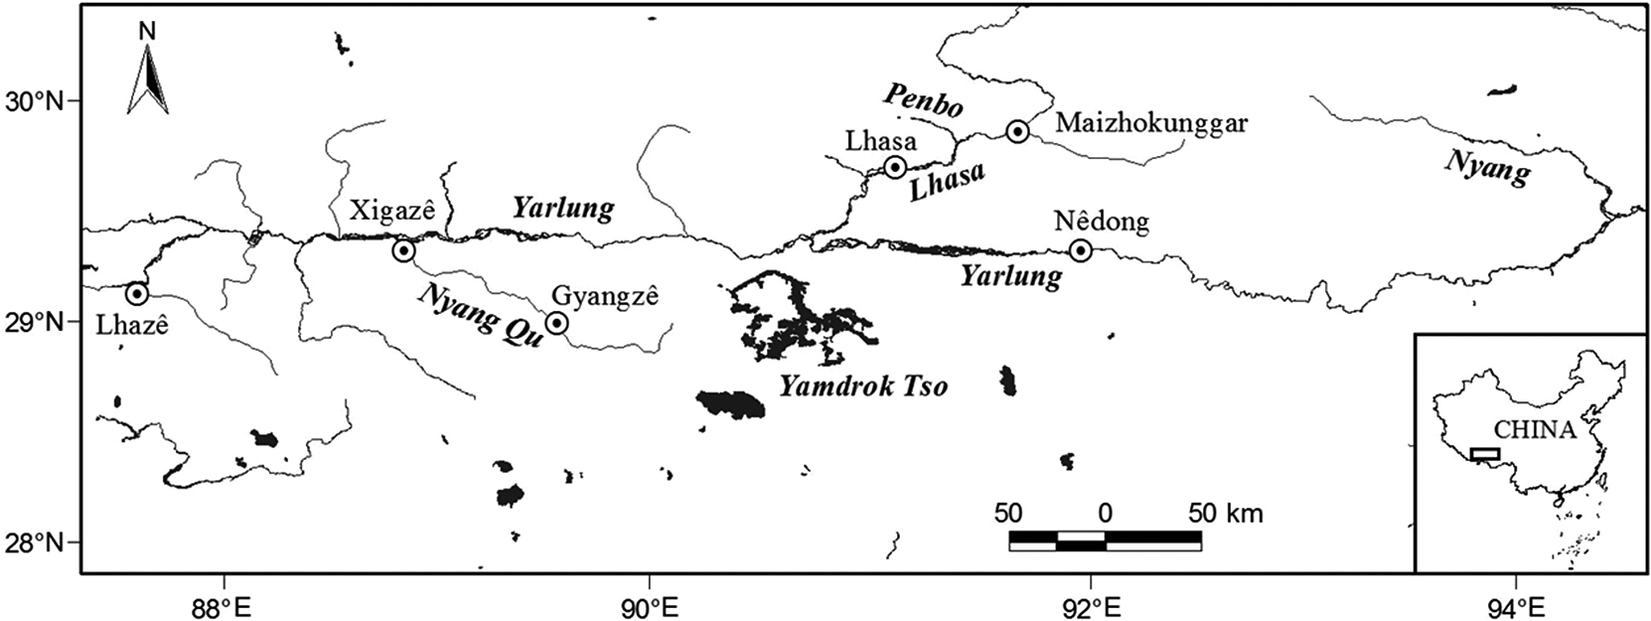
Our surveys took place in the middle reaches of the Brahmaputra River (Tibetan transliteration: Yarlung Tsangpo and hereafter referred to as Yarlung River; Fig. 1). Three major river valleys and their tributaries were included: Yarlung and Lhasa Rivers, and the Nyang Chu. For a description of these areas see Bishop et al. (Reference Bishop, Yanling, Zhouma and Binyuan1997). Our primary survey area stretched east from Lhazê (29°05'N, 87°36'E) to just east of Nêdong (29°15'N, 91°46'E) and north just past Maizhokunggar (29°57' N, 91°52'E). East of the primary survey area, we surveyed along the Nyang River to just past its confluence with the Yarlung River (29°25'N, 94°28’E) during three winters. In this paper, specific location and administrative division names are given in transliterated Ethnic Pinyin Tibetan taken from The University of Virginia USA Tibetan and Himalayan Library (THL) Gazetteer (http://places.thlib.org/ accessed 20 August 2020).
Location of important rivers and towns within the wintering grounds of the Bar-headed Goose, Tibet Autonomous Region, China.

Except for the major urban areas (Xigazê, Lhasa, and Nêdong), the river valleys of south-central Tibet are intensively cultivated and produce 55% of Tibet’s cereal production (Zhang et al. Reference Zhang, Dong, Zhou, Xu, Wang, Ouyang and Xiao2013). Historically barley Hordeum vulgare of the spring type (planted March–April and harvested August–September) has been the major grain cultivated, and to this day remains Tibet’s major food crop, occupying between 50% (Paltridge et al. Reference Paltridge, Tao, Unkovich, Bonamano, Gason, Grover, Wilkins, Tashi and Coventry2009) and 70% (Zeng et al. Reference Zeng, Long, Wang, Zhao, Tang, Huang, Wang, Xu, Mao, Deng and Yao2015) of croplands. Wheat Triticum aestivum is the other major crop and includes both spring wheat (planted March–April and harvested August–September) and winter wheat (planted in October and harvested August–September). Minor field crops include rapeseed Brassica rapa, B. napus, and B. juncea, field peas Pisum sativum, and tubers (potatoes Solanum tuberosum and turnips Raphanus sativus; Paltridge et al. Reference Paltridge, Tao, Unkovich, Bonamano, Gason, Grover, Wilkins, Tashi and Coventry2009). Approximately 65% of the cultivated lands are irrigated (Li et al. Reference Li, Tang, Luo, Di and Zhang2013) and are almost exclusively in bottomlands of river valleys.
Winters in south-central Tibet are cool and characterized by low precipitation (<10% of annual). Localized snowfall occurs infrequently and melts quickly. Average monthly minimum and maximum temperatures at Lhasa during January, the coldest month, are −10.1oC and 6.98oC, respectively (World Meteorological Association; http://worldweather.wmo.int/en/city.html?cityId=236; accessed 20 August 2020). The study area has a continental monsoon climate and an annual precipitation of 300–500 mm.
Goose surveys
We divided the study area (Figure 1) into two regions: western Yarlung River and its tributaries (87.3–90oE) and eastern Yarlung River and its tributaries (90.0–91.6oE). Two previous studies of satellite-tagged Bar-headed Geese (Prosser et al. Reference Prosser, Cui, Takekawa, Tang, Hou, Collins, Yan, Hill, Li, Li and Lei2011, Zhang et al. Reference Zhang, Liu, Hou, Jiang, Dai, Qian, Lu, Xing and Li2011) suggested there is little movement between these two regions. We surveyed the Bar-headed Goose population using cars on the available road access, driving primary roads through each valley and their major tributaries. We stopped to scan with a 22x telescope every 2–3 km in suitable habitat (agricultural fields, pastures, wetlands, reservoirs, and secondary river channels; Table S1) from any major vantage point, or whenever a flock was observed. Information collected on geese flocks included: location and flock size. During two winter surveys, habitat was recorded. For surveys through 2007, a single team of 3-4 observers was used (Bishop et al. Reference Bishop, Yanling, Zhouma and Binyuan1997). Beginning in 2009, two teams of four simultaneously surveyed the east and west regions of the study area (Liu et al. Reference Liu, Zhang, Li, Ma, Lu and Qian2017).
Because there have been no published demographic data for wild Bar-headed Goose, we fit an exponential annual growth rate (r) to the data from the 27-year study period (winters 1991/92 through to 2017/18). We also calculated an annual growth rate between consecutive surveys, except for the period 2007–2014 when the 2009 survey was not included in the rate calculation. Habitat use data were compared between the first 1992 survey and the penultimate 2014 survey.
Land cover and climate data
We did an extensive literature review of land use changes on the wintering grounds and climate change across the Tibetan Plateau and present the most important findings. Agricultural data were compiled from government sources (Bureau of Statistics of Tibet Autonomous Region 2019). Localized temperature anomalies for Lhasa were downloaded from National Oceanic and Atmospheric Administration (NOAA (2020)).
Results
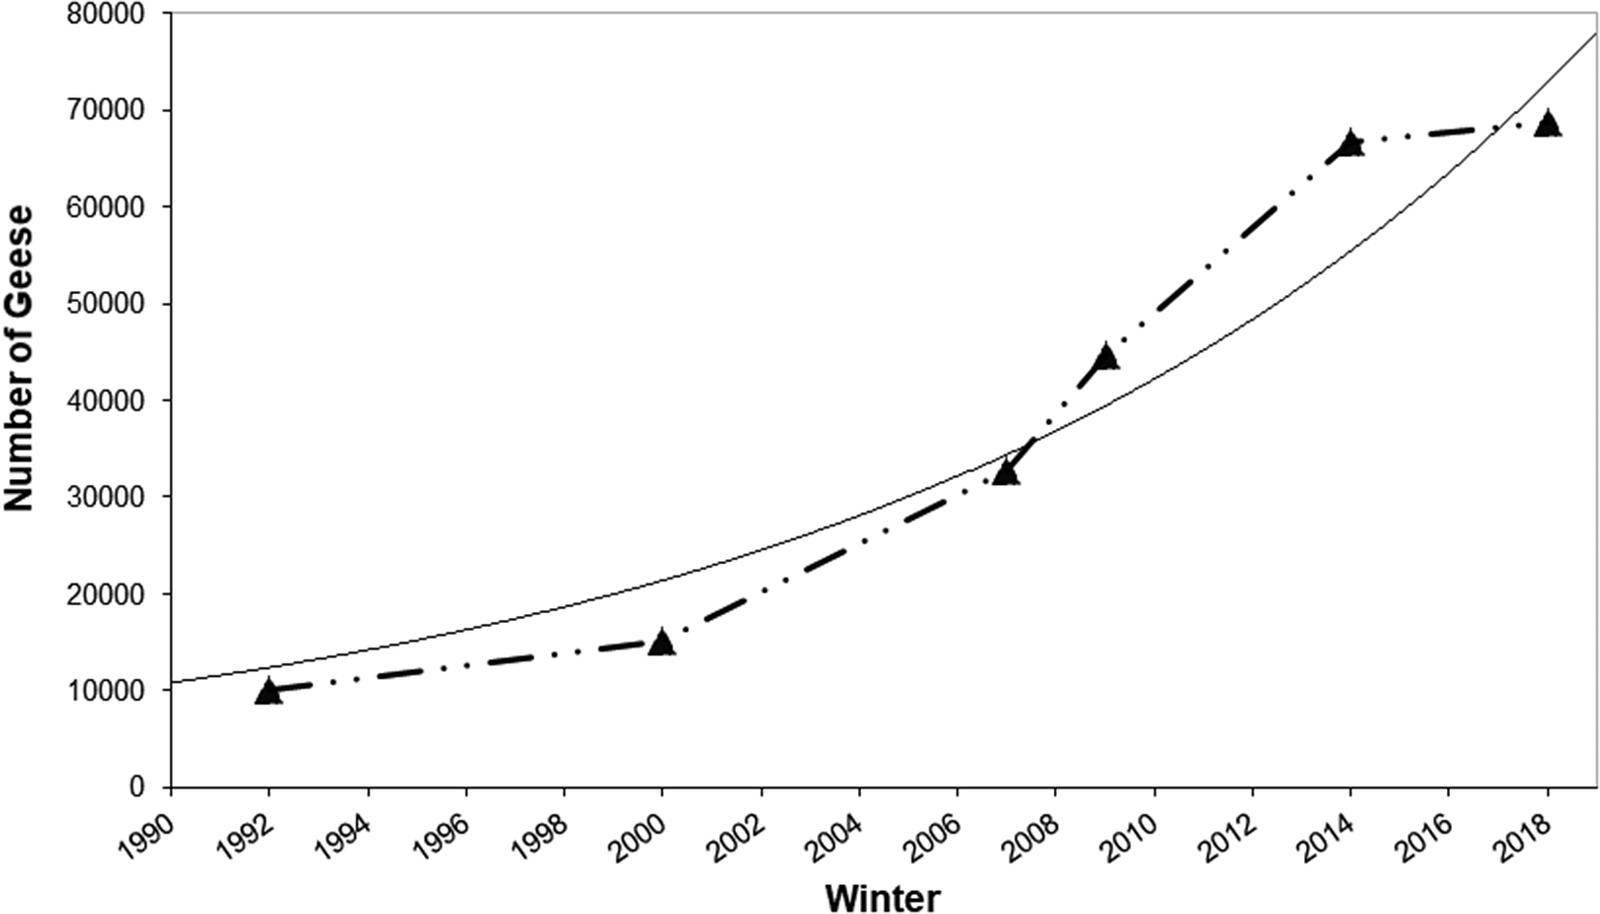
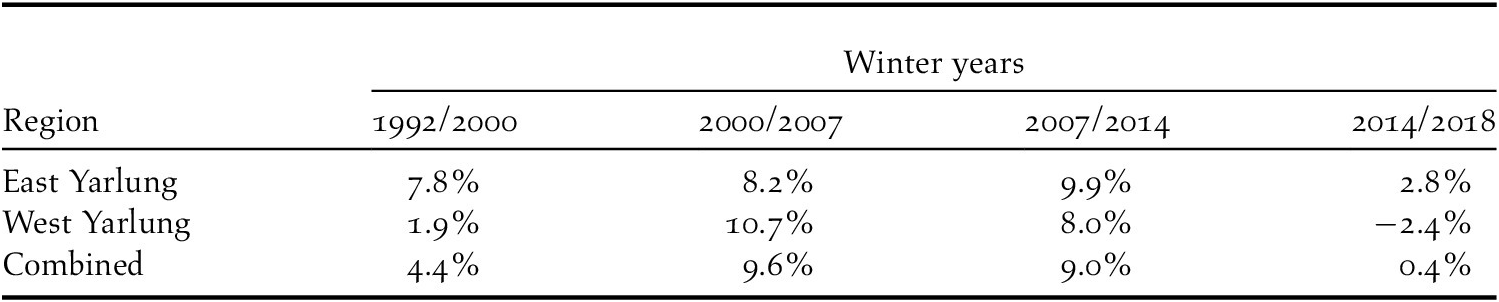
Six surveys were conducted between the 1991/1992 and 2017/2018 winters: December 1991–January 1992, December 1999, January 2007, 2009, and 2014, and December 2017. Over the 27-year period, the Bar-headed Goose population on the wintering grounds in Tibet increased from 10,086 to 68,102 individuals, an annual growth rate of 6.8% (Figure 2). Between consecutive surveys, the annual growth rate was 4.4% during the first nine winters (1991/1992 to 1999/2000). For the next 14 years, the growth rate more than doubled, but then showed very little annual growth (0.4%) across the final four winters (2013/2014 to 2017/2018) (Table 1).
Total numbers of Bar-headed Goose (triangles) by winter: 1991-92 through 2017-18, Tibet Autonomous Region, China. The fitted curve shows an annual growth rate of 6.8% across the 27-year period. Year on the x-axis corresponds to the previous-present year’s winter (e.g., 1992 refers to winter 1991-92).

Estimated annual growth rate between consecutive surveys and by region for the Bar-headed Goose wintering population in Tibet Autonomous Region, China. Winter year corresponds to the previous–present year ( i.e. 1992 refers to winter 1991/1992).

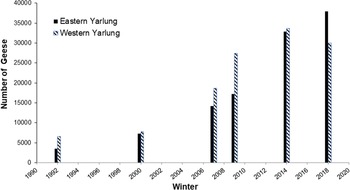
Of the two regions surveyed, the western Yarlung River consistently had the highest number of geese during the first five surveys, peaking at 33,688 before decreasing to 30,048 birds on the final, December 2017 survey. In the Eastern Yarlung region, the Bar-headed Goose annual population growth was consistently high from 1991/1992 through to 2013/2014 winters (range = 7.8–9.9%), and by our final 2017 survey, numbers for this region surpassed the Western Yarlung Region by >5,100 birds (Figure 3, Table 1). A small wintering population ranging from 30–302 geese was counted during the three surveys (winters 1999/2000, 2013/2014, and 2017/2018) of the Nyang/Yarlung rivers area.
Winter counts of Bar-headed Goose in Tibet Autonomous Region, China by region. Depending on the winter, counts were conducted between December and February. Year on the x-axis corresponds to the previous-present year’s winter (e.g., 1992 refers to winter 1991-92).

Comparing habitat use from the first (1991/1992) and fifth (2013/2014) surveys, the majority of geese observed were in croplands, 55.7% and 57.0%, respectively (Table S1). However, while crop stubble from harvested spring barley and spring wheat was used most often during the first 1991/1992 winter survey, by the 2013/2014 survey there was a distinct shift to geese foraging in autumn-planted winter wheat fields. Furthermore, while no observations of geese occurred in livestock pastures during the 1991/1992 survey, by the 2013/2014 winter pastures were used extensively by resting geese with >15% of the birds counted observed in this habitat (Table S1; Liu et al. Reference Liu, Zhang, Li, Ma, Lu and Qian2017).
Changes in land use on the Tibet wintering grounds
Our literature review found that major anthropogenic activities impacting land cover on the wintering grounds have included: a) loss of wetlands to croplands; b) recent policy shifts emphasizing livestock fodder; c) growth of vegetable production primarily in greenhouses; and d) urbanization around major cities. Ryavec (Reference Ryavec2001) compared land use for the years 1830 and 1990 over much of the Bar-headed Goose wintering grounds in Tibet using tax documents and satellite photos, respectively. Over the 160-year period, he found that the cultivated land area increased by 208% in the Lhasa region and by 105% in the Xigazê region. More recently, Li et al. (Reference Li, Wang and Zhang2017) examined cropland data and found that for years 1900–1950 and 1980–2000, cropland area and cover remained relatively stable. However, between 1950 and 1980 the cropland area in Tibet increased rapidly, with the Nyang Chu and Lhasa River valleys showing the greatest increases.
The 30-year period between 1950 and 1980 coincided with the establishment of government-operated communes and state farms, including around Gyangzê, Xigazê, Lhasa, and north-east of Lhasa in the Pengbochu River Valley. These collectives typically focused on reclamation of “wastelands” (including wetlands) to create fields for grain cultivation (Yeh Reference Yeh2003). Unfortunately, except for the Lhasa area where historical maps exist that identify wetlands (cf Waddell Reference Waddell1905), loss of wetlands in specific areas during the past century is difficult to quantify. Nevertheless, riverine wetlands composed of sedges (primarily Kobresia and Carex spp.) and Gramineae remain widely distributed along the Lhasa River, both north and south of the city of Lhasa, as well as along the Pengbochu River. In addition, there are relatively large expanses of wet meadows dominated by Kobresia humilis, K. littledalei and Carex moorcroftii in the Pengbochu River Valley (Lhünzhub County) and Dagzê District (Zhang et al. Reference Zhang, Wang, Bai, Wang, Tu and Yangjaen2010).
Land use changes in Tibet have continued to be driven by policy changes at the national level. While animal husbandry accounted for 2/3 of the agricultural output in Tibet before 1980, this fell to less than half in the 1990s in response to policies aimed at increasing grain production (Brown and Waldron Reference Brown and Waldron2013). Except for the major urban areas (Xigazê, Lhasa, and Nêdong), the river valleys of south-central Tibet including the Yarlung, Nyang Qu, Lhasa and their tributaries (Figure 1) are intensively cultivated and produce 55% of Tibet’s cereal production (Zhang et al. Reference Zhang, Dong, Zhou, Xu, Wang, Ouyang and Xiao2013). More recently there has been a shift in emphasis and financial incentives from cereal production back to livestock production. China’s 11th Five-year Plan (2005–2009) emphasized development of livestock production, resulting in a dramatic rise in the cultivation of fodder crops. Concurrently, the sown area of grain crops in Tibet dropped from 87% in 2000 to 71% in 2010 (Brown and Waldron Reference Brown and Waldron2013).
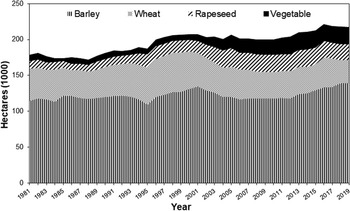
Within Tibet, vegetable cropping has steadily increased from <2.0% in 1985 of the major food crops sown to an annual average of 11. 0% since 2010 (Bureau of Statistics of Tibet Autonomous Region 2019), resulting from the policy of poverty alleviation (Figure 4). Around Xigazê City and Xietongmen County, both in the western Yarlung region of the study area, hectares of vegetables increased from less than 2% of all croplands in 1999 to more than 20% of all croplands by 2007 (Xigazê Prefecture Agriculture and Livestock Husbandry Bureau pers. comm. 2008). While vegetable crops such as potatoes are grown in open fields, much of the vegetable cropping in Tibet now occurs in greenhouses. Over the past two decades greenhouse vegetable cropping has become a highly visible presence throughout the wintering grounds, especially around the major cities of Lhasa and Xigazê, and along the eastern Yarlung region of the study area from Konggar to Nêdong.
Sown area (1,000 ha) of major food crops in Tibet Autonomous Region, China, 1981-2019. Data from Bureau of Statistics of Tibet Autonomous Region, 2019.

Around Tibet’s two largest cities, Lhasa and Xigazê, there has been a conspicuous loss of agricultural lands due to urbanization. While no published studies on habitat changes are available for Xigazê, at Lhasa the most rapid land use change by percentage has been development of lands for buildings During the 7-year period from 2000 to 2007, the City of Lhasa expanded by over 50%, from 3186.7 hm2 to 4819.1 hm2 (Chu et al. Reference Chu, Zhang, Bianba and Liu2010).
Establishment of nature reserves
The early 1990s marked the creation of the Pengbo Black-necked Crane Reserve, the first nature reserve on Bar-headed Goose wintering grounds in Tibet. Encompassing two large reservoirs (Hutou and Karzê) and agricultural lands in Lhünzhub County’s Pengbochu River Valley (Bishop and Tsamchu Reference Bishop, Tsamchu, Wang and Li2005), this reserve protects one of the most important Bar-headed Goose wintering areas (Bishop et al. Reference Bishop, Yanling, Zhouma and Binyuan1997). Ten years later, the Tibet Autonomous Regional Government established the 6,143 km2 Yarlung Zangbo River Middle Reaches Black-necked Crane Nature Reserve (Forestry Administration of Tibet Autonomous Region 2004). As well as expanding the protected area in the Pengbochu Valley, the new reserve includes portions of the Lhasa River from Dagzê to Maizhokunggar, portions of Yamdrok Tso Lake, and lands along the western Yarlung River and some of its tributaries. All areas included in the reserve are known Bar-headed Goose wintering grounds.
Although in recent times <500 Bar-headed Geese have been recorded within the city of Lhasa (Farrington Reference Farrington2016), two areas regularly attract wintering birds. The 6.2 km2 Lhalu Wetland was first designated a regional nature reserve in 1995 and was the focus of an intense wetland restoration project in the early 2000s. In 2005, Lhalu was promoted to the status of a national nature reserve (Lang et al. Reference Lang, Bishop and Le Sueur2007) and that same year an estimated 200, 18-month-old captive-reared Bar-headed Geese were released in the reserve (Feare et al. Reference Feare, Kato and Thomas2010). While not a nature reserve, Lhukang Park, on the north side of the Potala Palace hosts hundreds of Bar-headed Geese on a small lake where supplemental feeding by the public is allowed throughout the winter.
On the Bar-headed Goose breeding grounds within China, more than six national nature reserves have been created since the 1980s, including Chang Tang National Nature Reserve in Tibet (334,000 km2; established 1993), and Sanjiangyuan National Nature Reserve in Qinghai Province (152,300 km2; established 2000). Two national nature reserves on Bar-headed Goose breeding grounds where surveys have been conducted include Altun Shan in Xinjiang Uyghur Autonomous Region (15,4000 geese; Zhang et al. Reference Zhang, Ma, Ding, Xu, Li, Zhang and Zhang2012) and Qinghai Lake in Qinghai Province (˜6,000 geese; Zhang et al. Reference Zhang, Hao, Lei, Xing, Hou and Luo2009, Zeng et al. Reference Zeng, Zhang, Wen, Li, Duo and Lei2017), highlighting the importance of these reserves to the world’s Bar-headed Goose population.
Climate change impacts on wintering and breeding grounds
Increasing Temperatures
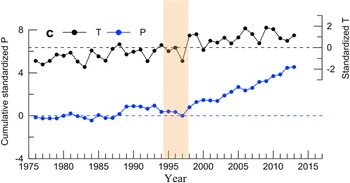
Between 1976 and 2013 the Tibetan Plateau experienced significant warming trend of 0.40 + 0.05oC per decade with both seasonal and regional differences. Importantly, there was a climate regime shift in 1998 after which the Plateau was much warmer and wetter (Figure 5; Zhang et al. Reference Zhang, Yao, Piao, Bolch, Xie, Chen, Gao, O’Reilly, Shum, Yang and Yi2017). Among the seasons, rates of fall and winter warming (> 0.2oC per decade) have been significantly faster than spring and summer seasons. Based on IPCC climate models, the plateau’s mean annual temperature is expected to increase by 2.6–5.2 oC by 2100 (Chen et al. Reference Chen, Zhu, Peng, Wu, Wang, Fang, Gao, Zhu, Yang, Tian and Kang2013). Regionally, the northern part of the Tibetan Plateau has exhibited increased temperature rates as high as 0.08oC/y (Chen et al. Reference Chen, Zhu, Peng, Wu, Wang, Fang, Gao, Zhu, Yang, Tian and Kang2013). In the headwaters of the Yangtze and Yellow river basins, both areas where Bar-headed Goose breed, mean temperatures increased by 0.37–0.45oC/10 y between 1960 and 2005 with the most dramatic increase, 1.2–1.6oC, taking place between 1981 and 2005 (Wang et al. Reference Wang, Bai, Li and Hu2011).
Standardized temperature (T; top line) and cumulative standardized precipitation (P; bottom line) from available China Meteorological Administration (CMA) stations on the Tibetan Plateau during the period 1976-2013. Reprinted with permission from Zhang et al. Reference Zhang, Yao, Piao, Bolch, Xie, Chen, Gao, O’Reilly, Shum, Yang and Yi2017, Figure 3c.

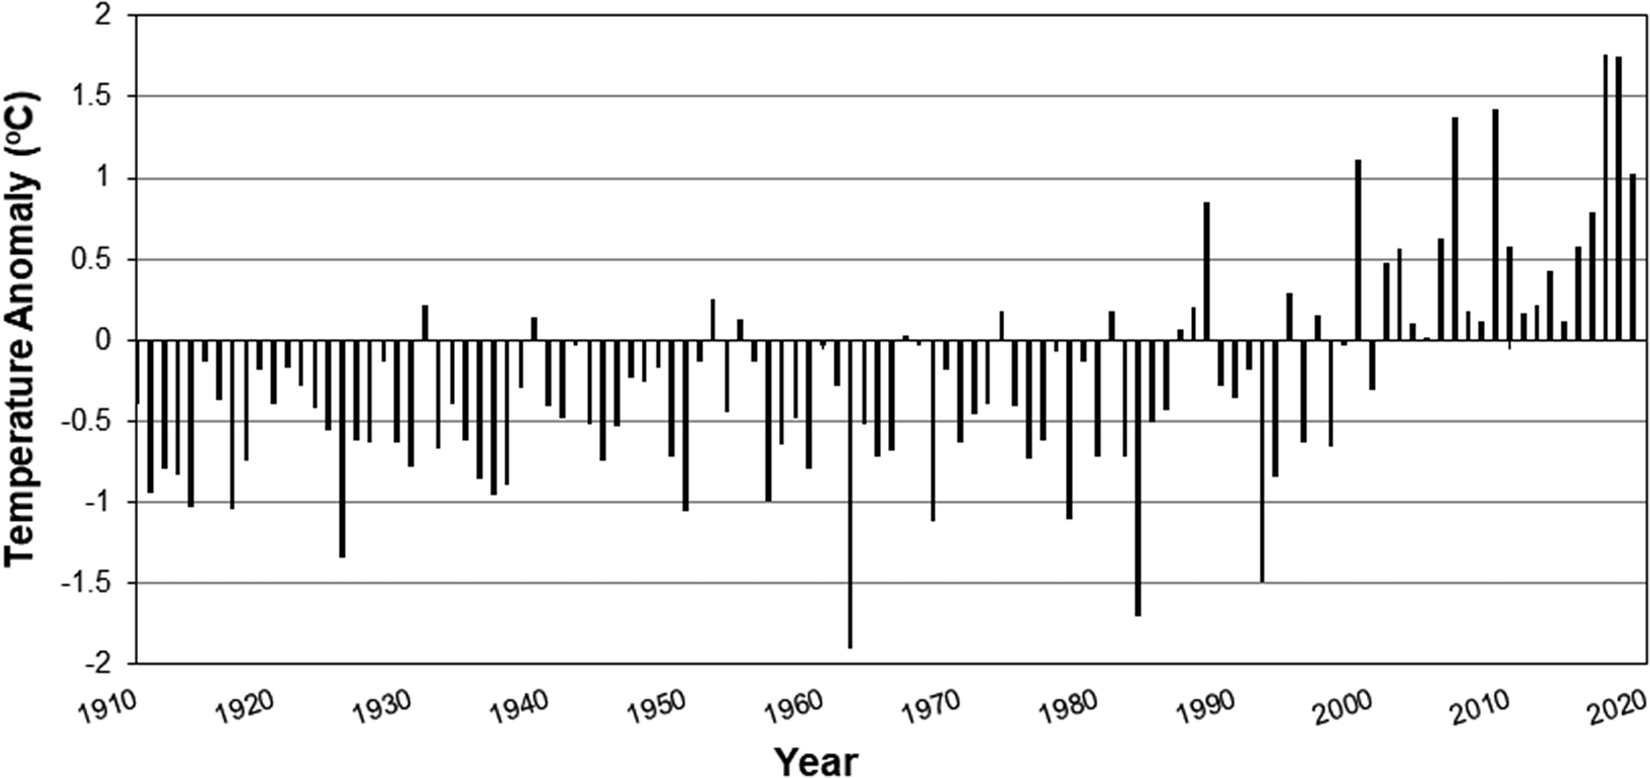
On the Tibet wintering grounds, winter temperatures in the Yarlung River basin have also been steadily rising. Between 1961 and 2014 the average winter (December–February) minimum temperature increased at a rate of 0.56°C/10 y while average winter maximum temperatures increased at a rate of 0.26°C/10 y (Li et al. Reference Li, Zhou, Zhao, Ju, Yu, Liang and Acharya2015). Mean seasonal temperatures increased fastest around the city of Lhasa (You et al. Reference You, Kang, Wu and Yan2007), where mean average winter temperatures increased 0.27°C/10 y since 1960 (Figure 6).
Annual temperature anomalies (oC) at Lhasa, Tibet Autonomous Region, China for December through February, 1910-2020. Data from National Oceanic and Atmospheric Administration (NOAA 2020).

Expansion of lakes on the breeding grounds
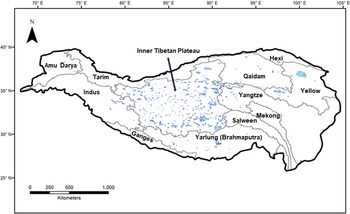
Bar-headed Goose breed and moult primarily on freshwater, brackish, and saline lakes as well as in shallow wetlands (Batbayar et al. Reference Batbayar, Takekawa, Natsagdorj, Spragens and Xiao2014, Zhang et al. Reference Zhang, Liu, Jiang, Zhang, Zhao, Kang, Liang and Qian2015, Takekawa et al. Reference Takekawa, Palm, Prosser, Hawkes, Batbayar, Balachandran, Luo, Xiao, Newman, Prins and Namgail2017, Zeng et al. Reference Zeng, Zhang, Wen, Li, Duo and Lei2017, Luo et al. Reference Luo, Wan, Ma, Yang, Se and Jia2020). The Tibetan Plateau has the highest concentration of high-altitude inland lakes in the world including ˜31,600 lakes <1 km2 (Lei and Yang Reference Lei and Yang2017), and between 1,171 (Wan et al. Reference Wan, Long, Hong, Ma, Yuan, Xiao, Duan, Han and Gu2016) and 1,291(Mao et al. Reference Mao, Wang, Yang, Li, Thompson, Li, Song, Chen, Gao and Wu2018) lakes >1 km2. Among the major river basins on the Tibetan Plateau, the Inner Tibetan Plateau, an endorheic basin, contains the majority of lakes >1 km2 (Figure 7).
Distribution of lakes >10 km2 on the Tibetan Plateau by major basins, 2005. Both the number and area of lakes have been expanding rapidly since 1998. There are 284 lakes 10-100 km2 and 90 lakes >100 km2. Not shown are the >700 lakes 1-10 km2. Figure adapted from Wan et al. Reference Wan, Long, Hong, Ma, Yuan, Xiao, Duan, Han and Gu2016 (http://creativecommons.org/licenses/by/4.0/).

One significant outcome since the 1998 climate regime shift has been the appearance of new lakes, especially in the Inner Tibetan Plateau (Zhang et al. Reference Zhang, Yao, Piao, Bolch, Xie, Chen, Gao, O’Reilly, Shum, Yang and Yi2017), as well as changes in the water level and/or surface area of historical lakes on the Tibetan Plateau. Mao et al. (Reference Mao, Wang, Yang, Li, Thompson, Li, Song, Chen, Gao and Wu2018) estimated that between the years 1977 and 2014, the total number of lakes >1 km2 increased from 1,056 to 1,291 (22%), and the total lake area from 38,951 km2 to 46,264 km2 (19%). However, while lake areas have increased, wetland habitats have been lost. From 1990 to 2006, lake wetlands and marsh wetlands over the entire Tibetan Plateau decreased by 1.3 million ha and 74,200 ha, respectively (Xing et al. Reference Xing, Jiang, Qiao and Li2010).
North of the Tibetan Plateau, Bar-headed Goose also breed in lakes across the Mongolian plateau. In contrast to the Tibetan Plateau, on the Mongolian Plateau over 208 lakes have disappeared and 75% of the remaining lakes have shrunk between 1970 and 2013 (Zhang et al. Reference Zhang, Yao, Piao, Bolch, Xie, Chen, Gao, O’Reilly, Shum, Yang and Yi2017). These losses in lake numbers and area have intensified since 1998 and are due to warmer temperatures as well as precipitation reductions associated with a poleward shift of westerlies (Zhang et al. Reference Zhang, Yao, Piao, Bolch, Xie, Chen, Gao, O’Reilly, Shum, Yang and Yi2017). Losses have been greatest in China’s Inner Mongolia Autonomous Region, due to human activities including mining, and irrigation impacts such as pumping groundwater and intercepting rivers (Tao et al. Reference Tao, Fang, Zhao, Zhao, Shen, Hu, Tang, Wang and Guo2015).
Discussion
Over the past 27 years, the Bar-headed Goose population on the wintering grounds in Tibet has demonstrated a remarkable sevenfold increase from just over 10,000 to more than 68,000 geese. Our model of exponential growth rate fit the Bar-headed Goose data for this time period, signifying the population was doubling approximately every 10 years. Nevertheless, our final 2017/2018 winter survey suggests that during the four years since the penultimate 2013/2014 winter survey, the Bar-headed Goose population appears to be stabilizing, with an increase in the eastern Yarlung region being offset by a decrease in the western Yarlung region.
Our surveys began in 1991, just three years after the passage of the 1988 law protecting Bar-headed Goose. We propose that the curtailment of hunting and trapping pressure across the Bar-headed Goose’s range in China, concurrent with the establishment of the Pengbo Black-necked Crane Reserve on an important wintering area in the early 1990s were important factors in stabilizing the Bar-headed Goose wintering population from 1992 to 2000. Approximately 23% of Tibet’s wintering Bar-headed Goose population was observed during both the 1991/1992 and subsequent 1999/2000 winter surveys in and around the Pengbo Black-necked Crane Reserve (Bishop et al. Reference Bishop, Yanling, Zhouma and Binyuan1997, Bishop unpubl. data), highlighting the critical importance of this area. Notably, the reserve encompassed two large reservoirs constructed during the previous decade that provided protected and alternative roosting habitat to the secondary river channels of the major rivers typically used by Bar-headed Goose.
Importantly, this 8-year period of relatively slow population growth (4.4%/year) was followed by a 14-year period of rapid Bar-headed Goose population growth (9.0–9.6%/year; Table 1) that coincided with a climate regime shift across the Tibetan Plateau that began in 1998. The climate regime shift included temperature warming and an increase in net precipitation across the Plateau (Zhang et al. Reference Zhang, Yao, Piao, Bolch, Xie, Chen, Gao, O’Reilly, Shum, Yang and Yi2017). The Bar-headed Goose wintering grounds in Tibet had warmer temperatures while their breeding grounds across the Tibetan Plateau were both warmer and wetter (Figures 5 and 6).
Whereas the widespread use of irrigation in autumn and spring are critical to winter wheat production (Paltridge et al. Reference Paltridge, Tao, Unkovich, Bonamano, Gason, Grover, Wilkins, Tashi and Coventry2009), warmer temperatures on the wintering grounds, especially warmer minimum temperatures, may increase the availability of winter wheat for Bar-headed Goose consumption. In a series of field warming experiments examining winter wheat growth and yield, Zheng et al. (Reference Zheng, Chen, Zhang, Song, Deng, Zhang, Wang, Mao and Zhang2016) found a significant increase in winter wheat seed germination rate caused by warming. This suggests that warmer temperatures increase the availability of winter wheat seedlings, thus potentially increasing the carrying capacity of the agricultural fields in Tibet for overwintering geese. At the same time, cereal crop seedlings have high protein content and provide high-quality forage (Fox and Abraham Reference Fox and Abraham2017), potentially enhancing Bar-headed Goose overwinter fitness, survival, and carry-over effects on reproduction.
While studies on Bar-headed Goose productivity on the Tibetan Plateau are lacking (but see Luo et al. Reference Luo, Wan, Ma, Yang, Se and Jia2020), based on the impact of climate change on Arctic goose species we speculate that warmer weather and the increased precipitation on the Tibetan Plateau breeding grounds may be positively impacting Bar-headed Goose productivity and population growth. For example, in the case of Greater Snow Geese Anser caerulescens atlantica higher mean temperatures during spring on the Arctic breeding grounds were associated with increased nest density, earlier egg laying and hatch dates, and increased hatch success (Dickey et al. Reference Dickey, Gauthier and Cadieux2008, van Oudenhove et al. Reference van Oudenhove, Gauthier and Lebreton2014). Similarly, in high‐Arctic Svalbard Barnacle Geese Branta leucopsis earlier snow melt due to advanced spring onset positively affected egg production, and earlier vegetation green-up resulting from warmer summers positively impacted hatch success (Layton‐Matthews et al. Reference Layton‐Matthews, Hansen, Grøtan, Fuglei and Loonen2020).
Likewise, the expansion of lakes especially in the Inner Tibetan Plateau may also be enhancing Bar-headed Goose productivity by providing additional breeding and brood-rearing habitat. Xue et al. (Reference Xue, Lyu, Chen, Zhang, Jiang, Zhang and Lyu2018) estimated that one-third of the wetlands on the Tibetan Plateau were under threat of being submerged due to lakes rising. They proposed, however, that while lakeside marshes may be submerged or pushed landward in response to lake-level rise, these habitats may revert to wet meadow. Interestingly, Bar-headed Goose does not breed at Ruoergai Marsh in Sichuan Province where wet meadows but not lakes are common, while Bar-headed Goose is an abundant breeder at Gahai Marsh in Gansu Province, where both wet meadows and lakes are common. While lakes may provide more suitable nesting and moulting habitat because the risk of predation by land-based predators is minimized, wet meadows may provide more suitable brood-rearing habitat because of their foraging and concealment opportunities. In view of the Tibetan Plateau’s high concentration of lakes, we suggest that the conversion of lakeside marshes to wet meadows will augment Bar-headed Goose breeding and brood-rearing habitat.
Notably, an increase in Bar-headed Goose wintering numbers has also been observed at the Pong Dam reservoir, a Ramsar Wetland in India’s Himachal Pradesh Province where hunting is banned. While in 1992 geese numbered 1,000 (Pandey Reference Pandey1993), by 2016 the population increased to 72,000 (Buner et al. Reference Buner, Dhadwal, Ranganathan, Dhiman, Hoare and Walker2016). Three of the four Bar-headed Geese previously satellite-tagged at Pong Dam bred in lakes or wetlands in the Indus River Basin (Figure 7) of the Tibetan Plateau (Takekawa et al. Reference Takekawa, Palm, Prosser, Hawkes, Batbayar, Balachandran, Luo, Xiao, Newman, Prins and Namgail2017), suggesting that environmental factors on the breeding grounds are an important driver in the growth of the Bar-headed Goose population across its range.
Bar-headed Goose changes in habitat use
Since the 1970s several species of Arctic-breeding geese have experienced exponential population growth. These increases have been attributed to a shift from foraging in natural wetlands to agricultural fields that provide high-quality forage (Fox and Abraham Reference Fox and Abraham2017, Fox and Madsen Reference Fox and Madsen2017). In the case of Bar-headed Goose in Tibet, however, use of cultivated fields has remained steady at approximately 56–57% from the early 1990s to the present. During this same time, the Bar-headed Goose has shifted from primarily feeding in barley and spring wheat crop stubble to planted winter wheat fields. During the 1991/1992 winter count, <7% of Bar-headed Geese were observed in winter wheat whereas by 2013/2014 winter, 39% of all geese observed were in winter wheat (Zhang et al. Reference Zhang, Liu, Li, Qian, Ma, Dan and Lu2014, Liu et al. Reference Liu, Zhang, Li, Ma, Lu and Qian2017).
Winter wheat has been an important winter crop in Tibet for over 60 years. Winter wheat was first cultivated in Tibet in 1952, and by the early 1960s was cultivated in large amounts on some of the state farms in around Lhasa and Lhünzhub (Yeh Reference Yeh2003). More recently, between 1985 and 2012 the sown area of winter wheat in Tibet increased 81.3% (Zheng et al. Reference Zheng, Chen, Zhang, Song, Deng, Zhang, Wang, Mao and Zhang2016) such that it now represents approximately 3/4 of the cultivated wheat in Tibet (Bureau of Statistics of Tibet Autonomous Region 2019).
While we have limited data on the availability of crop stubble, previous studies suggest that harvested fields are being ploughed under, reducing crop stubble. For example, Bishop et al. (Reference Bishop, Zhouma, Yanling, Harkness and Binyuan1998) studied land-use by Black-necked Cranes Grus nigricollis at Tama, an area just east of Xigazê where several hundred Bar-headed Geese also wintered. In February 1991, they found that barley and spring wheat stubble comprised 27%, ploughed fields 50%, and winter wheat 21% of the available habitat. In a similar study of Black-necked Crane land-use during January 2010 at southern Tanakpu valley (˜50 km west of the 1991 study site), neither barley nor wheat stubble was available while ploughed fields and winter wheat comprised 54% and 40% of the available habitat, respectively (International Crane Foundation and Tibet Plateau Institute of Biology 2010).
These studies as well as our observations suggest that harvested fields are increasingly ploughed under shortly after harvest, leaving less residual grain in fields and have resulted in geese foraging on sprouted winter wheat. At the same time, the increasing numbers of Bar-headed Geese feeding in agricultural fields are causing economic losses for farmers. During interviews with farmers conducted by the International Crane Foundation in 2009 and 2010 (F. Li unpubl. data), farmers stated that both geese and Black-necked Cranes damaged winter wheat, with geese eating seedlings and cranes mainly eating seeds and roots. As Buddhism is the dominant religion around rural villages, farmers typically tolerate crop depredation by the geese and cranes or mitigate losses using scarecrows. Even so, provincial and local government compensation for animal depredation that historically focused on livestock losses to predators has been recently expanded to include compensation for crop depredation by birds including Bar-headed Goose, Black-necked Crane, and Ruddy Shelduck Tadorna ferruginea.
Connectivity between Bar-headed Goose breeding and Tibet wintering grounds
Satellite tagging studies have identified some of the breeding grounds for Bar-headed Goose wintering in Tibet, including in Qinghai Province, and in Mongolia (Prosser et al. Reference Prosser, Cui, Takekawa, Tang, Hou, Collins, Yan, Hill, Li, Li and Lei2011, Zhang et al. Reference Zhang, Liu, Hou, Jiang, Dai, Qian, Lu, Xing and Li2011, Batbayar Reference Batbayar2013, Takekawa et al. Reference Takekawa, Heath, Douglas, Perry, Javed, Newman, Suwal, Rahmani, Choudhury, Prosser and Yan2013, Reference Takekawa, Palm, Prosser, Hawkes, Batbayar, Balachandran, Luo, Xiao, Newman, Prins and Namgail2017), although there remain significant information gaps. In particular, Bar-headed Geese breeding at Qinghai Lake have shown a high level of connectivity with the wintering grounds in Tibet. In one study, two of four Bar-headed Geese (Zhang et al. Reference Zhang, Liu, Hou, Jiang, Dai, Qian, Lu, Xing and Li2011) and in a separate study 14 of 15 Bar-headed Geese (Prosser et al. Reference Prosser, Cui, Takekawa, Tang, Hou, Collins, Yan, Hill, Li, Li and Lei2011, Takekawa et al. Reference Takekawa, Palm, Prosser, Hawkes, Batbayar, Balachandran, Luo, Xiao, Newman, Prins and Namgail2017) satellite-tagged at Qinghai Lake wintered within 100 km of Lhasa (Prosser et al. Reference Prosser, Cui, Takekawa, Tang, Hou, Collins, Yan, Hill, Li, Li and Lei2011) including in the Lhasa and Yarlung River Valleys. Interestingly, of the 16 Bar-headed Geese with movement data from satellite tags, only one was detected near Xigazê, and none of the 16 birds were recorded using wintering grounds along the Yarlung west of Xigazê, nor on the Nyang Chu river around Gyangzê. As of 2017, counts from this area (Gyangzê to Xigazê and west) currently represent approximately 44% of the wintering population in Tibet. These results show that to date we do not know the origin of Bar-headed Geese wintering in this portion of the wintering grounds. This would be important to know for conservation reasons.
Habitat changes and human disturbances on Bar-headed Goose wintering grounds further south may be causing some geese to shorten their autumn migration and overwinter in Tibet. In northern Myanmar on the Upper Ayeyarwady River, Zöckler (Reference Zöckler2018) documented a rapid decline of the wintering Bar-headed Goose population, with numbers dropping from a high of 4,070 geese during 2000 to 42 geese in 2018. While Zöckler indicated that reasons for the decline were likely related to increasing human disturbance associated with pebble mining as well as hunting pressure, he also suggested that Myanmar birds may have shortened their autumn migration to overwinter in Tibet. While the breeding grounds of these birds are unknown, the northern Myanmar site is <1,300 km south-west of Qinghai Lake, a major breeding grounds for Bar-headed Geese wintering on the Tibetan Plateau.
In conclusion, our work shows the importance of maintaining the Bar-headed Goose winter counts to provide a measure of distribution as well as population changes. With climate change proceeding faster on the Tibetan Plateau than most parts of the globe, there is the possibility that habitat conditions currently favouring Bar-headed Goose population growth may deteriorate. We recommend future research include marking geese on the inner Tibetan Plateau breeding grounds and on the western Yarlung wintering grounds to determine their wintering and breeding grounds, respectively.
Supplementary Materials
To view supplementary material for this article, please visit http://doi.org/10.1017/S0959270921000265.
Acknowledgements
We thank officials at the Forestry Department of the Tibet Autonomous Region for their cooperation and support in making our field work possible. We also thank the many people who assisted with the surveys, including: Song Yangling, Tian Ma, Jun Lu, Ding Dan, Langjie Wangqiu, Gu Binyuan (deceased), Suolang Yangjin, Hongyan Yang, and Nima Zhaxi. We thank Jessica Stocking for statistical help and Anne Schaefer for assistance with graphics and manuscript review. We also thank two anonymous reviewers for their constructive comments.
Depending on the winter survey year, this study was funded by: National Key Research and Development Program of China (No. 2019YFA0607103), Wildlife Rescue Project from the Department of Wildlife Protection and Nature Reserve Management, State Forestry Administration (SFA) of China and the Project of Surveillance of H7N9 in Wild Birds (No. 201404404) from the Department of Science and Technology, SFA and co-funded by the International Crane Foundation (2009, 2014, and 2017), Continental Minerals Corporation (2007), International Crane Foundation and Swordspoint Foundation (2000), and Brehm Fund for International Bird Conservation (1992).