1. Introduction
The interaction between a compressible jet flow and the airframe structure can give rise to significant pressure fluctuations, whose amplitudes depend on the momentum and direction of the jet flow. This interaction is particularly evident when the jet flow interacts with the wing surface of an aircraft, resulting in substantial pressure fluctuations and the emission of far-field noise. In certain cases, these pressure fluctuations can induce vibrations that lead to increased noise levels inside the aircraft cabin. The reduction of aircraft jet noise is a complex subject, primarily due to the intricate interplay between the jet flow and the structure of the aircraft, specifically the wing surface. This interaction gives rise to complex fluid dynamics and noise radiation phenomena.
The objective of reducing jet noise while increasing engine efficiency has prompted consideration of increasing the bypass ratio of the jet. This increase, however, adversely impacts the separation between the jet engine and the airframe structure, such as the wing surface. When the distance is decreased, the hydrodynamic field of the jet flow interacts with the proximate wing surface, leading to increased noise levels. The proximity between a jet flow and the adjacent wing surface plays a significant role in modifying the hydrodynamic field, leading to increased noise levels. This phenomenon, commonly referred to as jet installation noise (JIN) (Brown & Ahuja Reference Brown and Ahuja1984), becomes particularly pronounced during the climbing and approaching phases when the flaps are deployed, decreasing the distance between the high-lifting device surfaces and the turbulent jet. Extensive research conducted by Casalino & Hazir (Reference Casalino and Hazir2014) has revealed a substantial increase in perceived noise, up to 4 dB, as a direct consequence of jet installation effects. Understanding this noise increase requires a detailed examination of the underlying physical mechanisms, which differ significantly between subsonic and supersonic flow regimes.
The primary mechanism responsible for this noise amplification is the scattering of the jet’s evanescent hydrodynamic pressure field by the wing’s trailing edge (Williams & Hall Reference Williams and Hall1970; Head & Fisher Reference Head and Fisher1976; Lyu et al. Reference Lyu, Dowling and Naqavi2017; Lyu & Dowling Reference Lyu and Dowling2019; Dawson et al. Reference Dawson, Lawrence, Self and Kingan2020), which generates a characteristic low-frequency acoustic signature with a cardioid directivity pattern and a dipolar nature (Head & Fisher Reference Head and Fisher1976). This interaction converts near-field hydrodynamic energy into propagating acoustic waves, producing a low-frequency noise augmentation that scales with the jet velocity (
 $U_j^5$
to
 $U_j^6$
), with maximum radiation in the upstream direction (Ffowcs Williams & Hall Reference Ffowcs Williams and Hall1970; Brown & Ahuja Reference Brown and Ahuja1984; Lawrence, Azarpeyvand & Self Reference Lawrence, Azarpeyvand and Self2011; Jawahar, Karabasov & Azarpeyvand Reference Jawahar, Karabasov and Azarpeyvand2023). The spectral level of this installed noise displays an exponential increase as the distance between the surface and the jet flow decreases, an effect attributed to the near-field enhancement of the sound pressure level (SPL) (Cavalieri et al. Reference Cavalieri, Jordan, Wolf and Gervais2014). Similarly, the length of the interacting surface is a critical parameter. As the plate is extended, its trailing edge interacts with more developed and energetic coherent structures downstream, which shifts the peak interaction noise towards lower frequencies (Lawrence et al. Reference Lawrence, Azarpeyvand and Self2011; Brown Reference Brown2012). The characteristics of this installed noise can often be correlated with the near-field properties of an isolated jet, suggesting that wavepackets and their interaction with the trailing edge are fundamental to the process (Suzuki & Colonius Reference Suzuki and Colonius2006; Tinney & Jordan Reference Tinney and Jordan2008; Papamoschou Reference Papamoschou2010; Rego et al. Reference Rego, Avallone, Ragni and Casalino2020). These hydrodynamic pressure fluctuations are directly linked to large-scale coherent structures, or wavepackets, that develop within the jet’s shear layer. Consequently, the key parameters governing the noise levels are the distance between the trailing edge and the nozzle exit, and the radial location of the surface relative to the jet centreline (Lawrence et al. Reference Lawrence, Azarpeyvand and Self2011; Cavalieri et al. Reference Cavalieri, Jordan, Wolf and Gervais2014). For instance, when the trailing edge is located in the nonlinear, rotational hydrodynamic region of the jet, it behaves as an acoustically compact surface, whereas its placement within the linear, irrotational hydrodynamic field results in noise generated through diffraction, with characteristics highly sensitive to the radial position (Lawrence et al. Reference Lawrence, Azarpeyvand and Self2011). Furthermore, the interaction between a jet flow and a flat surface can lead to the Coanda effect, which significantly alters the structure of the jet flow and the associated noise compared with an isolated jet (Di Marco, Mancinelli & Camussi Reference Di Marco, Mancinelli and Camussi2015; Proença et al. Reference Proença, Lawrence and Self2020). These modifications are reflected in the wall-pressure statistics, where far downstream of the jet–plate interaction, the pressure spectra often exhibit the characteristic
 $f^{-5/3}$
power-law decay of a fully developed turbulent boundary layer (Di Marco et al. Reference Di Marco, Mancinelli and Camussi2015). In some configurations, the jet–surface interaction can also lead to tonal noise through a ‘frequency squeezing’ phenomenon, adding another layer of complexity to the problem (Jordan et al. Reference Jordan, Jaunet, Towne, Cavalieri, Colonius, Schmidt and Agarwal2018).
The phenomenon of screech in imperfectly expanded supersonic jets is governed by a well-established aeroacoustic feedback loop, first described by Powell (Reference Powell1953). This loop begins with the growth of Kelvin–Helmholtz (KH) instability waves originating from the nozzle lip. As these coherent structures travel downstream, they interact with the quasi-periodic shock-cell structure of the jet plume. This interaction acts as a potent sound source, generating strong acoustic waves that propagate upstream. While Powell originally posited that these feedback waves were free-stream acoustic waves, a recent body of work has proposed and provided strong evidence for an alternative closure mechanism involving upstream-propagating acoustic wave modes internal to the jet, often referred to as ’guided jet modes’ (Tam & Hu Reference Tam and Hu1989; Edgington-Mitchell et al. Reference Edgington-Mitchell, Jaunet, Jordan, Towne, Soria and Honnery2018). These modes, being supported by the jet flow itself, offer a direct and efficient feedback path to the receptive nozzle lip region. This resonant process is further complicated by the existence of distinct screech modes (e.g. axisymmetric, flapping and helical), which manifest as discontinuous jumps in frequency as flow conditions change (Raman Reference Raman1999). The interaction between the instability waves and shocks is itself a complex process, involving the modulation and distortion of both the coherent structures and the shock cells, which ultimately determines the characteristics of the radiated sound (Panda Reference Panda1999). Detailed numerical simulations have identified the first several shock cells as the primary effective source region for this acoustic radiation (Gao & Li Reference Gao and Li2010).
When the jet is supersonic, the jet installation problem becomes substantially complex due to the presence of shock-associated noise. The presence of a quasi-periodic shock-cell structure introduces two strong noise components: broadband shock-associated noise (BBSAN) and discrete-frequency screech tones. Broadband shock-associated noise, which manifests as a dominant broadband hump in the upstream and sideline spectra, is generated by the weak interaction between turbulent eddies from the shear layer and the stationary shock-cell train (André et al. Reference André, Castelain and Bailly2013). Crucially, noise source localisation studies have revealed that the dominant sources of BBSAN are often not the strong shocks near the nozzle, but rather the weaker shock cells located many diameters downstream (Podboy Reference Podboy2012; Brown, Clem & Fagan Reference Brown, Clem and Fagan2015). This downstream source location has direct implications for shielding strategies, as a nearby surface can only be an effective acoustic shield if it is long enough to physically obstruct the entire noise-producing region of the shock train (Clem, Brown & Fagan Reference Clem, Brown and Fagan2013; Brown et al. Reference Brown, Clem and Fagan2015). Furthermore, the BBSAN component is not independent of other flow phenomena; its amplitude and peak frequency can be significantly modulated by the presence of strong screech tones. Experimental work by André et al. (Reference André, Castelain and Bailly2013) has shown that screech accelerates the decay of the shock-cell structure, thereby attenuating the BBSAN and indicating a direct coupling between the two shock-associated noise mechanisms. However, the literature presents a seemingly contradictory picture regarding the effect of plate installation on screech tones. Several studies have shown that the interaction can lead to a significant enhancement of screech amplitude. This amplification is primarily attributed to an acoustic feedback reinforcement mechanism, where the flat plate acts as an efficient reflector. Upstream-propagating sound waves from the shock cells are reflected by the plate back towards the nozzle lip, strengthening the feedback signal that drives the jet’s instability and resulting in a high-amplitude screech tone, particularly at plate distance (
 $H/D \approx 1$
) (Seiner, Manning & Jansen Reference Seiner, Manning and Jansen1987; Ahuja, McCaulley & Tam Reference Ahuja, McCaulley and Tam1989; Wlezien Reference Wlezien1989). Nevertheless, the relationship is not linear, with certain configurations displaying a distinctly non-monotonic response. Specifically, screech tones tend to be amplified at
 $H/D \approx 1$
and
 $H/D \approx 3$
, but are notably suppressed at
 $H/D \approx 2$
, suggesting a complex resonance behaviour governed by phase alignment (Baier, Karnam & Gutmark Reference Baier, Karnam and Gutmark2020). This interaction is also highly sensitive to the plate’s radial location, with evidence suggesting that the resulting acoustic loading on the surface is a key factor in the enhancement (Wlezien Reference Wlezien1989). In contrast, other research has demonstrated the complete elimination of screech. This suppression occurs when the plate is positioned very close to the jet (
 $H/D\lt 0.6$
), leading to a direct aerodynamic disruption of the shock-cell structure. The physical presence of the plate constrains the jet’s expansion, preventing the formation of the regular shock train and Mach disc necessary for the screech feedback loop. Instead, a complex flow field of oblique shocks and boundary-layer separation is formed, fundamentally altering the noise generation process (Seivwright & Shreeve Reference Seivwright and Shreeve1997; Obase & Nakamura Reference Obase and Nakamura2004; Ibrahim et al. Reference Ibrahim, Sawai, Obase, Mori and Nakamura2009). This dual role of the surface, acting as an acoustic amplifier at a distance and an aerodynamic disruptor up close, highlights the intricate nature of supersonic JIN and motivates a detailed investigation into the parameters governing this transition.
While these previous investigations have established the critical role of installation geometry and have identified key phenomena, a definitive physical explanation for the coexistence, suppression and enhancement of screech and low-frequency plate tones remains elusive. For instance, Ahuja et al. (Reference Ahuja, McCaulley and Tam1989) investigated the installation noise of supersonic jets near both flat plates and curved surfaces to understand the effects of fuselage curvature, finding significant variations in noise levels only when the jet–fuselage distance was less than one jet diameter. Critically, they observed the coexistence of a low-frequency tone and a screech tone under certain flat plate configurations, and even the complete disappearance of screech in favour of the low-frequency tone in others. The underlying physics driving these transitions was not thoroughly explained. This contrasts with the findings of Seiner et al. (Reference Seiner, Manning and Jansen1987), who did not observe such coexistence for a rectangular jet. This discrepancy underscores the complexity of jet–plate interactions and suggests that nozzle geometry, plate proximity and flow conditions are critical influencing factors.
While the shock-cell train provides the stationary structure necessary for these supersonic noise mechanisms, the unsteady dynamics is driven by turbulent structures and instability waves that originate and develop within the jet’s shear layer. For BBSAN, the statistical properties of the eddies convecting from the shear layer determine the characteristics of the sound generated at each shock interaction (André et al. Reference André, Castelain and Bailly2013). More critically, for screech tones, the shear-layer instability wave is a fundamental component of the resonant feedback loop. Its convection velocity and amplitude upon reaching the shock cells dictate the frequency and strength of the resulting acoustic source (Powell, Umeda & Ishii Reference Powell, Umeda and Ishii1992; Tam Reference Tam1995; Panda Reference Panda1999). Therefore, any modification to the shear layer due to the presence of a nearby surface can fundamentally alter the inputs to the shock-interaction process itself (Baier et al. Reference Baier, Karnam and Gutmark2020). This study, while accounting for the overall shock structure, places a particular emphasis on analysing the modifications to the jet shear layer, as this provides direct insight into how the installation geometry influences the primary drivers of both BBSAN and screech noise.
The present study aims to resolve this ambiguity by conducting a systematic experimental investigation into the noise generation mechanisms of a round supersonic jet interacting with a parallel flat plate. A wide range of jet Mach numbers and plate positions is explored to characterise the conditions under which screech tones, plate-induced tones and their interactions occur. A comprehensive picture of the flow dynamics is constructed by combining far-field acoustic measurements, near-field surface pressure analysis and time-resolved Schlieren visualisation. Furthermore, to deconstruct the complex flow dynamics and identify the origins of the observed acoustic tones, dynamic mode decomposition (DMD) is employed. Unlike other modal decomposition techniques, DMD is uniquely suited to extract coherent structures that are directly associated with specific temporal frequencies from the time-resolved Schlieren data (Towne, Schmidt & Colonius Reference Towne, Schmidt and Colonius2018). This feature is critical for the analysis as it allows the precise spatial flow structures responsible for the screech tones, plate-induced tones and their interactions to be extracted, as observed in the far-field acoustic spectra. The impact of plate installation on the wavepackets and shock-cell structures underlying these key aeroacoustic phenomena is directly visualised through the application of DMD. Overall, this study aims to deepen the understanding of the noise generation mechanisms and flow dynamics in the presence of a plate for a round jet operating at supersonic Mach numbers, providing valuable insights into the effects of jet installation on the flow and noise characteristics.
2. Experimental set-up
The experiments were carried out at the Bristol Jet Aeroacoustic Research Facility (B-JARF) at the University of Bristol, a facility that had been previously validated through a series of studies (Kamliya Jawahar & Azarpeyvand Reference Kamliya Jawahar, Baskaran and Azarpeyvand2021a , Reference Kamliya Jawahar, Markesteijn, Karabasov and Azarpeyvandb , Reference Kamliya Jawahar, Meloni, Camussi and Azarpeyvandc ; Kamliya Jawahar & Azarpeyvand Reference Kamliya Jawahar and Azarpeyvand2021, Reference Kamliya Jawahar and Azarpeyvand2022, Reference Kamliya Jawahar and Azarpeyvand2024). The flow within the B-JARF was conditioned and silenced through the use of three custom-built in-line silencers, resulting in a clean and quiet flow with a jet exit Mach number of M = 0.3. The first two silencers, each with a diameter of 0.3 m and a height of 1.5 m, were placed immediately after the control valve outside of the anechoic chamber. The third silencer, with a diameter of 0.457 m and a height of 1.9 m, was located within the chamber. The third large silencer in the anechoic facility is shown in figure 1. These silencers were equipped with perforated tubes to allow the flow to pass through, and the remaining space was densely packed with glass wool, aiding in noise absorption and reduction. The anechoic chamber has dimensions of 7.9 m in length, 5.0 m in width and 4.6 m in height, including the surrounding acoustic walls as reported in Mayer et al. (Reference Mayer, Jawahar, Szőke, Ali and Azarpeyvand2019). The flow that exits the nozzle is directed out of the acoustic chamber via the collector, ensuring it does not re-enter the facility. Prior to testing, the silencers, collector and far-field array were insulated with foam to reduce acoustic reflection and ensure accurate measurements. The acoustic Mach number and flow conditions were determined by taking measurements of the total temperature and pressure within the large silencer and inside the acoustic chamber.
Schematic of the experimental set-up where the labels A–D show the location of the plenum, nozzle, collector and far-field array, respectively.

Schematic of the experimental set-up.
The current study involved conducting tests on a round convergent nozzle SMC000. The SMC000 nozzle has been extensively characterised for isolated configurations in previous research by Bridges & Brown (Reference Bridges and Brown2004). The nozzle used in the present study is a down-scaled version of the nozzles used by Bridges & Brown (Reference Bridges and Brown2004), with an exit diameter of
 $D=16.93$
mm. The tests were performed for a range of supersonic flow conditions, with jet Mach numbers ranging from M = 1.1–1.44.
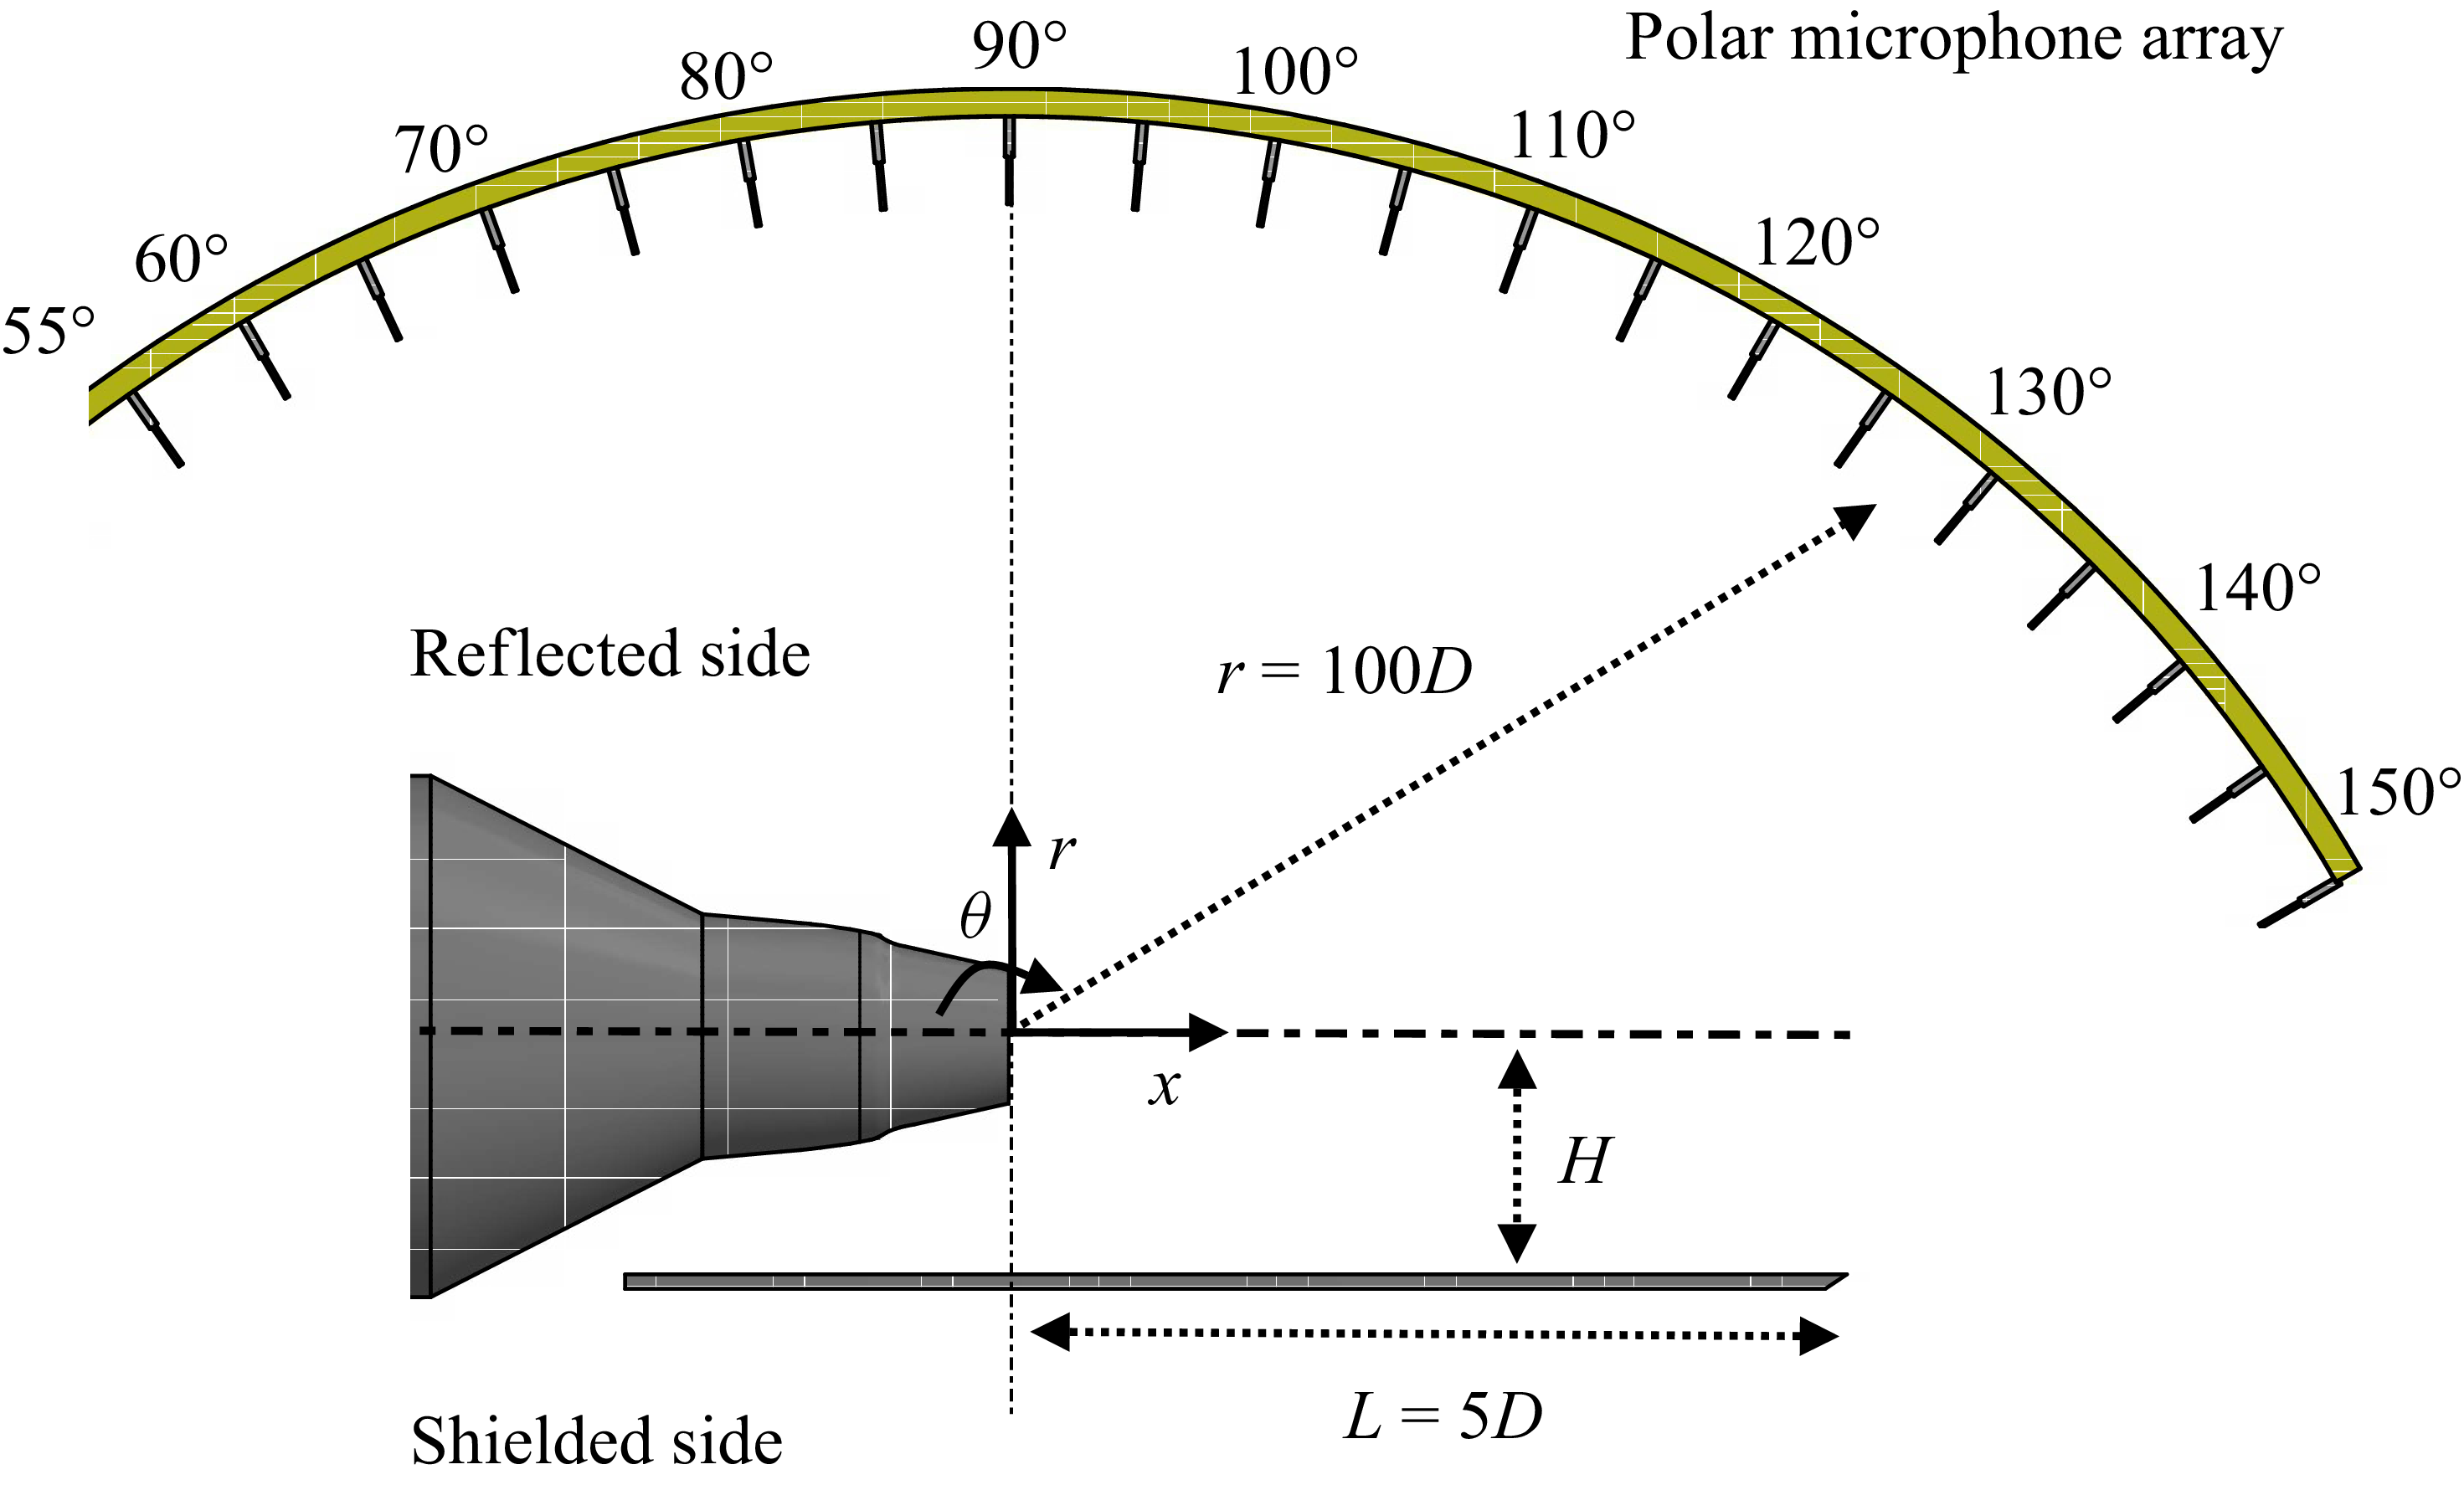
The jet–plate arrangement used in the experiment is illustrated in figure 2. The flat plate was constructed from 5 mm thick aluminium and had a sharp trailing edge. As depicted in figure 2, the tests were conducted for a flat plate length of
 $L=5D$
and various plate heights of
 $H/D=1,1.5,2.5$
radially away from the jet centreline. The plate length downstream of the nozzle exit was fixed at
 $L=5D$
to provide a consistent and significant interaction length, sufficient to encompass several shock cells (as observed in figure 10) and to allow for the development of plate-length-dependent resonant feedback mechanisms, while enabling a focused investigation on the primary parameters of
 $H/D$
and the Mach number. The investigated parametric space is listed in table 1. The plate had a total length of
 $8D$
and a total span of
 $30D$
to minimise side-edge scattering. The plate extended
 $3D$
upstream from the nozzle exit to avoid scattering effects at the upstream trailing edge. The plate was mounted on an automated traverse system, allowing it to move precisely in the radial direction.
Investigated installed plate heights (
 $H/D$
), the plate length (
 $L/D$
), and the corresponding tested Mach numbers M1 = 1.1, M2 = 1.16 and M3 = 1.44.

Far-field noise measurements were performed using a
 $1/4$
-inch GRAS-46BE microphone, which had a corrected flat frequency response from 10 to 40 kHz, with a dynamic range of 160 dB. An array of 20 microphones was used for far-field measurements, distributed on an arc centred on the jet exit at a distance of 1.70 m (
 $r\approx 100D$
) that covered a polar angular range between
 $55^\circ$
upstream and
 $150^\circ$
downstream. A microphone was also placed at
 $\theta =270^\circ$
at the sideline position on the shielded side.
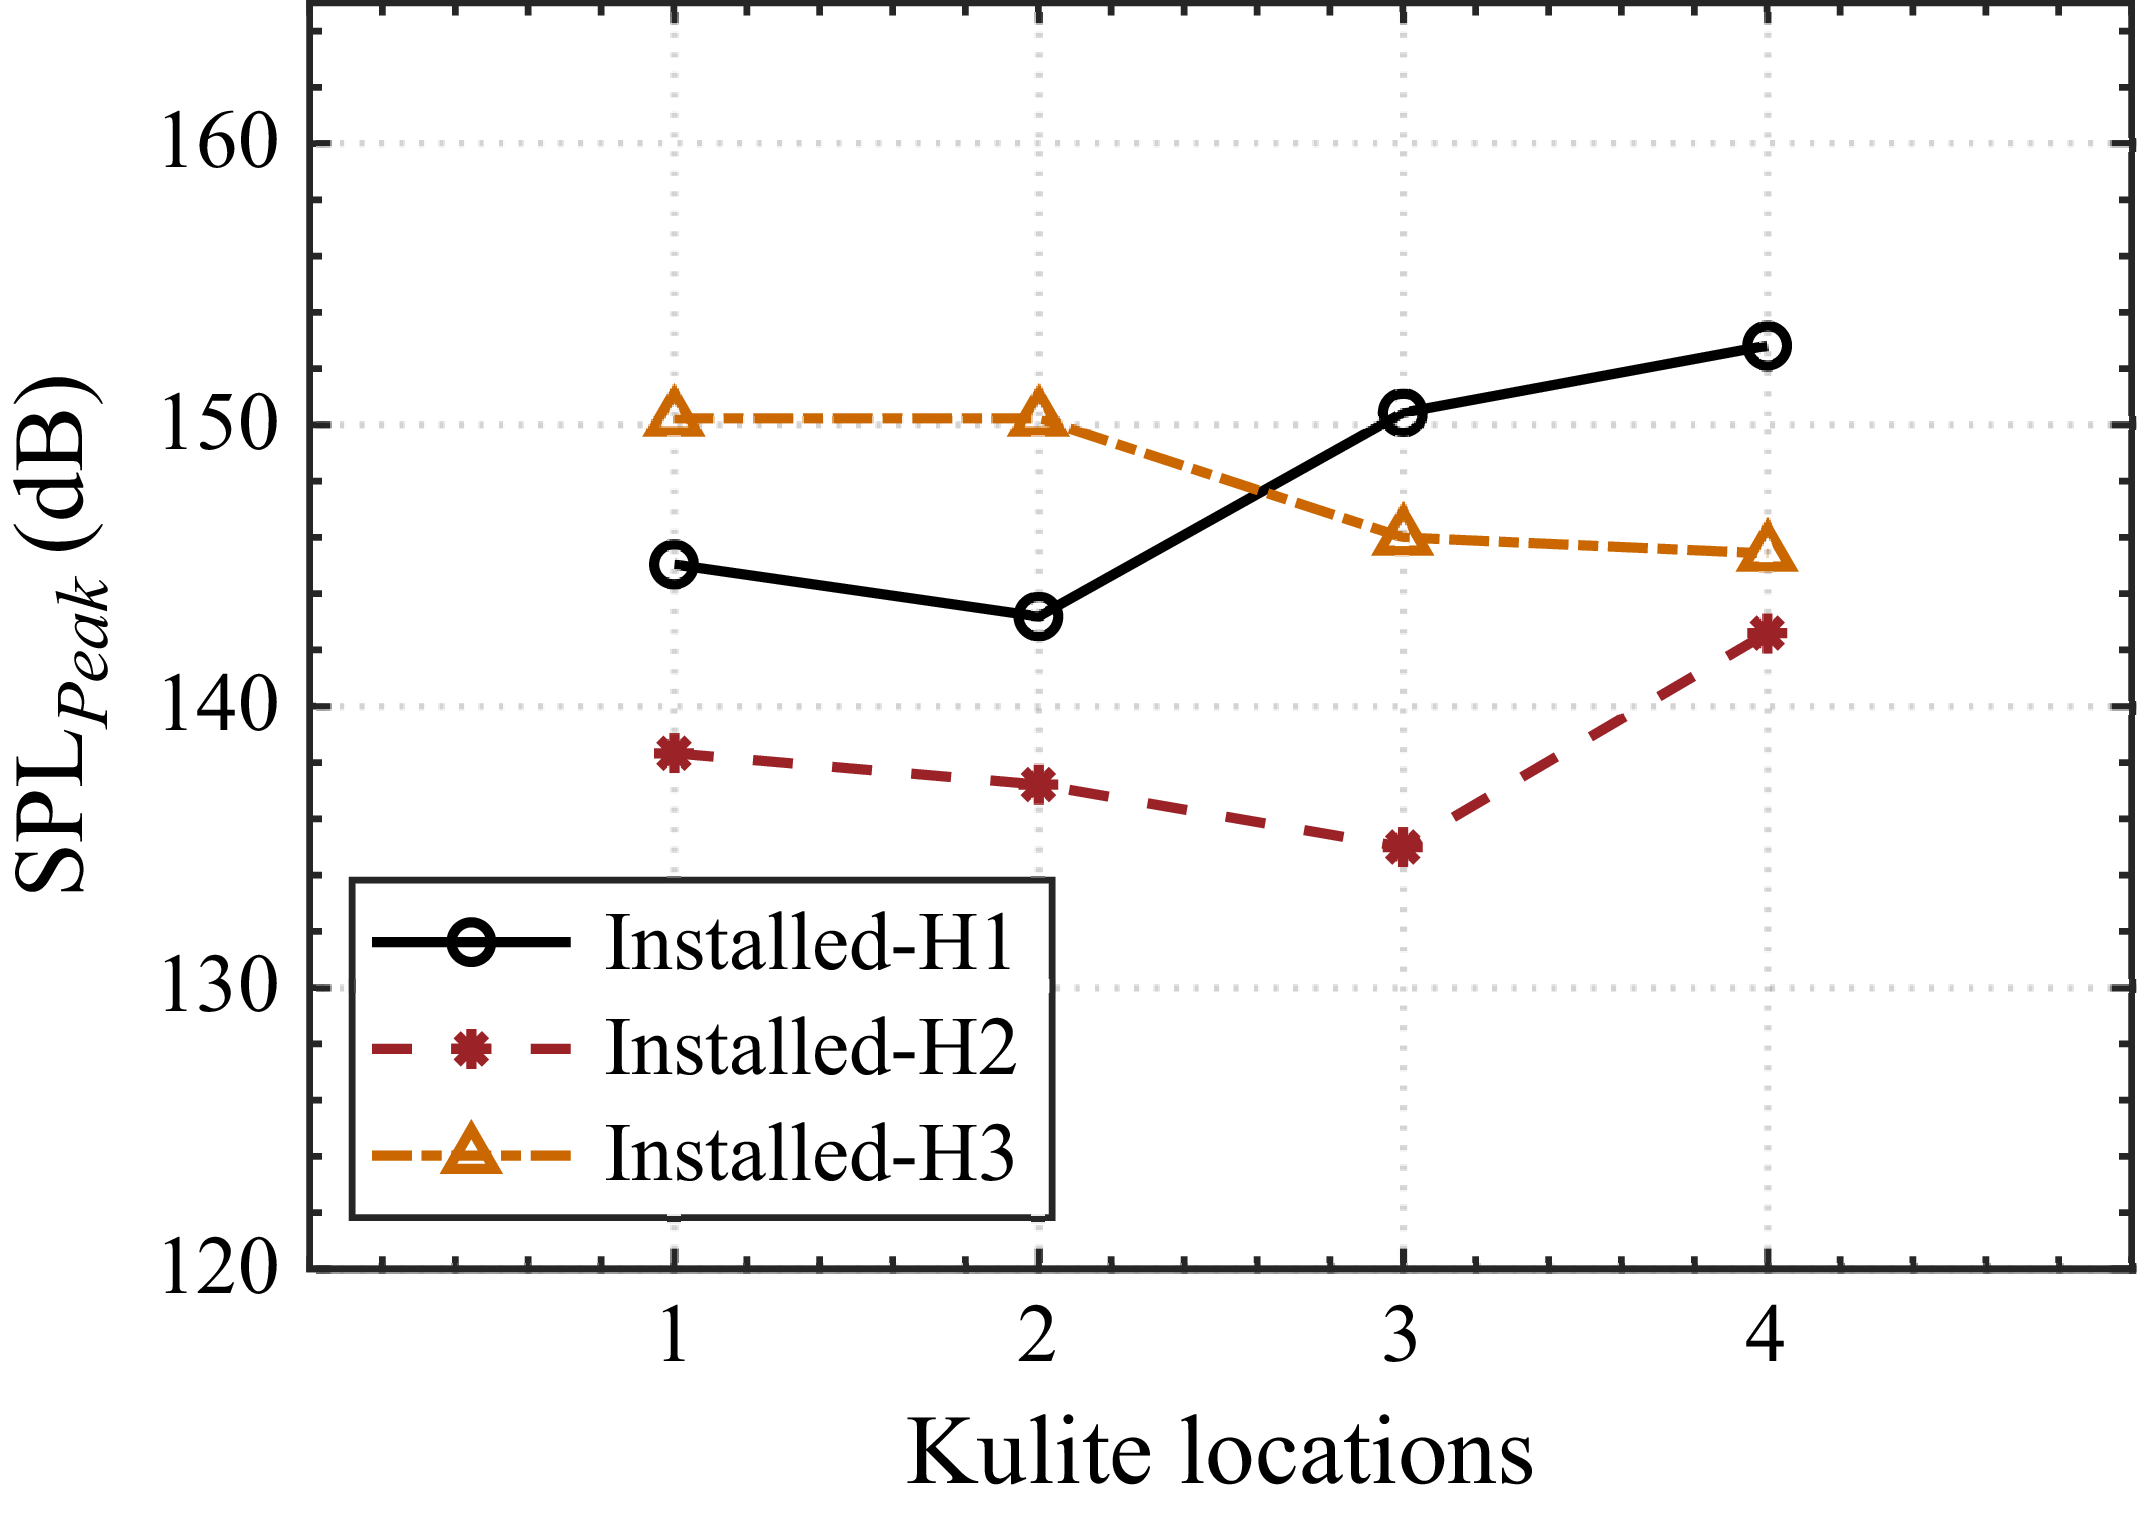
Kulite XTEL-190(M) miniature ruggedised high-temperature pressure transducers were employed along with a KSC-1 compact signal conditioner to acquire surface pressure fluctuations on the plate. A total of five Kulite sensors were distributed on the plate for near-field measurements as shown in figure 3. Data acquisition for both far-field and near-field measurements was carried out concurrently, using a National Instrument PXIe-4499 for a period of
 $t=24$
s at a high sampling frequency of
 $f = 2^{17}$
Hz. The power spectral density (PSD) of the collected pressure signals was computed utilising a Hanning window, and the data were ensemble averaged 220 times to achieve a frequency resolution of
 $\Delta f=8$
Hz. Subsequently, the SPL spectrum was computed using (2.1):
 \begin{equation} {\textit{SPL}} = 10\textrm {log}_{10}\left (\frac {{PSD}(f)\Delta f}{p^2_{\textit{ref}}}\right ), \end{equation}
where PSD is obtained from the fluctuating pressure
 $p^{\prime}(t)$
, defined as
 $p^{\prime}(t) = p(t) - p_{{mean}}$
, and
 $p_{{ref}}=20\,\unicode{x03BC}$
Pa is the reference pressure.
Schematic of the Kulite pressure transducers used in the present study at the vicinity of the trailing edge for the installed jet configuration.

An inline Schlieren imaging system (see figure 4) was utilised to visualise density gradients within the flow field, with specific emphasis on capturing the radial density gradient (
 $\partial \rho / \partial r$
). The optical arrangement incorporated a horizontal knife edge positioned at the focal plane, which enhanced image contrast by selectively obstructing deflected light rays arising from refractive index variations within the test section. In the present study, the knife-edge orientation focuses on the influence of plate installation on the jet shear layer. This configuration proved effective for resolving fine-scale flow features and shock structures in compressible flows. High-speed image acquisition was conducted using a Photron FASTCAM SA-Z camera, which was configured to capture 10 000 Schlieren images at a frame rate of 40 kHz and operated at a shutter speed of 1/4032 000 s. The images were acquired at a spatial resolution of 1024
 $\times$
512 pixels, permitting detailed visualisation of the evolving flow structures.
Schematic diagram of the inline Schlieren experimental set-up.

3. Results and discussion
3.1. Mach number effects on far-field noise
The effect of Mach number plays a crucial role in under-expanded jets as it directly affects flow characteristics and noise emission (Raman Reference Raman1997; Panda Reference Panda1998, Reference Panda1999). This section investigates the effect of different jet Mach numbers on the far-field noise spectra of the isolated and installed jet configurations. To better interpret the following spectral data, it is helpful to briefly outline screech, a key aeroacoustic phenomenon in incorrectly expanded jets. Screech manifests as strong, discrete tones primarily emitted by supersonic, particularly under-expanded, jets. These tones are the result of a well-established aeroacoustic feedback loop, wherein large-scale instability waves within the jet shear layer interact with the jet’s internal shock-cell structure. This interaction generates acoustic waves that propagate upstream, re-exciting the shear layer near the nozzle and thereby sustaining the resonance. It is well known that a typical under-expanded jet emits a strong screech tone (Raman Reference Raman1999) and BBSAN (André et al. Reference André, Castelain and Bailly2013) along with turbulent mixing noise (Jordan & Colonius Reference Jordan and Colonius2013), which is influenced by the Mach number (Tam Reference Tam1995). Acoustic measurements are presented for a microphone positioned at an angle of
 $\theta =90^\circ$
at a radial distance of
 $r = 100D$
. This angle was chosen due to the known significant installation effect at this location (Rego et al. Reference Rego, Avallone, Ragni and Casalino2020). The SPL spectra as a function of Strouhal number (
 $St$
) for the isolated and installed jet H1 configurations are shown in figures 5(a) and 5(b), respectively.
Sound pressure level spectra for jet Mach numbers M1 = 1.1, M2 = 1.16 and M3 = 1.44 of (a) the isolated and (b) the installed-H1 (
 $H/D$
= 1) configurations.

Comparison of screech
 $St$
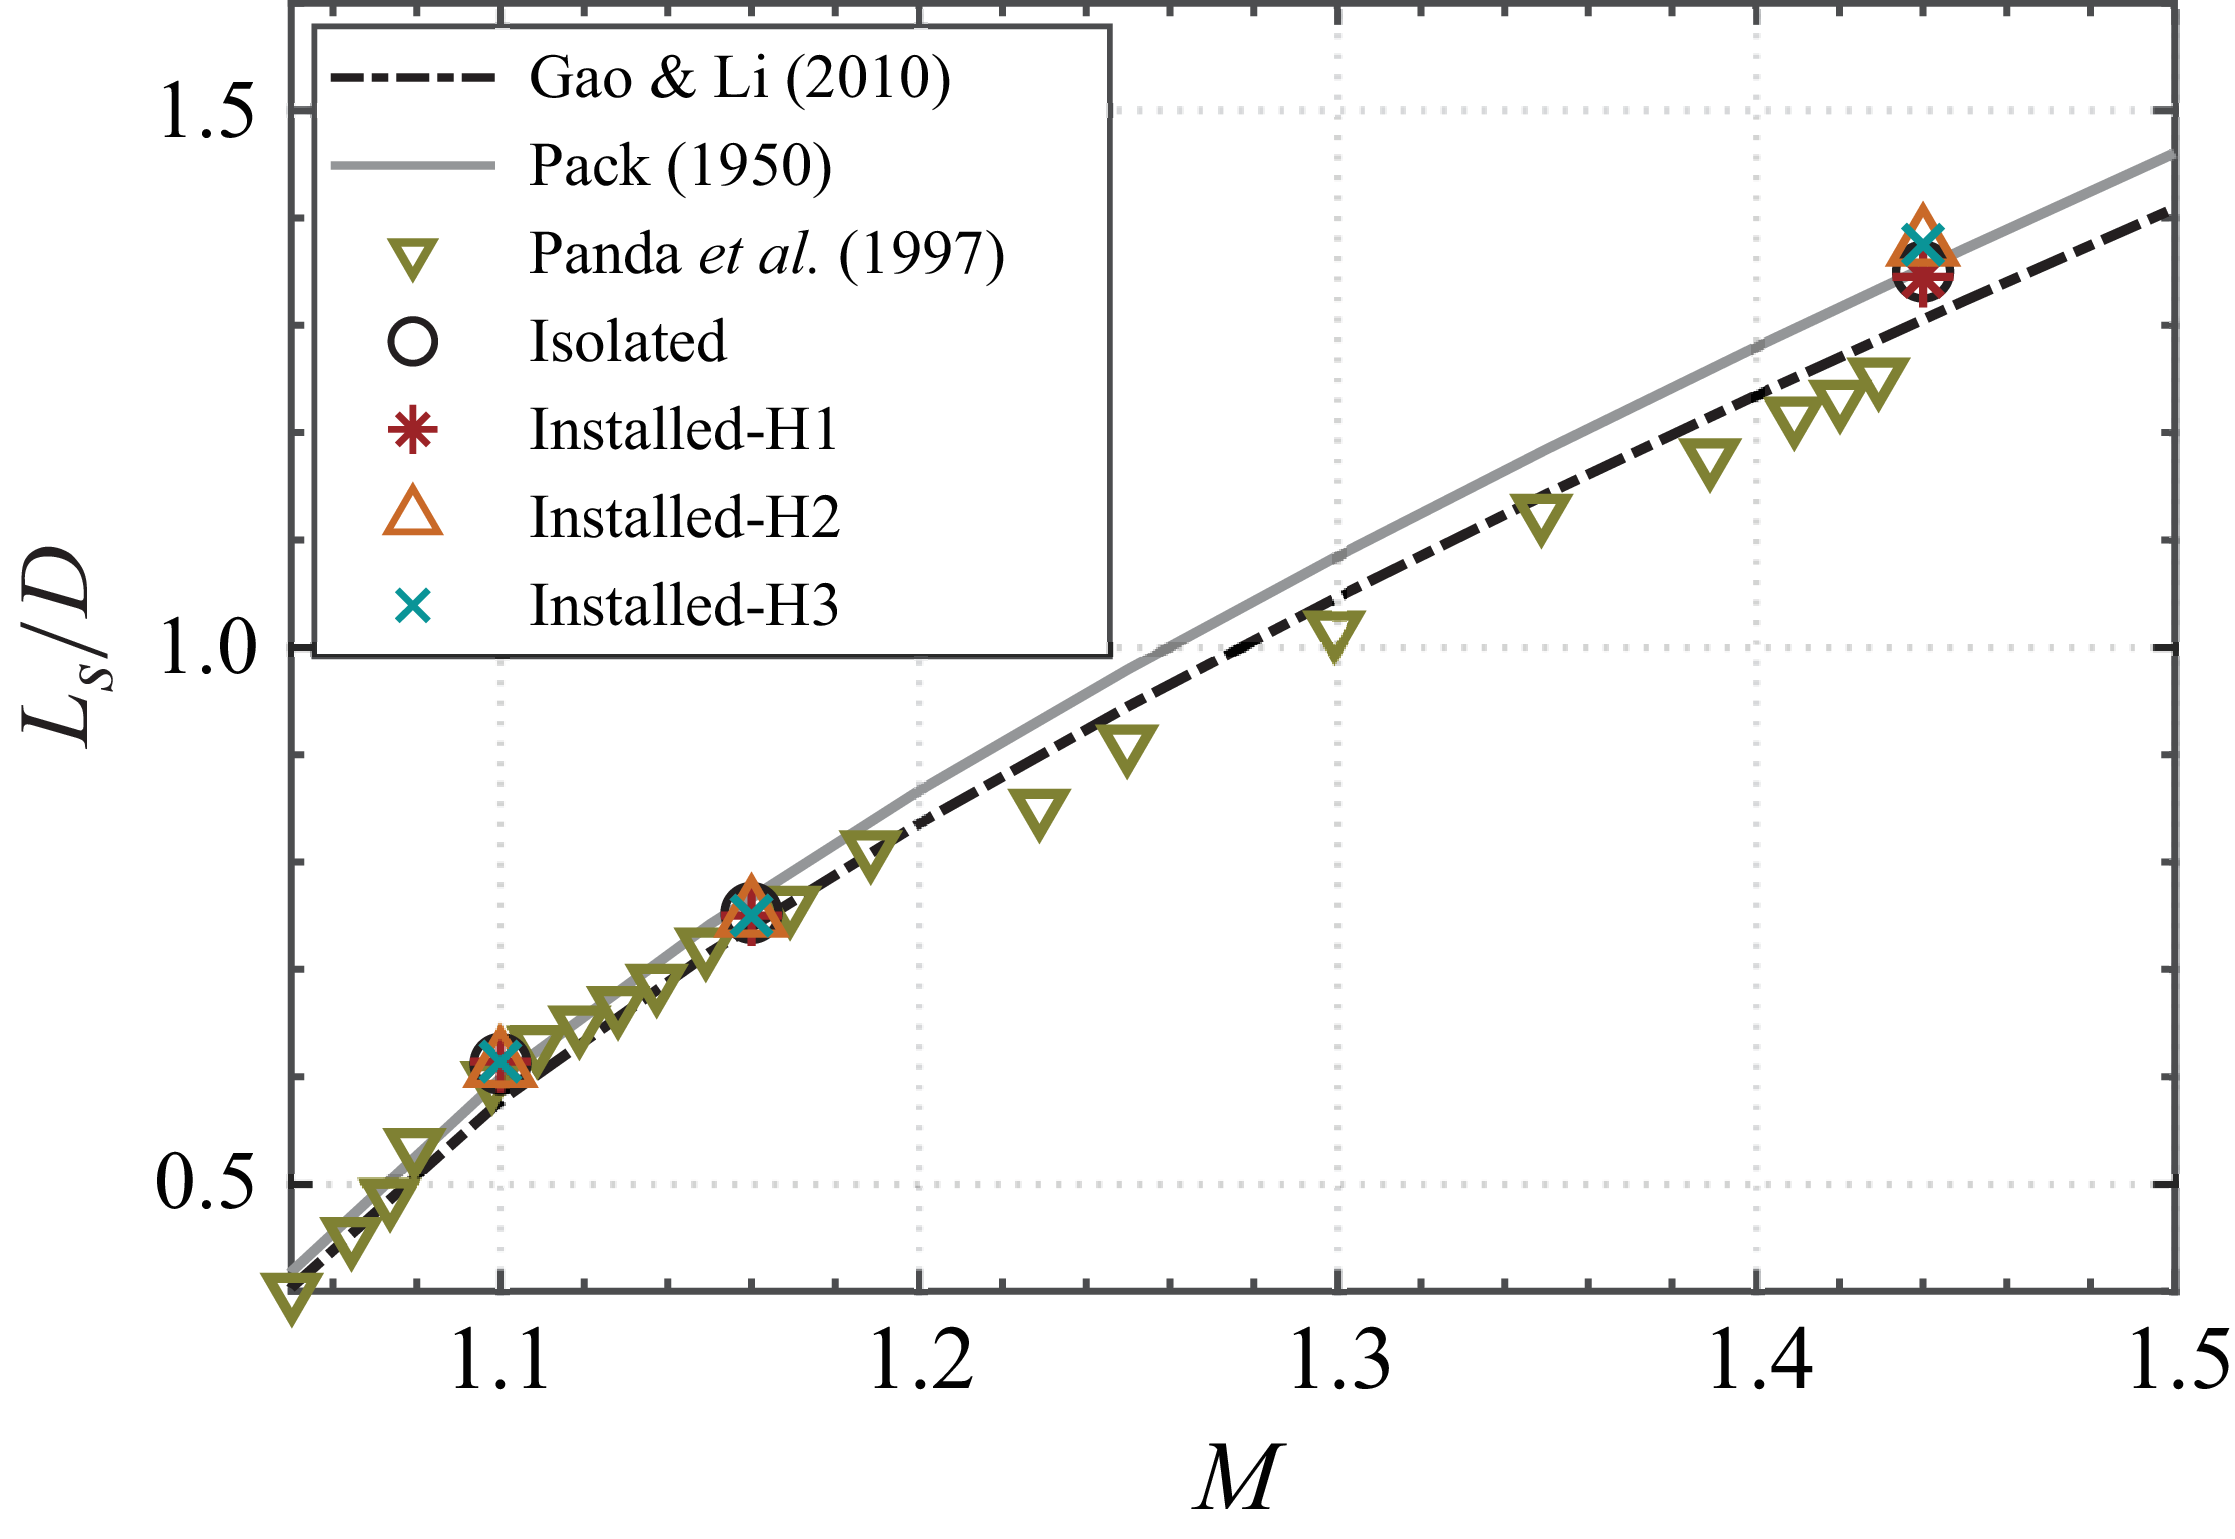
with existing data and predictions. Present measurements are compared with experimental data from Li et al. (Reference Li, Zhang, Hao and He2020), Edgington-Mitchell et al. (Reference Edgington-Mitchell, Wang, Nogueira, Schmidt, Jaunet, Duke, Jordan and Towne2021), Mancinelli, Meloni & Camussi (Reference Mancinelli, Meloni and Camussi2024), along with predictions from Gao & Li (Reference Gao and Li2010). The identified screech modes in the present study correspond to mode A1 at M1 = 1.1, mode A2 at M2 = 1.16 and mode C at M3 = 1.44.

The far-field results show a broadband spectrum at low
 $St$
and characteristic peaks and a broadband hump at high
 $St$
related to screech and BBSAN, respectively. The Strouhal numbers corresponding to the fundamental screech tones are extracted and presented as M-
 $St$
variations (see figure 6), with comparisons made to existing literature to identify the screech modes. The results for the isolated jet (see figure 5
a) show distinct peaks at Mach numbers (M1 = 1.1 and M2 = 1.16) that could be attributed to axisymmetric screech modes A1 and A2 (Gao & Li Reference Gao and Li2010; Edgington-Mitchell Reference Edgington-Mitchell2019; Li et al. Reference Li, Zhang, Hao and He2020; Edgington-Mitchell et al. Reference Edgington-Mitchell, Wang, Nogueira, Schmidt, Jaunet, Duke, Jordan and Towne2021; Mancinelli et al. Reference Mancinelli, Meloni and Camussi2024). At under-expanded jet Mach numbers of M1 = 1.1 and M2 = 1.16, the distinct axisymmetric screech mode is observed at
 $St=0.585$
and
 $St=0.55$
, respectively. In the case of the installed jet configuration shown in figure 5(b), the screech Strouhal number is not significantly affected. The BBSAN showed a marginal increase in magnitude for the installed jet. As the Mach number is increased to M3 = 1.44, the fundamental screech tone is present at a Strouhal number of
 $St=0.26$
(screech mode C) (Panda Reference Panda1998; Gao & Li Reference Gao and Li2010; Edgington-Mitchell et al. Reference Edgington-Mitchell, Oberleithner, Honnery and Soria2014; Edgington-Mitchell et al. Reference Edgington-Mitchell, Wang, Nogueira, Schmidt, Jaunet, Duke, Jordan and Towne2021). Furthermore, the spectra indicate the presence of the broadband hump characteristic of BBSAN, which is pronounced at this Mach number (Tam Reference Tam1995). When considering the installed jet configuration, the screech Strouhal number remains largely unaffected. Similar results were reported for a supersonic rectangular (Seiner et al. Reference Seiner, Manning and Jansen1987; Baier et al. Reference Baier, Karnam and Gutmark2020) and axisymmetric (Ahuja et al. Reference Ahuja, McCaulley and Tam1989; Clem et al. Reference Clem, Brown and Fagan2013) jet screech under installed conditions with
 $H/D \geqslant 1$
, where the screech tone frequency remained consistent with that of the isolated jet. The persistence of the screech tone, even at small plate heights, is attributed to the fundamental nature of the screech feedback mechanism. The dominant frequency of the feedback loop is primarily governed by the jet’s shock-cell structure downstream of the nozzle and the upstream-propagating acoustic waves. Although the interaction with the nearby plate at H1 significantly alters the overall acoustic field, resulting in increased SPL levels for both broadband and tonal components and the appearance of additional peaks alongside the fundamental screech tones (Ahuja et al. Reference Ahuja, McCaulley and Tam1989; Wlezien Reference Wlezien1989) due to the jet–plate interaction, the initial shock cells and the primary acoustic feedback path governing the
 $St = 0.26$
screech mode appear to remain stable under these conditions.
3.2. Influence of plate height on installed jet noise
This section examines the installed jet noise spectra for various plate positions and compares them with the isolated configuration. Experiments were conducted at under-expanded jet Mach numbers of M2 = 1.16 and M3 = 1.44, as depicted in figures 7(a) and 7(b), respectively. The installed jet noise spectra are analysed to evaluate the influence of varying plate heights on installation noise and the generation of screech tones (Seiner et al. Reference Seiner, Manning and Jansen1987; Ahuja et al. Reference Ahuja, McCaulley and Tam1989; Obase & Nakamura Reference Obase and Nakamura2004; Ibrahim et al. Reference Ibrahim, Sawai, Obase, Mori and Nakamura2009; Nakkala & Srinivasan Reference Nakkala and Srinivasan2023). Understanding these effects is critical for developing effective noise mitigation strategies. To this end, a range of plate heights (H1, H2 and H3) is examined, with H1 corresponding to the plate position nearest to the jet exit and H3 being the farthest.
Sound pressure level spectra comparison for the isolated and installed jets at various plate heights at Mach numbers of (a) M2 = 1.16 and (b) M3 = 1.44.

The SPL spectra for the isolated configuration tested at Mach number M2 = 1.16 (see figure 7
a) exhibit a distinct peak for the fundamental screech tone (
 $f_s$
) at
 $St = 0.55$
and its harmonics at
 $St = 1.1$
. Similarly, the spectra for the various installed jet configurations tested at the same Mach number display distinct peaks at the same Strouhal number. Additionally, a substantial increase in the low frequency (
 $0.02 \leqslant St \leqslant 0.5$
) is observed. The low-frequency amplification observed is directly dependent on the plate height, whereby a decrease in plate height leads to an increase in the amplification. This increase is primarily attributed to enhanced trailing-edge scattering of large-scale hydrodynamic instability waves. As the plate moves closer to the jet, a greater portion of the jet’s energetic near field interacts with the plate surface and its trailing edge, resulting in efficient conversion of hydrodynamic fluctuations into far-field acoustic radiation. These observations align with previous studies (Cavalieri et al. Reference Cavalieri, Jordan, Wolf and Gervais2014; Meloni et al. Reference Meloni, Proença, Lawrence and Camussi2021), despite the use of significantly higher jet velocity in this current study.
A key mechanism governing the amplitude of screech is the interference between the direct screech feedback loop and the acoustic waves reflected from the plate surface. As demonstrated by Baier et al. (Reference Baier, Karnam and Gutmark2020), the plate’s offset distance relative to the screech wavelength determines whether this interference is constructive or destructive, leading to significant amplification or mitigation of the screech tones in the presence of a plate.
The maximum increase in noise at the fundamental screech tone (
 $St = 0.55$
, screech mode A2) is observed to be about 5 dB for the farthest plate height H3, with a slight decrease in
 $St$
compared with the isolated jet. This increase in screech amplitude (Ahuja et al. Reference Ahuja, McCaulley and Tam1989; Ibrahim et al. Reference Ibrahim, Sawai, Obase, Mori and Nakamura2009; Baier et al. Reference Baier, Karnam and Gutmark2020; Nakkala & Srinivasan Reference Nakkala and Srinivasan2023) can be primarily attributed to the interference between the direct screech feedback and the acoustic wave reflected from the plate (Baier et al. Reference Baier, Karnam and Gutmark2020). The screech wavelength is calculated as
 $\lambda _s = c/f_s$
, where
 $c$
denotes the speed of sound and
 $f_s$
the screech frequency; under the present conditions, this yields
 $\lambda _s \approx 0.0267\,\text{m}$
. At H1, the SPL of the screech tone exhibits a slight increase due to the enhanced interaction between the jet structure and the nearby plate. For this configuration (
 $H/D=1$
,
 $H/\lambda _s \approx 0.63$
), the increase is further attributed to constructive interference, where the screech wavelength corresponds to
 $\approx 1/2\lambda _s$
(Baier et al. Reference Baier, Karnam and Gutmark2020), along with strong hydrodynamic and acoustic interactions, including induced jet oscillations that can couple with the screech mechanism. At the intermediate plate position H2 (
 $H/D = 1.5$
,
 $H/\lambda _s \approx 0.95$
), the decrease in screech amplitude results from destructive interference, as the path length approaches one screech wavelength (
 $\lambda _s$
). At the furthest plate height H3 (
 $H/D = 2.5$
,
 $H/\lambda _s \approx 1.58$
), the observed amplification is due to constructive interference, which occurs when the path height corresponds to
 $\approx 3/2\lambda _s$
. Interestingly, the amplitude of the fundamental screech tone increases substantially as the plate is moved away from the jet flow. This observation is thus a direct consequence of the phase relationship, determined by the plate position relative to
 $\lambda _s$
, leading to alternating constructive and destructive interference of the screech feedback, aligning with previous findings by Baier et al. (Reference Baier, Karnam and Gutmark2020).
This interference-driven modulation is also reflected in the behaviour of the screech harmonic (
 $St = 1.1$
), which shows a significant
 $\approx 4$
dB increase at the plate at the farthest location H3 compared with the isolated jet case. The amplification of the harmonic at H3 likely results from the stronger fundamental screech tone enhancing nonlinear interactions, with possible additional constructive interference for the harmonic component itself. This evidence of plate-induced noise is demonstrated by the presence of tones with an increase of approximately 5 dB at
 $St = 1.63$
(
 $3f_{s}$
) compared with the isolated jet spectrum.
The far-field acoustic results for the under-expanded jet Mach number M3 = 1.44 are presented in figure 7(b). On comparing the spectra of the isolated and installed configurations, it is observed that the screech tones appear in both spectra as expected in line with previous studies by Seiner et al. (Reference Seiner, Manning and Jansen1987). The fundamental screech tone (
 $f_s$
) is observed at
 $St = 0.26$
and the corresponding harmonic at
 $St = 0.52$
. Moreover, a plate-induced distinct tonal peak is observed at
 $St = 0.22$
for all the tested installed configurations. This rich spectral behaviour results from a combination of shock-associated noise and plate-induced noise. The proximity of the plate to the jet results in a significant increase in broadband noise across the entire frequency range (
 $St$
). Furthermore, the broadband noise levels are found to be highest at H1 and decrease as the plate is moved away from the jet.
Wlezien (Reference Wlezien1989) demonstrated that, for axisymmetric jets, the influence of an installed plate on the amplitudes of the B and C screech modes is strongly dependent on the plate height
 $H/D$
. This dependence arises from the amplification of jet oscillations caused by wall reflections. Closer examination of the installed configuration at M3 = 1.44 reveals a 3 dB SPL increase at the fundamental screech tone (
 $St = 0.26$
, screech mode C) for H1. The jet’s proximity to the plate amplifies noise levels at screech harmonics, with
 $\approx 4$
dB observed at
 $St = 0.52$
for the smallest plate height H1. The observed increase is due to constructive interference occurring when the plate height is approximately
 $0.38 \lambda _s$
, where the screech wavelength is
 $\lambda _s \approx 0.04425$
m. At the intermediate height H2, the screech tones are higher than those of H1, suggesting the presence of constructive interference, which is consistent with the plate height being approximately equal to
 $\approx 1/2 \lambda _s$
. At the farthest plate position, H3, the magnitude of the fundamental screech tone remains comparable to that of the isolated jet, while the screech harmonic at
 $St = 0.52$
is suppressed by
 $\approx 5$
dB. The jet–plate separation at H3 is nearly equal to one screech wavelength (
 $\approx \lambda _s$
), resulting in the reflected wave arriving at the nozzle lip out of phase with the direct feedback wave. This phase relationship leads to destructive interference, thereby disrupting the constructive feedback required to sustain high-amplitude screech (Baier et al. Reference Baier, Karnam and Gutmark2020). Interestingly, the behaviour of the higher harmonics highlights the importance of nonlinear effects in the jet–plate interaction. At H1, the intense near-field interaction results in prominent harmonics. Conversely, at H2, the resonance is likely linear, the fundamental tone transferring very little energy to its harmonics, which are consequently absent. Finally, at H3, the suppression of the fundamental tone eliminates the harmonics.
The results reveal distinct plate-induced tones across all tested plate heights, consistent with the established mechanisms outlined in earlier studies by Zaman et al. (Reference Zaman, Fagan, Bridges and Brown2015) and Tam & Chandramouli (Reference Tam and Chandramouli2020). The frequency calculations for the plate-induced tones (
 $f_p$
) are detailed in Appendix A, leveraging the upstream and downstream feedback mechanisms described in Tam & Chandramouli (Reference Tam and Chandramouli2020). These mechanisms, including the KH instability waves and their interaction with upstream acoustic waves, confirm the experimentally observed tonal Strouhal numbers. The derived frequencies match closely with the theoretical predictions for feedback mechanisms in jet–plate interaction tones, further validating the framework of Tam & Chandramouli (Reference Tam and Chandramouli2020).
It is important to acknowledge the coexistence of these specific plate-induced resonant tones (
 $f_p$
) with general trailing-edge noise, which arises from the scattering of hydrodynamic pressure fluctuations and turbulent eddies at the plate’s edge. This latter mechanism contributes to broadband noise amplification, especially at low frequencies, as discussed earlier in connection with the increased noise at reduced plate heights. The plate-induced tones (
 $f_p$
), however, are distinguished by their origin in a resonant feedback loop involving the entire plate length
 $L$
, as detailed in Appendix A, leading to predictable discrete frequencies. While both phenomena radiate from the trailing edge, the
 $f_p$
tones are directly governed by the
 $L$
-dependent resonance.
Experimentally observed screech, plate-induced and interaction tones in Strouhal number for isolated and installed configurations at M3.
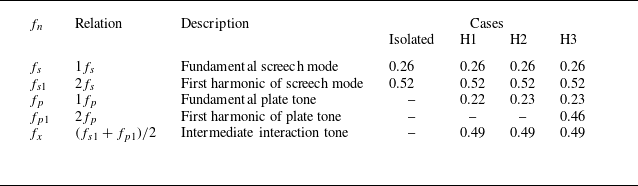
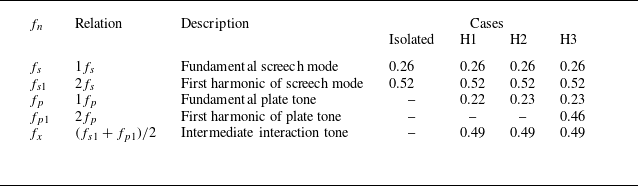
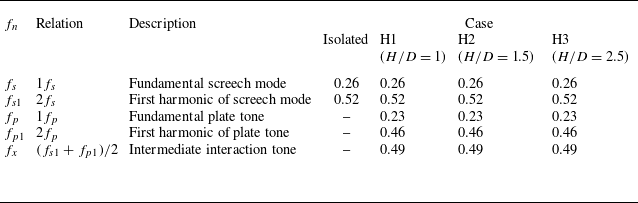
A summary of the observed Strouhal numbers and their origins is presented in table 2, which illustrates the interaction between the fundamental screech mode and plate-induced feedback. The dominant screech tones (
 $f_s$
) and their harmonics (
 $f_{s1}$
) are attributed to interactions between shock-cell structures and upstream-travelling acoustic waves, consistent with the classical screech loop described by Powell (Reference Powell1953) and later expanded upon by Edgington-Mitchell et al. (Reference Edgington-Mitchell, Li, Liu, He, Wong, Mackenzie and Nogueira2022). The inclusion of a plate introduces a secondary feedback loop, evident in the plate tones (
 $f_p$
) and their harmonics (
 $f_{p1}$
), also supported by Tam & Chandramouli (Reference Tam and Chandramouli2020). The first harmonic of the plate tone (
 $f_{p1}$
) is prominently observed for H3 (
 $H/D$
= 2.5), coinciding with the suppression of the screech tone. In contrast, for H1 and H2,
 $f_{p1}$
is almost absent, with the screech tones remaining normal and prominent. Furthermore, the tonal components and their shifts with plate height emphasise the influence of upstream-propagating neutral wave modes on the feedback loop, a key feature of the mechanism shown in Tam & Chandramouli (Reference Tam and Chandramouli2020). The persistence of these tones is indicative of a well-established feedback path supported by the jet’s acoustic wave modes.
It should be noted that the SPL at
 $St = 0.22$
(
 $f_p$
) for the H1 configuration is lower than that observed for the farthest plate height H3 but higher than the H2 configuration. This is unexpected, as the amplitude of the plate-induced tone is typically expected to be higher at the smallest plate height due to stronger interaction with the jet, and lower at larger heights where interaction with the jet flow is minimal. This discrepancy is resolved by examining the wall-pressure spectra as detailed in Appendix C, where in figure 26 the amplitude of the plate-induced tone is highest for H1 as apparent near the trailing edge and gradually decreases as the plate height increases.
A significant insight from this study is the identification of the intermediate interaction tone
 $f_{x}$
, which arises from the interaction between the harmonics of the screech and plate tones. These tones exemplify the complex nonlinear coupling and energy exchange between the two feedback mechanisms. The interaction tone calculated as
 $(f_{s1} + f_{p1})/2$
appears at
 $St$
= 0.49 across H1, H2 and H3. However, while
 $f_{p1}$
is absent in H1 and H2, only the interaction tones are observed in these configurations. This intermediate frequency is indicative of a hybridised feedback loop, where the overlapping acoustic and hydrodynamic interactions between the screech and plate mechanisms create a coupled resonance condition.
These results highlight the intricate interplay between screech and plate-induced feedback mechanisms, where reflective boundaries modify the acoustic environment, enabling new tonal components. The sensitivity of tone generation to phase alignment and boundary proximity provides critical insights into tonal coupling and resonance in supersonic jets.
3.3. Hydrodynamic and acoustic interactions in near field
Surface pressure fluctuations were measured to investigate the hydrodynamic and acoustic loading on the plate, with results examined for various installed positions. The results for the surface pressure fluctuation at various plate heights (
 $H/D$
) at Mach numbers M2 = 1.16 and M3 = 1.44 are presented in figure 8. Different columns in figure 8 represent different Mach numbers, while different rows represent different plate heights. The surface pressure fluctuations are compared for the various streamwise positions
 $x/D$
. The SPL at K1 is presented close to the nozzle lip, and each consecutive measurement location is spaced at
 $1.1D$
, with K4 positioned at a distance of
 $1D$
just ahead of the trailing edge, as shown in figure 3. Based on the Schlieren visualisations in § 3.5, the jet exhibits a spreading half-angle of approximately
 $7^\circ$
(see figure 24). The jet boundary was extracted using the standard deviation of time-resolved Schlieren images, as described in Appendix C. The extracted boundaries provide a clear depiction of the jet development and its interaction with the plate, which are discussed in detail. The subsequent development of the jet and its interaction with the plate are discussed in § 3.5. For the H2 (
 $H/D$
= 1.5) and H3 (
 $H/D$
= 2.5) configurations (
 $H/D \gt 1.5$
), the plate surface is placed well outside the shear layer. In contrast, for
 $H/D = 1$
, the jet shear layer appears to impinge on the plate surface near
 $x/D \approx 4$
.
A comparison of near-field spectra at different plate locations and heights for (a,c,e) M2 = 1.16 and (b,d,f) M3 = 1.44. The spectra confirm the presence of the screech mode A2 at M2 = 1.16 for all installed plate conditions. At M3 = 1.44, the spectra exhibit both the screech mode C and the plate-induced tonal component.

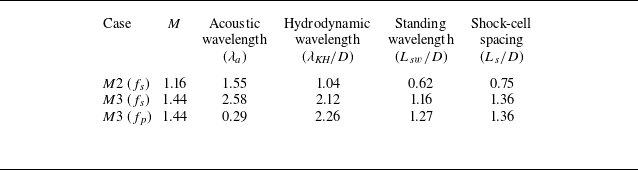
A quantitative framework for the analysis of the near-field pressure measurements is provided by first establishing the characteristic length scales of the flow, which are presented in table 3. Following the physical model established by Panda (Reference Panda1999), the near field of a screeching supersonic jet is not characterised by a simple decaying hydrodynamic field, but rather by the strong interference between downstream-propagating instability waves (with hydrodynamic wavelength
 $\lambda _{\textit{KH}}/D$
) and upstream-propagating acoustic waves (with acoustic wavelength
 $\lambda _{a}/D$
).
Length scales relevant to the jet near field.
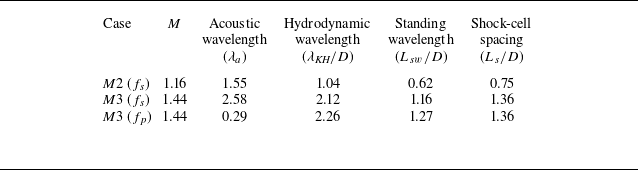
This interference results in a quasi-periodic standing wave pattern, which dominates the pressure field adjacent to the jet. The characteristic length of this pattern, the standing wavelength (
 $L_{sw}/D$
), is therefore the most critical parameter governing the jet–plate interaction. It represents the distance between the repeating high-pressure crests in the near field. The intensity of the interaction measured by the wall-mounted Kulite pressure transducers is thus expected to be highly sensitive to the placement of the plate and the location of the probes relative to these high-amplitude pressure crests. Furthermore, this standing wave system is anchored to the underlying shock-cell structure, whose average spacing (
 $L_{s}/D$
) is also listed for reference.
For supersonic jets, the influence of the trailing edge in modifying the acoustic field differs fundamentally from its well-documented behaviour in subsonic configurations. For subsonic jets, the region bordering the nozzle is characterised by a linear hydrodynamic near field, where pressure fluctuations are broadband and decay exponentially with distance from the jet. When a plate intrudes into this field, the trailing edge acts as a scattering point for these large-scale turbulent structures. This scattering mechanism is an inefficient radiator for the hydrodynamic fluctuations themselves, but becomes a highly efficient source of low-frequency acoustic noise (Ffowcs Williams & Hall Reference Ffowcs Williams and Hall1970). The flow physics undergoes a fundamental change in the presence of the under-expanded supersonic jet. The hydrodynamic near-field transitions to a strongly tonal field, structured by the screech resonance mechanism. This creates a periodic standing wave along the jet axis, formed by the interference of downstream-propagating instability waves and upstream-propagating acoustic waves (Tam & Hu Reference Tam and Hu1989; Panda Reference Panda1999). Consequently, the trailing edge does not interact with a decaying broadband field, but rather with a robust, spatially organised tonal system.
The wall-pressure spectra in figure 8 for the under-expanded jet Mach number M2 = 1.16 at the closest plate height, H1, exhibit strong tonal components superimposed on a broadband energy level that rises with downstream distance. The overall energy level within the spectrum shows a significant increase as the streamwise position progresses, with a maximum increase of up to 20 dB at K4 in comparison to K1 at
 $St\lt 0.4$
. This energy increase is associated with the interaction of the jet boundary with the plate trailing edge in the H1 configuration, occurring at about
 $x/D \approx 4$
. However, as established previously, the energy field around the jet is dominated by coherent resonant modes rather than a simple evanescent field in supersonic jets (Panda Reference Panda1999). Therefore, the behaviour at the trailing edge (K4) is particularly complex, as it involves not only the flow interaction noise and broadband turbulent pressure field scattering but also the direct interaction of these coherent resonant modes with the trailing edge. As the plate height is increased, the disparity in SPL between K1 and K4 gradually decreases for H2 and H3, demonstrating a difference of about 17 dB and 12 dB, respectively. This overall reduction is anticipated, as the strength of the trailing-edge source is highly sensitive to the plate’s proximity due to the exponential decay of the hydrodynamic wavepackets with radial distance (Cavalieri et al. Reference Cavalieri, Jordan, Wolf and Gervais2014; Baier et al. Reference Baier, Karnam and Gutmark2020). By moving the plate further from the jet, it enters a region where the incident pressure field is weaker, eventually transitioning into the purely acoustic field where scattering effects are negligible (Suzuki & Colonius Reference Suzuki and Colonius2006).
An important observation is found in the behaviour of the primary screech tone (mode A2) at
 $St = 0.54$
. This tone is present at all streamwise positions (K1–K4) for M2 = 1.16 as seen in figure 8 and 25. While the SPL levels for upstream locations (K1 to K3) are similar, a significant and abrupt decrease in the screech tonal amplitude is observed specifically at the trailing-edge probe, K4, dropping by about 10 dB for the H1 case (Meloni et al. Reference Meloni, Centracchio, de Paola, Camussi and Iemma2023). From table 3, the standing wavelength for M2 = 1.16 is
 $L_{sw}/D = 0.62$
. This implies the near field contains pressure crests at periodic intervals. The probe at K4 is therefore positioned in a region of highly structured, periodic forcing, making it highly sensitive to the scattering and interference from the trailing edge. This is a critical observation. Instead of the trailing edge amplifying the near-field energy as would be expected in subsonic scattering, it is actively disrupting the resonant screech mode. This localised amplitude reduction demonstrates that the trailing edge is acting as a scatterer or source of destructive interference for the specific tonal energy of the screech feedback loop, a fundamentally different mechanism from the broadband amplification seen in subsonic jet–plate interactions.
The near-field spectra in figure 8 for the under-expanded jet at Mach number M3 = 1.44 and the closest plate height, H1, reveal strong tonal components superimposed on a broadband energy level. This broadband noise floor rises significantly with downstream distance, a phenomenon attributed to the direct flow interaction at the plate’s trailing edge. As the turbulent structures within the jet’s shear layer impinge upon the edge (see figure 24), a complex interaction occurs, leading to a substantial increase in broadband noise. This effect is most pronounced at the trailing-edge sensor (K4), where the energy level shows an increase of up to 20 dB for
 $St\lt 0.2$
, in comparison to the upstream sensor (K1). At M3, the interaction between the jet and the plate increases the shock-associated noise. The proximity of the plate significantly influences the acoustic signature, creating a complex interplay between the inherent screech tone (
 $f_s$
, mode C), its harmonic (
 $f_{s1}$
) and a plate-induced tone (
 $f_p$
). At the closest plate height H1, a strong coupling between the jet and the plate is evident. The near-field spectrum is dominated by the fundamental screech tone, which peaks at K2–K3 and then decreases in amplitude towards the trailing edge at K4. In contrast, the plate-induced tone at
 $St=0.22$
exhibits significant downstream amplification, with an increase of approximately 8 dB from K1 to K4 close to the trailing edge of the plate. Its growth is strongly guided by the jet’s near field, which is organised into a strong screech standing wave pattern with a characteristic length of
 $L_{sw}/D = 1.16$
. The probes are sampling this growing mode as it draws energy from the mean flow, confirming the plate is an integral part of the resonant system. This spatial amplification confirms the plate’s role as an active component in a coupled resonant system, consistent with the framework proposed by Tam & Chandramouli (Reference Tam and Chandramouli2020). The strong interaction at this height is further highlighted by the presence of a prominent interaction tone (
 $f_x$
), resulting from the nonlinear interaction of the screech and plate-induced tones, as defined in table 2.
At an intermediate plate height H2, the hydrodynamic interaction reduces, although the screech tone remains the dominant acoustic feature. The plate-induced tone is less pronounced but still shows an 8 dB amplification near the trailing edge. The interaction tone (
 $f_x$
), however, is significantly diminished, indicating a reduction in the coupling between the jet and the plate.
The acoustic behaviour changes substantially at the farthest plate height H3, where the screech feedback loop is disrupted. The screech tone is suppressed, and its amplitude monotonically decreases along the plate. This finding aligns with the far-field acoustic spectra discussed earlier, highlighting that the plate position plays a critical role in modulating the screech tone amplitudes. For the installed case at
 $H/D = 2.5$
, the observed attenuation of the screech tone arises from destructive interference effects, consistent with the condition
 $H/\lambda _s \approx 1$
(Baier et al. Reference Baier, Karnam and Gutmark2020). Consequently, the plate-induced tone at
 $St = 0.26$
becomes the dominant feature in the wall-pressure spectra. This shift underscores the critical role of plate height in disrupting the phase relationship required for the screech feedback loop, as noted by Wlezien (Reference Wlezien1989). The absence of the interaction tone at this height further confirms the significant attenuation of the direct hydrodynamic–acoustic coupling.
3.4. Coherence between near- and far-field noise components
In this section a coherence analysis is performed to explain the directional characteristics of the under-expanded installed jets by examining the linear relationship between surface pressure fluctuations at the plate’s trailing edge and the far-field noise radiation. This analysis captures how different noise mechanisms, namely, screech, BBSAN, plate-induced tones and turbulent mixing noise are radiated at various emission angles, thereby providing a comprehensive understanding of the installation effects and directivity trends (Tam Reference Tam1995; Brown Reference Brown2012, Reference Brown2013; Baskaran & Srinivasan Reference Baskaran and Srinivasan2021; Rego et al. Reference Rego, Avallone, Ragni and Casalino2020, Reference Rego, Avallone, Ragni and Casalino2022; Jawahar et al. Reference Jawahar, Karabasov and Azarpeyvand2023; Meloni et al. Reference Meloni, Centracchio, de Paola, Camussi and Iemma2023).
Coherence spectral analysis is employed here to evaluate the linear coupling between the near-plate microphone signal (Kulite K4) and the far-field microphones positioned at emission angles spanning from
 $\theta =55^\circ$
to
 $150^\circ$
. Kulite K4 is chosen for its proximity to the trailing edge (Rego et al. Reference Rego, Avallone, Ragni and Casalino2020), thus allowing a direct examination of the plate’s influence on far-field noise. Additionally, for all installed cases and both Mach numbers examined, the wall-pressure spectra reveal that the K4 transducer, positioned closest to the plate trailing edge, exhibits substantially higher broadband noise levels attributable to jet–plate interaction. Additionally, the tonal components extracted at K4 differ significantly from those at upstream transducer locations, reflecting the local influence of the impinging jet structures. As shown in Appendix C, the jet development results in interaction with the plate in close proximity to the K4 transducer, as depicted in figure 24. The trend of the tonal amplitude for the plate-induced tone at
 $St = 0.22$
does not fully align with the far-field noise spectra when compared with the wall-pressure measurements at the K4 transducer. To better understand this discrepancy and the associated resonance mechanism, coherence analysis between the K4 transducer and the far-field microphones would provide valuable insight. The coherence function (
 $\gamma _{x,y}^{2} (f)$
) is calculated as shown in (3.1), where
 $x$
represents the Kulite signal and
 $y$
denotes the far-field microphone signal:
 \begin{equation} \gamma _{x,y}^{2} (f) = \frac {\mid {\varPhi _{x,y} (f)}\mid ^{2}}{\varPhi _{x,x} (f) \, \varPhi _{y,y} (f)}. \end{equation}
Figure 9 displays the coherence contours for the installed jet at three different plate heights (H1–H3) for two Mach numbers, M2
 $=1.16$
and M3
 $=1.44$
. The contours are plotted as a function of the emission angle (on the xaxis) and the Strouhal number (on the yaxis), and the colour scale is set to highlight coherence values up to 0.5.
Contour maps of coherence spectra at different inlet angles for various installed heights for (a,c,e) M2 = 1.16 and (b,d,f) M3 = 1.44.

For the under-expanded jet at M2, an increase in coherence magnitude for the screech tone (
 $St = 0.55$
) is observed across all emission angles (
 $\theta \approx 55{-}140^\circ$
). However, the coherence of the first harmonic is dominant only at the sideline position of the jet, extending between
 $\theta \approx 80{-}100^\circ$
. This finding is consistent with prior observations of acoustic scattering in supersonic jets, where higher harmonics are pronounced at sideline angles. A high level of coherence for both the screech tone and its first harmonic is detected at all tested plate heights. Furthermore, the BBSAN region in the range
 $St\approx 0.2{-}0.7$
shows elevated coherence for upstream and sideline angles, particularly at the closest plate height H1. This suggests that the plate reinforces the coupling between the shock-cell structures and turbulent fluctuations, thereby enhancing the far-field radiation in those angular regions.
Additionally, increased coherence in the low-frequency regime (
 $St \approx 0.015{-}0.03$
) is observed for M2 = 1.16 across all tested plate heights, with the highest levels occurring at H1. Prior research (Brown Reference Brown2012, Reference Brown2013; Rego et al. Reference Rego, Avallone, Ragni and Casalino2020) has shown that this low-frequency amplification arises from the interaction of the jet’s linear hydrodynamic field with the plate’s trailing edge, leading to the scattering of these near-field disturbances into the far field. However, in the under-expanded supersonic case, this linear hydrodynamic field is superseded by a dominant, tonally dominated near field structured by the screech resonance mechanism (Panda Reference Panda1999). The pronounced low-frequency coherence observed at M2 = 1.16 is a direct consequence of the highly organised, large-scale coherent structures associated with the A2 screech mode dominating the hydrodynamic near field. These structures are efficiently scattered by the plate’s trailing edge into low-frequency far-field noise. As the plate height is raised to H2, coherence in the low-frequency range remains noticeable but is somewhat diminished compared with H1. At H3, this low-frequency coherence further decreases, reflecting a weaker jet–plate interaction at larger plate heights. For plate heights H2 and beyond, a region of high coherence emerges at
 $St \approx 0.9$
at lower inlet angles, indicating that BBSAN mechanisms and additional scattering phenomena can manifest above the fundamental screech frequency when the plate is positioned further from the jet.
Under the under-expanded condition of M3 = 1.44, the coherence contours in figure 9 reveal stronger shock-associated features, which largely overshadow the low-frequency amplification observed at M2. This is a direct reflection of the underlying physics. At M3, the hydrodynamic field is superseded by a high-amplitude, tonally dominated near field structured by the screech resonance mechanism and strong BBSAN. Consequently, the trailing edge interacts not with a decaying broadband field typical of subsonic jets, but with a robust, spatially organised tonal system and a strong broadband shock noise field. This explains why the coherence is concentrated around the screech, plate-tone and BBSAN frequencies. Correspondingly, the increase in low-frequency coherence (
 $St=0.015{-}0.03$
) present at M2 = 1.16 is absent at M3 = 1.44 for all plate heights. Nevertheless, coherence in the broadband range
 $St=0.2{-}0.3$
is found only at H1, supporting the view that near-field hydrodynamic fluctuations are strongly coupled to the far field when the plate is closest to the jet. At M3, screech coherence remains dominant across a broad range of angles, with the strongest coherence observed at sideline and upstream angles. In contrast, lower coherence is noted at downstream angles (
 $\theta \gt 120^\circ$
) due to the predominance of turbulent mixing noise in this region. A stronger coherence level is observed at
 $St = 0.26$
for screech mode C in the H2 configuration, consistent with the expectation that constructive interference at this condition enhances the noise level. It should also be noted that a coherence peak at
 $St = 0.26$
is observed for H3 , despite this tone being weak in the wall-pressure spectra and only marginally present in the far-field spectra in both upstream and downstream directions.
A region of high coherence corresponding to the plate-induced tone is detected at
 $St = 0.22$
, exhibiting a pronounced directional preference toward upstream and sideline angles. The coherence magnitude of this tone is higher for the H1 configuration compared with H2, and comparable to that of H3, with the coherence for H2 and H3 preferentially oriented toward the sideline. This observation further supports the conclusion that trailing-edge effects are significant, as reflected by the higher plate-tone amplitudes observed for H1 in the wall-pressure spectra and the moderate levels of corresponding far-field noise.
3.5. Flow field
To understand the installation effects on the jet’s structure, both the time-averaged flow and its unsteadiness are examined. The mean behaviour is captured by time-averaged Schlieren images (figure 10), while the flow dynamics is quantified using the standard deviation (
 $\sigma$
) of Schlieren image intensity (figure 11). The standard deviation highlights regions of high fluctuation, along the jet centreline,
 $\sigma$
peaks correspond to shock-cell oscillations, while in the shear layer, elevated
 $\sigma$
indicates increased turbulent activity.
Mean fields of Schlieren images of the (a,b) isolated jet, (c,d) installed-H1 (
 $H/D$
= 1), (e,f) installed-H2 (
 $H/D$
= 1.5) and (g,h) installed-H3 (
 $H/D$
= 2.5) jet at (a,c,e,g) M2 = 1.16 and (b,d,f,h) M3 = 1.44. The region downstream of
 $x/D \gt 3$
(indicated by the dotted line) for the installed-H1 case highlights the subtle modification in the mean Schlieren intensity relative to the isolated jet.

Standard deviation profiles along the jet for
 $ r/D = 0$
(a,b) and
 $ r/D = 0.5$
(c,d), corresponding to Mach numbers M2 = 1.16 (a,c) and M3 = 1.44 (b,d).

For the M2 = 1.16 jet, the mean Schlieren images (figure 10, left column) show that the installation has a negligible effect on the shock-cell structure. These results are consistent with the observations reported by Camussi et al. (Reference Camussi, Ahmad, Meloni, de Paola and Di Marco2022), Meloni et al. (Reference Meloni, Centracchio, de Paola, Camussi and Iemma2023) and Mancinelli et al. (Reference Mancinelli, Meloni and Camussi2024). Accordingly, the mean intensity levels are not significantly affected when the jet operates at a distance
 $ H/D \geqslant 1$
. The shock trains in the installed cases (figure 10
c,e,g) closely resemble the isolated jet (figure 10
a), retaining their periodicity. The shock-cell lengths extracted from the mean Schlieren images are plotted in figure 23 for the tested Mach numbers under both isolated and installed conditions. The results show good agreement with existing literature for the isolated jet. Furthermore, it is observed that the presence of the plate at different
 $H/D$
ratios has negligible influence on the shock-cell lengths, which remain comparable to those of the isolated jet, as detailed in Appendix B.
However, the standard deviation (figure 11, left column) reveals substantial differences in the unsteady behaviour. Despite similar mean flow structures, the centreline
 $\sigma$
profiles show substantial amplification of shock-cell unsteadiness for all installed configurations. The
 $\sigma$
peaks representing oscillation strength increase notably for H2 (
 $H/D$
= 1.5) and H3 (
 $H/D$
= 2.5), consistent with acoustic data showing stronger screech amplitude modification at these heights. Similarly, in the shear layer, the
 $\sigma$
grows with increasing plate distance, indicating that the acoustic interference from the plate energises shear-layer turbulence. Thus, while the installation leaves the average shock locations nearly unaffected, it enhances their unsteadiness and dynamic behaviour, which is crucial for sustaining acoustic feedback, yet unseen in mean flow images.
At the M3 = 1.44 condition, the shock-cell structure and wavelength of the installed jets remain nearly identical to those of the isolated jet. While the time-averaged images offer an overview of the flow field, the instantaneous Schlieren movie of the isolated and H1 jet (as seen in the supplementary movie available at https://doi.org/10.1017/jfm.2025.10693) reveals dynamic interactions and highlights the pronounced effects of the plate installation on the jet structure. These dynamic snapshots in the video reveal flow disturbances and interactions that are not apparent in the static mean flow representation, providing deeper insight into the temporal evolution of shock structures under installed conditions. Thus, the time-averaged Schlieren images (figure 10, right column) reveal a weakening and smearing of downstream shock cells beyond
 $x/D \gt 4$
in the H1 installed configurations, compared with the sharper shocks of the isolated jet (figure 10
b). This visual degradation of the shock structure reflects stronger unsteady interactions at higher Mach numbers. For increased plate heights (figure 10
f,h), the shock cells appear to be stable compared with the H1 configuration. However, subtle changes are observed, particularly in the shear layer near the trailing edge (Baier et al. Reference Baier, Karnam and Gutmark2020), where an early breakdown of the shock structure becomes apparent. This effect is pronounced for the M3 = 1.44 case, where installation leads to a noticeable weakening of the shock system in the downstream region. However, for larger plate heights (H2 and H3), the shock-cell structures closely resemble those of the isolated jet.
However, the corresponding
 $\sigma$
distributions (figure 11, right column) show that the peaks related to the shocks are amplified in all installed cases, indicating strengthened shock-cell oscillations. These large fluctuations effectively blur the time-averaged shock features, explaining the observed weakening at H1. Similarly, the shear-layer
 $\sigma$
plots show intense unsteadiness, with increased fluctuation levels across all installation heights. These results confirm that the presence of the plate causes substantial unsteadiness in both the core and shear-layer regions, fundamentally altering the jet’s feedback mechanisms compared with the isolated case.
Axial Fourier transform results computed along the jet centreline
 $ r/D = 0$
demonstrate good agreement with Li et al. (Reference Li, Liu, Hao, Zhang and He2021), Edgington-Mitchell et al. (Reference Edgington-Mitchell, Li, Liu, He, Wong, Mackenzie and Nogueira2022) across the corresponding Mach numbers (a) M2 = 1.16 and (b) M3 = 1.44. The observed peaks correspond to the non-dimensionalised shock-cell wavenumbers.

Figure 12 presents the normalised spatial wavenumber spectra,
 $|\mathcal{F}\{I\}| / \max (|\mathcal{F}\{I\}|)$
of centreline (
 $r/D = 0$
) intensity, plotted against the non-dimensional wavenumber
 $kD$
, where
 $\mathcal{F}\{I\}$
denotes the Fourier transform of streamwise intensity. The spectra in figures 12(a) and 12(b) illustrate the dominant spatial scales for the M2 = 1.16 and M3 = 1.44 conditions, respectively. For the tested Mach numbers and installed plate conditions, variations in shock-cell spacing along the jet axis produce a series of secondary peaks in the wavenumber spectra (Edgington-Mitchell et al. Reference Edgington-Mitchell, Li, Liu, He, Wong, Mackenzie and Nogueira2022). The extracted shock-cell wavenumbers from these spectra are utilised to characterise the guided jet modes, as detailed in § 3.9. For the M2 = 1.16 case, the spectrum is dominated by a peak centred at
 $kD \approx 10$
, representing the wavenumber associated with the first shock cell. Notably, the spectral profiles for the isolated jet and all installed configurations align closely at this peak, indicating that the fundamental spatial scale remains unaffected by the presence of the plate. This invariance is consistent with acoustic measurements showing minimal variation in screech frequency and with time-averaged Schlieren images that revealed stable shock-cell structures across all M2 = 1.16 configurations.
In contrast, the M3 = 1.44 wavenumber spectrum reveals a series of suboptimal peaks, with a dominant peak at
 $kD \approx 5$
, corresponding to the first shock-cell wavenumber. Additional pronounced peaks appear at
 $kD \approx 10$
and
 $kD \approx 14$
, corresponding to the second and third shock-cell wavenumber. Together, these results highlight the plate’s influence in enriching the modal content and altering the coherence structure of the jet at higher Mach numbers. The peaks observed here closely align with the previous studies (Li et al. Reference Li, Zhang, Hao and He2020; Edgington-Mitchell et al. Reference Edgington-Mitchell, Li, Liu, He, Wong, Mackenzie and Nogueira2022).
3.6. Dynamic mode decomposition
Dynamic mode decomposition is an analytical technique used to identify coherent structures associated with specific temporal frequencies from snapshot sequences of numerical or experimental flow fields (Schmid Reference Schmid2010). In this study, DMD is employed to investigate the influence of plate installation on jet flow dynamics across various jet-to-plate distances. Dynamic mode decomposition also enables the extraction of spatial flow structures at the amplified tonal frequencies observed in the far-field acoustic spectra.
To gain insight into the effect of the plate on the jet’s coherent structures, DMD was applied to 10 000 time-resolved Schlieren snapshots for each of the tested configurations. Images for both isolated and installed jet conditions were acquired at a rate of 40 kHz, with a constant time interval. The image intensity in the two-dimensional snapshots varies based on the density gradient (
 $\partial \rho /\partial r \sim {\rm kg\,m}^{- 4}$
) in the jet flow field.
The image intensity field for a single snapshot, represented as a matrix
 $ I^{x \times y}$
, is reshaped into a column vector
 $ I^{xy}$
, where
 $ x$
is the number of pixels in a row and
 $ y$
is the number of pixels in a column. This process is extended to the entire set of snapshots, forming the matrix
 $ i$
:
 \begin{equation} i = \begin{bmatrix} \vdots & \vdots & \vdots \\ i_1 & i_2 & \ldots & i_T \\ \vdots & \vdots & \vdots \end{bmatrix}. \end{equation}
Here
 $ T$
denotes the number of snapshots, and the columns of matrix
 $ i$
are arranged based on the measurement points
 $ (xy)$
, with
 $ i_j \in \mathbb{R}^{xy}$
. Subsequently, two matrices,
 $ X$
and
 $ Y$
, are defined as follows:
 \begin{equation} X = \begin{bmatrix} \vdots & \vdots & \vdots \\ i_1 & i_2 & \ldots & i_{T-1} \\ \vdots & \vdots & \vdots \end{bmatrix}, \qquad Y = \begin{bmatrix} \vdots & \vdots & \vdots \\ i_2 & i_3 & \ldots & i_T \\ \vdots & \vdots & \vdots \end{bmatrix}. \end{equation}
The nonlinear dynamical system is reconstructed through a linear best-fit least-squares approximation, aiming to approximate
 $ Y$
using
 $ AX$
. In this framework, the current snapshots
 $ X$
are transformed into future snapshots
 $ Y$
via the parameter
 $ A$
. This methodology addresses the nonlinear dynamical system by utilising an optimal linear approximation. The optimal representation of matrix
 $ A$
is expressed as
 \begin{equation} \tilde {A} = U^*AU. \end{equation}
Matrix
 $ U$
is computed through the singular value decomposition (SVD) of matrix
 $ X$
, facilitating the low-rank representation of the data, as shown in the following equation:
 \begin{equation} X = U\! \varSigma V^*. \end{equation}
Here,
 $ U$
and
 $ V$
are the left and right singular vectors of
 $ X$
, respectively, with
 $ U \in \mathbb{R}^{xy \times r}$
,
 $ V \in \mathbb{R}^{T \times r}$
and
 $ \varSigma$
being a diagonal matrix of singular values, denoted as
 $ \varSigma \in \mathbb{R}^{r \times r}$
. The symbol
 $ *$
represents the conjugate transpose operation. The parameter
 $ r$
indicates the rank of the reduced SVD approximation to
 $ X$
, determined using the hard-thresholding algorithm proposed by Donoho & Gavish (Reference Donoho and Gavish2013).
The optimal solution for the minimisation problem, resulting in matrix
 $ \tilde {A}$
, is detailed by Schmid (Reference Schmid2010) and Schmid et al. (Reference Schmid, Li, Juniper and Pust2011):
 \begin{equation} \tilde {A} = U^*YV\varSigma ^{-1}. \end{equation}
The DMD modes are obtained from the eigenvectors of the reduced model. Specifically, if
 $ \tilde {V}_j$
and
 $ \tilde {\lambda }_j$
are an eigenvector and eigenvalue pair of
 $ \tilde {A}$
, then
 $ v_j = U \tilde {V}_j$
and
 $ \lambda _j = \tilde {\lambda }_j$
represent the DMD modes and eigenvalues, respectively. The results are presented as the contours of the imaginary part of the DMD modes, providing comprehensive information about the flow dynamics.
Before examining the flow structures, the DMD amplitude spectra are analysed to verify that the dominant frequencies of the coherent structures correspond to the observed acoustic tones, thereby quantitatively validating the link between far-field noise and flow dynamics. Figure 13 presents these spectra for all configurations, where spectral peaks indicate the most energetic and temporally coherent modes in the jet flow.
Energy spectrum of the DMD modes plotted as a function of Strouhal number. Panels (a,c,e,g,i) correspond to M2 = 1.16, while (b,d,f,j) correspond to M3 = 1.44. The DMD spectra confirm the presence of screech mode A2 (
 $St$
= 0.55 and its aliased counterpart at
 $St$
= 0.62) at M2 = 1.16 across all installed plate conditions. For M3 = 1.44, the DMD spectrum reveals both screech mode C (
 $St$
= 0.26) and the plate-induced tonal component (
 $St$
= 0.22). Consistent with the far-field and wall-pressure spectra, the suppression of screech mode C at the H3 (
 $H/D$
= 2.5) configuration is clearly evident.

The DMD modes of isolated (a,b) and installed (e–h) under-expanded jets at the screech mode A2 (
 $St$
= 0.54) are presented at M2 = 1.16. Panels (a,c,e,g) show the spatial structures of the DMD modes, while (b,d,f,h) display the corresponding DMD amplitudes extracted along
 $r/D = -0.5, 0$
and
 $0.5$
.

For the M2 = 1.16 case (figure 13, left column), all the installed configurations exhibit a dominant peak at
 $St \approx 0.54$
, directly corresponding to the A-mode screech tone identified in the far-field measurements (figure 7
a). The consistent presence of this mode across the isolated, H1, H2 and H3 cases indicates that, for M2, the plate primarily modulates the screech amplitude without altering the underlying feedback mechanism as previously observed in the far-field measurements. While the M2 = 1.16 spectra are dominated by the fundamental screech tone at
 $St \approx 0.54$
, a secondary peak consistently appears at
 $St \approx 0.62$
. This peak is attributed to aliasing of the first screech harmonic, unresolved at its true frequency due to the sampling limitations of the Schlieren measurements.
The time-resolved Schlieren data were acquired at 40 kHz, yielding a Nyquist frequency of 20 kHz, corresponding to a Nyquist Strouhal number of approximately 0.86 for M2. Far-field acoustic measurements (figure 7
a) confirm the first screech harmonic at
 $St \approx 1.1$
, which exceeds the Schlieren Nyquist limit. Consequently, aliasing shifts the harmonic to an apparent Strouhal number of
 $|St_{\textit{sampling}} - St_{\textit{harmonic}}| \approx |(2 \times 0.86) - 1.1| = 0.62$
. This predicted aliasing frequency matches the observed secondary peak in the DMD spectra, accounting for its presence and the absence of a peak at the true harmonic frequency.
In contrast, the M3 = 1.44 spectra (figure 13, right column) confirm the presence of complex tonal interactions. The isolated jet (figure 13
b) exhibits the screech tone at
 $St = 0.26$
and its harmonic at
 $St = 0.52$
. A similar aliasing mechanism explains the additional peaks observed in the highly interactive M3-H1 case. For M3, the Schlieren sampling yields a Nyquist Strouhal number of approximately 0.69. Acoustic measurements confirm a third screech harmonic at
 $St \approx 0.79$
and a fourth at
 $St \approx 1.06$
, both exceeding the Nyquist limit. These are aliased to lower apparent frequencies, the third harmonic to
 $|(2 \times 0.69) - 0.79| = 0.59$
and the fourth to
 $|(2 \times 0.69) - 1.06| = 0.32$
. These predicted alias Strouhal numbers align with the additional low-amplitude peaks observed in the DMD spectra, providing a definitive explanation for the complex tonal observation in this configuration.
Most notably, the DMD spectrum for the H3 configuration at M3 = 1.44 provides direct evidence of the suppression of the screech tone and the emergence of a dominant plate-induced tone previously identified in the far-field acoustics. The flow-field analysis (figure 13
h) reveals complete suppression of the screech tone at
 $St = 0.26$
, with the spectrum instead dominated by an energetic mode at
 $St = 0.22$
and its harmonic at
 $St \approx 0.44$
. This result fully corroborates the acoustic measurements (figure 7
b), which similarly showed suppression of screech and the emergence of a dominant plate-induced tone at the same Strouhal number.
Figures 14 and 16 present the results for Mach numbers M2 = 1.16 and M3 = 1.44, respectively. In each figure the left column shows contour plots of the coherent structures, represented by the real part of the DMD mode for the screech tone. The right column displays the corresponding DMD amplitude distributions along the shear layers and centreline. Results for different plate heights are shown in separate rows. The isolated condition’s results are shown in the first row for reference and comparison. Coherent structures associated with the screech mode generally show jet structures embedded with wavepackets in the shear layers, as noted in a previous study (Jordan & Colonius Reference Jordan and Colonius2013). It is important to note that the wavepackets are expected to exhibit a symmetric structure at M2 = 1.16 and an anti-symmetric structure at M3 = 1.44. However, in the Schlieren images, the observed colour distributions between the upper and lower shear layers appear reversed. This discrepancy arises from the use of a horizontal knife edge in the Schlieren set-up, which makes the system sensitive exclusively to the radial component of the density gradient.
In the isolated configuration for M2, the DMD modes reveal periodic shock-cell structures extending downstream from the nozzle, exhibiting symmetry in the magnitude between the upper and lower shear layers. These periodic shock cells contribute to the screech tone generation through a feedback mechanism between the nozzle lip and the shear layer. However, when the plate is introduced at different heights, significant changes in the lower shear layer are observed. In figure 14(b) the DMD amplitude indicates a symmetric flow, characterised by nearly equal amplitudes in the upper and lower shear layers. The mode amplitudes grow from the nozzle exit, peak between
 $x/D = 2{-}4$
with the saturation point at
 $x/D \approx 3.3$
, and decay downstream, which is typical of the build-up of coherent structures through vortex roll-up and pairing, followed by their eventual breakdown and transition to turbulence (Tam Reference Tam1995; Panda Reference Panda1999). Centreline amplitudes remain low, indicating energy concentration within the shear layers. This symmetric growth and decay pattern is also evident in the harmonic mode (see figure 15). The low amplitudes along the centreline in both modes suggest that the energy is primarily confined to the shear layers. However, in the harmonic mode, the shear layers exhibit wavepackets of much smaller spatial scale.
The DMD modes of isolated (a,b) and installed (e–h) under-expanded jets at the harmonic of the screech mode A2 (
 $St$
= 0.62, aliased frequency) are presented at M2 = 1.16. Panels (a,c,e,g) show the spatial structures of the DMD modes, while (b,d,f,h) display the corresponding DMD amplitudes extracted along
 $r/D = -0.5, 0$
and
 $0.5$
.

Introducing the plate at H1 leads to a substantial amplification of energy in the lower shear layer, particularly between
 $x/D = 2{-}4$
, with the saturation point at
 $x/D \approx 3.3$
. The interaction between the reflected acoustic waves from the plate and the shear layer introduces potential standing waves (see
 $y/D\approx -0.75$
) (Westley & Woolley Reference Westley and Woolley1969), which trap energy and lead to an intensification of coherent structures near the plate. The asymmetry in the mode amplitudes becomes apparent with the plate installation, as seen in figure 14(b). A noticeable increase in amplitude is observed in the lower shear layer between
 $x/D = 2$
and
 $4$
, compared with the upper shear layer. In the case of the screech harmonic and its amplitude, shown in figures 14(b) and 15(b), respectively, the asymmetry becomes even more pronounced. For the harmonic mode, the energy is considerably higher within the lower shear layer.
As the plate height increases to H2, the energy in the lower shear layer remains high similar to that of H1 (see figures 14
c and 14
d), suggesting that the acoustic reflection still plays a significant role in disrupting the wavepackets (Ahuja et al. Reference Ahuja, McCaulley and Tam1989; Baier et al. Reference Baier, Karnam and Gutmark2020) with the saturation point at
 $x/D \approx 3.3$
. Despite the increased distance from the plate, its influence on the flow dynamics persists, corresponding to the moderately elevated broadband noise levels previously observed in figure 7.
As the plate height increases to H2, the energy in the lower shear layer remains high and asymmetric for both the fundamental and harmonic modes, similar to that of H1. This suggests that the acoustic reflection still plays a significant role in disrupting the wavepackets, with the saturation point for the fundamental mode still occurring at
 $x/D \approx 3.3$
. Despite the increased distance from the plate, its influence on the flow dynamics remains evident. This influence affects both the fundamental and harmonic modes and corresponds to the moderately elevated broadband noise levels observed earlier.
At the largest plate height, H3, the plate continues to influence the lower shear layer, where the energy levels remain higher than in the upper shear layer. This is further supported by the DMD amplitude shown in figure 14(e), where the peak amplitude occurs at
 $x/D = 2.3$
, which is earlier than in both the isolated and other installed configurations. Additionally, the upper shear layer exhibits a relatively lower amplitude difference from the centreline, unlike the other cases. The constructive acoustic feedback at H3 forces the instability wave substantially in the lower shear layer. As a result, the instability undergoes accelerated growth, reaching its saturation point much earlier and further upstream, followed by an earlier transition into turbulence. This indicates that acoustic reflections still interact with the lower shear layer (Baier et al. Reference Baier, Karnam and Gutmark2020). The effects of constructive feedback are also clearly evident in the screech harmonic, which shows a similarly disproportionate amplification in the lower shear layer. This further reinforces the presence of an efficient acoustic feedback mechanism.
In the investigation of the under-expanded jet at M3, the dominant DMD mode reveals prominent shock-cell patterns and larger coherent structures, exhibiting a fundamental peak at
 $St = 0.26$
, as shown in figure 16. The isolated configuration shows alternating compression and expansion waves forming periodic, symmetrical shock cells between the upper and lower shear layers, creating the characteristic diamond pattern. In contrast, the energy levels within the shear layer wavepackets are comparatively lower. As expected, the DMD amplitude reveals similar magnitudes for both the upper and lower shear layers, while the centreline exhibits the highest amplitude due to the presence of highly energetic shock cells. The amplitude along the centreline grows steadily and reaches a sharp peak near the trailing edge at
 $x/D\gt 5$
. The corresponding screech harmonic at
 $St = 0.52$
also exhibits this symmetry, displaying the expected finer-scale wavepacket structures characteristic of a higher-frequency mode.
The DMD modes of the isolated (a,b) and installed (e–h) under-expanded jets at the screech mode C (
 $St = 0.26$
for H1 (
 $H/D$
= 1) and H2 (
 $H/D$
= 1.5)) are presented at M3 = 1.44. Panels (a,c,e,g) show the spatial structures of the corresponding DMD modes, while (b,d,f,h) display the extracted DMD amplitudes along
 $r/D = -0.5,\,0,\,0.5$
. Panel (h) specifically highlights the mode at
 $St = 0.22$
, for H3 (
 $H/D$
= 2.5), associated with the plate-induced tone.

In the installed configuration at H1 and H2, the proximity of the plate leads to a loss of symmetry between the upper and lower shear layers and high-amplitude wavepackets are observed within the supersonic jet core and shear layer (Sinha et al. Reference Sinha, Rodríguez, Brès and Colonius2014). This asymmetry is a direct consequence of the acoustic interference established between the jet and the plate, where reflected sound waves amplify the KH instability wavepackets in the lower shear layer. Additionally, elevated energy is observed in the fourth and fifth shock cells near the plate’s trailing edge, while the first shock structures remain intact. The DMD amplitude in figure 16(d) reveals a clear asymmetry in magnitude, with the lower shear layer exhibiting slightly higher amplitudes than the upper shear layer. Notably, an elevated DMD amplitude is also observed in the lower shear layer upstream of the first shock for both H1 and H2. This is most likely due to the effect of the localised acoustic forcing from the plate reflection on the lower side of the jet. This is even apparent in the screech harmonic mode (see figure 17 d), which shows substantial amplification and concentration of energy almost exclusively within the lower shear layer, providing definitive evidence of the plate’s influence.
The DMD modes of the isolated (a,b) and installed (e–h) under-expanded jets at the harmonic of the screech mode C (
 $St = 0.52$
for H1 (
 $H/D$
= 1) and H2 (
 $H/D$
= 1.5)) are presented at M3 = 1.44. Panels (a,c,e,g) show the spatial structures of the corresponding DMD modes, while (b,d,f,h) display the extracted DMD amplitudes along
 $r/D = -0.5,\,0,\,0.5$
. Panel (h) specifically highlights the mode at
 $St = 0.44$
, for H3 (
 $H/D$
= 2.5), associated with the harmonic of the plate-induced tone.

For the H3 configuration, results are presented at
 $St$
= 0.22, as the screech tone is suppressed at this plate height (see figure 13), in agreement with acoustic measurements. The DMD energy spectrum exhibits distinct peaks only at
 $St$
= 0.22 and
 $St$
= 0.44, with no significant energy at the screech frequency, confirming the transition to a plate-induced tonal mechanism. The contour plot in figure 16(g) shows a relatively small difference between the upper and lower shear layers, indicating a symmetric flow structure. This is further supported by the reduced DMD amplitude observed between (
 $x/D = 1{-}4$
) in figure 16(h). However, a noticeable increase in DMD amplitude is observed in both shear layers near the plate, particularly in the region between
 $x/D = 4$
and
 $6$
. Notably, the fourth shock cell is substantially amplified in this case, indicating a strong interaction between the flow structures and the installed plate. This localised downstream amplification is characteristic of the plate-induced tone mechanism, where resonance is anchored at the plate trailing edge rather than being dominated by the screech loop closer to the nozzle. This is further supported by the analysis of the plate-tone harmonic at
 $St = 0.44$
(see figure 17
d), where the spatial mode and amplitude evolution exhibit continuous growth toward the trailing edge. A pronounced increase in amplitude is observed in the lower shear layer around the third and fourth shock cells, indicating that the plate-induced resonance is strongly anchored to the trailing edge.
3.7. Common-basis proper orthogonal decomposition
While standard modal decomposition techniques such as proper orthogonal decomposition (POD) or DMD can effectively characterise the coherent structures within each individual configuration, the modes they produce are inherently specific to the dataset they are derived from. As a result, direct quantitative comparisons between different configurations (e.g. isolated versus installed jets) are fundamentally limited, since each set of modes represents a different basis.
To address this limitation, common-basis proper orthogonal decomposition (CPOD) is employed (Kriegseis et al. Reference Kriegseis, Dehler, Gnirß and Tropea2010; Fernando, Kriegseis & Rival Reference Fernando, Kriegseis and Rival2014; Fenyvesi et al. Reference Fenyvesi, Kriegseis and Horváth2022). Common-basis POD generates a single, unified set of orthogonal modes by assembling a combined snapshot matrix that includes all configurations (isolated, H1, H2 and H3). This shared modal basis enables the projection of each individual dataset onto the same coordinate system, allowing for a direct and meaningful comparison of modal energy contributions across different installation conditions and Mach numbers. By unifying the modal basis across all configurations, CPOD removes the influence of case-specific differences, enabling a consistent comparison of how plate presence and positioning influence the energy content of the jet’s coherent structures. This shared framework allows the present study to precisely examine the underlying shear-layer dynamics and identify how dominant energetic modes evolve between isolated and installed cases.
The analysis window was intentionally focused on the lower shear layer, as the preceding DMD analysis (§ 3.6) consistently identified this region as the location of the most significant flow asymmetries and energetic interactions resulting from the plate installation. It is important to note that including the complete flow will result in the dominant screech mode as the highest mode, not allowing us to study the effects on the lower shear layer. The CPOD was carried out on Schlieren images focused on these windows, covering axial positions (
 $3.5 \leqslant x/D \leqslant 6$
) and radial positions (
 $- 0.6 \leqslant r/D \leqslant -0.4$
), where
 $D$
represents the jet diameter. These regions were selected to focus on the lower shear layer closer to the jet plate, enabling a detailed examination of key flow features in the vicinity of the plate trailing edge.
The implementation of the CPOD is explained as follows. To enable a comparative analysis of the flow field under different configurations, the corresponding snapshot data from each specific configuration (e.g. isolated, installed-H1, etc.) are aggregated. In the equations that follow, the index
 $h$
is used to denote any one of these configurations. Let
 $K$
be the total number of configurations being compared (
 $h\in K$
). The total number of snapshots,
 $M$
, is the sum of the snapshots
 $N_h$
from each of the
 $K$
configurations:
 \begin{equation} M = \sum _{h=1}^{K} N_h. \end{equation}
Following the principles of POD, the transient image intensities (snapshots) for each configuration
 $h$
are arranged into a data matrix
 $I_h$
:
 \begin{equation} I_h = [i_h^1 , i_h^2 , {\cdots} , i_h^{N_h}]. \end{equation}
These individual data matrices are then concatenated to form the common-base matrix
 $I$
, which contains all snapshots from all configurations, i.e.
 \begin{equation} I = [I_1 , I_2 , {\cdots} , I_K] = [i^1 , i^2 , {\cdots} , i^M]. \end{equation}
The standard POD procedure is then applied to this common-base matrix. The spatial covariance matrix
 $R$
is formed as
 \begin{equation} R = I I^T .\end{equation}
The eigenvalue problem is then solved for the covariance matrix
 \begin{equation} R \phi _j = \lambda _j \phi _j. \end{equation}
Here the eigenvectors
 $\phi _j$
are the spatial CPOD modes, and the corresponding eigenvalues
 $\lambda _j$
are proportional to the energy content of each mode across the entire ensemble of snapshots. The modes are ranked such that
 $\lambda _1 \geqslant \lambda _2 \geqslant {\cdots}$
. The matrix
 $\varPsi = [\phi _1 , \phi _2 , {\cdots} ]$
contains the common modes as its columns.
The temporal evolution of each mode is described by the weighting coefficients
 $a_j^t$
, which are calculated by projecting the snapshot data onto the modes, i.e.
 \begin{equation} \quad a^t = \varPsi ^T i^t. \end{equation}
The transient flow field of any snapshot can be reconstructed as a linear combination of these common modes and their corresponding weighting coefficients, where
 \begin{equation} i^t \approx \sum _{j=1}^{N_h} a_{j}^t \phi _j. \end{equation}
The power contribution,
 $P_{j,h}$
, of each common mode
 $j$
within a specific configuration
 $h$
is calculated to quantify its energy contribution. This is defined as the energy of mode
 $j$
for all snapshots belonging to configuration
 $h$
, normalised by the total energy of the entire system (sum of all eigenvalues). Let
 $S_h$
be the set of snapshot indices
 $t$
belonging to configuration
 $h$
. The power contribution is
 \begin{equation} P_{j,h} = \frac {\sum _{t \in S_h} (a_j^t)^2}{\sum _{m} \lambda _m} .\end{equation}
Because the common modes
 $\phi _j$
are ordered based on the total ensemble energy, the power contribution
 $P_{j,h}$
for any individual configuration is not guaranteed to be monotonically decreasing with mode number
 $j$
like standard POD.
A matrix of intensity profiles was constructed from 10 000 Schlieren images for the isolated configuration and each of the three installed heights (H1, H2 and H3). This matrix was then subjected to CPOD analysis, allowing the extraction of common spatial modes and temporal coefficients across all configurations. Performing CPOD enabled the identification of spatial structures shared among the cases and quantified the energy distribution within each mode. Singular value decomposition is used to extract the most significant spatial modes by analysing their corresponding singular values, allowing for a comprehensive evaluation of the dominant flow structures. After these modes are identified, the intensity profiles are reconstructed for each configuration, allowing a comparative investigation of the shear-layer dynamics near the flat plate. Common-basis POD is instrumental in quantifying the effects of the flat plate and height variations on the jet’s behaviour, uncovering significant differences in flow characteristics and energy distribution across the configurations.
The power contribution (
 $P_{j,h}$
) of the CPOD modes for the isolated and installed jets is shown for (a) M2 = 1.16 and (b) M3 = 1.44. The spatial structures of the CPOD modes are presented in the insets, revealing a concentration predominantly in the lower shear layer, spanning axial locations
 $3.5 \leqslant x/D \leqslant 6$
and radial positions
 $-0.6 \leqslant r/D \leqslant -0.4$
, near the trailing edge of the plate. This spatial distribution is consistent with the corresponding DMD modes, highlighting that the influence of the plate is confined primarily to the lower shear layer.

The results of the CPOD analysis are presented in figure 18(a) for the M2 = 1.16 case, which shows the
 $P_{j,h}$
of the first ten modes across the four configurations. The normalised power
 $P_{j,h}$
is computed from the temporal coefficients for each specific configuration
 $h$
, quantifying how much energy a common mode
 $j$
contributes to that individual case. Because the modes are ranked based on the total dataset, the
 $P_{j,h}$
distribution for a single case is not guaranteed to be monotonically decreasing. This allows for the identification of energetically dominant modes that are unique to a particular configuration. As observed in figure 18(a), mode 1, which represents the most common dominant coherent structures in the flow field, exhibits the highest energy content for the H3 configuration. This confirms the amplification of the KH mode in the shear layer at H3, which possesses the highest relative energy among all cases. The H2 configuration follows with the next highest energy, then H1, while the isolated configuration shows the lowest energy content. This energy ranking among the installed configurations corresponds with the acoustic SPL measurements. The high energy of mode 1 in the H3 case aligns with the strong screech tone observed, suggesting that the coherent structures captured by this mode play a key role in sustaining the feedback loop responsible for tone generation. Moreover, the reduced energy content in the H1 and H2 configurations also corresponds with the observed suppression of the screech tone. This implies that the proximity of the plate in these cases disrupts the formation or persistence of these large-scale structures, weakening the feedback mechanism and contributing to noise reduction. The corresponding spatial structures associated with the first common mode are embedded as a subplot in figure 18(a). The results reveal coherent wavepackets between
 $x/D = 3.5$
and
 $ 5$
. However, past the trailing edge at
 $x/D = 5$
, the coherent structures begin to breakdown and lose energy. This emphasises the impact of the plate on shear-layer dynamics near the trailing edge at different heights. The subsequent higher-order modes exhibit relatively lower energy contributions, suggesting that they capture finer-scale, less energetic structures. While these modes contribute to the overall flow dynamics, their influence is less prominent compared with the dominant modes.
Similarly, the results for the M3 = 1.44 case are presented in figure 18(b). The
 $P_{j,h}$
distribution reveals the highest energy content for the H1 configuration, followed by H3, H2 and the isolated case, indicating a stronger jet–plate interaction when the plate is positioned closer to the jet. Connecting this energy distribution to the acoustic data reveals a clear correlation for the installed configurations. The peak energy in the H1 case corresponds with the strong jet–plate interaction responsible for suppressing screech and generating a dominant plate-induced tonal response. The H3 configuration follows with slightly lower energy but still exhibits screech suppression along with a prominent tonal peak associated with the plate. This clearly indicates a relationship between the strength of the shear-layer structures and the resulting acoustic tones. The observed energy distribution suggests that modifications to the shear layer induced by the presence and proximity of the plate play a critical role in altering the jet’s tonal characteristics. The spatial structure of mode 1 shows a clear presence of KH wavepackets extending throughout the analysis window from
 $x/D = 3.5$
to 6, highlighting persistent large-scale shear-layer dynamics at M3. In contrast to M2, where H3 exhibited the strongest response, the shift in peak energy to H1 in M3 = 1.44 underscores the increasing influence of direct jet–plate interaction at higher Mach numbers. Modes 2 through 4 further emphasise this trend, particularly at H1, where the proximity of the plate enhances the energy content of higher modes and modifies the shear-layer development near the trailing edge.
The CPOD analysis of cases M2 = 1.16 and M3 = 1.44 reveals that both the presence and proximity of a flat plate significantly influence the interaction between an under-expanded jet and the surrounding flow. At M2, peak energy occurs at the farthest plate distance H3, where acoustic waves reflected from the trailing edge travel back and reinforce coherent structures in the shear layer. In contrast, at M3, the highest energy is observed at the closest distance H1, where the plate induces direct, localised disturbances in the shear layer. Interestingly, for both Mach numbers, the energy ranking of the installed configurations directly corresponds to the measured acoustic amplitude as seen in figure 7. This could suggest that once the jet–plate interaction is established, the energy content of the dominant shear-layer structures becomes the primary driver of the tonal noise magnitude. These findings show how plate distance governs the balance between acoustic feedback and immediate jet–plate interactions, shaping energy distribution and flow dynamics, especially within the shear layer, an insight critical for controlling under-expanded jets near surfaces.
3.8. Frequency–wavenumber spectra in the jet shear layers
The DMD and CPOD analysis revealed that the interaction between the under-expanded jet and the flat plate, especially the role of acoustic waves, strongly affects the energy distribution in the shear layers. To delve deeper into these dynamics, the frequency–wavenumber spectrum is essential for capturing the spatio-temporal behaviour of both acoustic and hydrodynamic waves.
For the installed jet conditions, the interaction between the jet’s acoustic and hydrodynamic fields with the plate and its trailing edge notably influences noise levels, particularly when compared with an isolated jet. This interaction affects both upstream-propagating acoustic waves and downstream-propagating KH waves, especially in the lower shear regions near the plate (Tam & Chandramouli Reference Tam and Chandramouli2020). These wavepacket characteristics are observed in the DMD modes for both Mach numbers.
Frequency–wavenumber spectra of image intensity fluctuations extracted at
 $r/D = 0.5$
,
 $r/D = 0$
and
 $r/D = -0.5$
for both isolated and installed jets at M3 = 1.44 are presented. Only the negative wavenumber spectra are shown, as they are essential for capturing the screech mode C (
 $St= 0.26$
) and the plate-induced tonal components (
 $St= 0.22$
) under installed conditions. The dispersion relation lines are superimposed on the contours to aid physical interpretation. The solid black line corresponds to
 $k = -\omega /c_0$
, where
 $\omega = 2\pi f$
. Dash–dotted lines indicate symmetric instability modes, while dashed lines denote antisymmetric modes. Saddle points and branch cuts are highlighted using red circles and black squares, respectively.

Tam & Hu (Reference Tam and Hu1989) employed a vortex sheet model to derive the dispersion relation for neutral waves, which are the upstream-propagating waves that travel along the jet column and close the feedback loop responsible for screech tones. The details of calculating the wavenumber–frequency pairs using the dispersion relation, saddle points and branch cuts are thoroughly described by Towne et al. (Reference Towne, Cavalieri, Jordan, Colonius, Schmidt, Jaunet and Brès2017). By applying this dispersion relation to the frequency–wavenumber spectrum obtained from the Schlieren image intensities, which are related to the density fluctuations within the flow, the characteristics of the neutral waves and their role in the screech phenomenon can be analysed. However, since Schlieren images reflect the integration of first-order density gradients along the line of sight, the full behaviour of these neutral waves may not be completely captured. A similar approach was used by Semlitsch et al. (Reference Semlitsch, Malla, Gutmark and Mihăescu2020), applied to shadowgraph images to investigate the generation mechanism of higher harmonics in the screech tones of rectangular supersonic jets.
A detailed spatio-temporal decomposition is performed by analysing Schlieren image intensity fluctuations, extracted at
 $r/D = 0.5$
,
 $0$
and
 $-0.5$
corresponding to the upper shear layer, jet centre and lower shear layer, respectively. Figure 19 shows the frequency–wavenumber (
 $St-kD_{j}$
, where
 $kD_{j}\lt 0$
is the non-dimensional wavenumber) spectra over
 $0 \leqslant x/D \leqslant 8$
for both isolated and installed jets at M3. This analysis is crucial for comparing with theoretical dispersion relations, helping to identify key wave dynamics and assess their impact on noise and flow control.
In figure 19 the left column represents the spectra for the upper shear layer (
 $r/D = 0.5$
), the middle column shows the spectra for the jet centre (
 $r/D = 0$
) and the right column covers the lower shear layer (
 $r/D = -0.5$
). Each row depicts different conditions, starting with the isolated jet case in the first row and followed by the installed conditions. Additionally, the dispersion curves from the vortex-sheet model are overlaid on the contours. The solid black line represents
 $k = -\omega /c_0$
, where
 $\omega = 2\pi f$
. Dashed–dotted lines correspond to symmetric modes, while dashed lines denote antisymmetric modes. Saddle points and branch cuts are highlighted with red circles and black squares, respectively.
As depicted in figure 19(a–c), the spectra for the isolated and installed jets reveal noticeable differences between the jet core and the shear layers. In the jet core (
 $r/D = 0$
), the high-amplitude band aligns closely with the curve representing
 $k = -\omega /c_0$
, indicating the presence of strong acoustic waves propagating at the local speed of sound. This alignment is most prominent in the isolated jet case, where the core dynamics is largely dominated by these acoustic waves, which play a crucial role in the feedback mechanisms, such as screech (Towne et al. Reference Towne, Cavalieri, Jordan, Colonius, Schmidt, Jaunet and Brès2017). Additionally, the screech tone at
 $St = 0.26$
closely matches the antisymmetric mode (screech mode C), further reinforcing the feedback loop necessary for its generation (Tam & Hu Reference Tam and Hu1989). The spectra for the isolated jet exhibit clear symmetry across all radial positions
 $r/D = 0.5$
,
 $r/D = 0$
and
 $r/D = -0.5$
, indicating an undisturbed jet shear layer.
In the H1 (in figure 19
d–f) configuration, the interaction between the jet and the flat plate strongly enhances acoustic reflections (Ahuja et al. Reference Ahuja, McCaulley and Tam1989), particularly in the lower shear layer at
 $r/D = -0.5$
, where the feedback loop amplifies the screech peak at both
 $r/D = 0$
and
 $r/D = -0.5$
. This represents a clear amplification of the screech mode C at
 $St = 0.26$
. This amplification is attributed to the efficient reflection of acoustic waves from the plate surface, which effectively acts as an additional sound source, reinforcing the screech feedback loop more strongly than the nozzle lip alone. The increased intensity observed at
 $ r/D = 0$
and
 $ r/D = -0.5$
, compared with the upper shear layer, is consistent with the spatial distribution of the dominant DMD modes. This aligns with the dispersion line
 $k = -\omega /c_0$
, indicating effective coupling between acoustic waves and the jet shear layer, which reinforces wave coherence and amplifies screech (Baier et al. Reference Baier, Karnam and Gutmark2020). However, as the plate height increases in H2 and H3, the strength of the feedback mechanism diminishes. For the H2 configuration, the screech peak at
 $St = 0.26$
remains aligned with the dispersion relation, albeit with reduced intensity compared with H1. This attenuation reflects the partial destructive interference of the acoustic field; however, the reflection from the plate still contributes to enhanced amplitude in the lower shear layer. In the H3 configuration, the peak energy shifts to a different frequency, which corresponds to the plate-induced tone identified in the far-field and wall-pressure spectra. This indicates a suppression of the screech mode C at
 $St = 0.26$
and the amplification of a plate-induced resonant mode at
 $St = 0.22$
, as seen in figure 19(j–l). This tone is dictated by a resonance established between the nozzle and the plate, which is now positioned far enough away to disrupt the original screech mechanism and promote its plate-induced resonance frequency. Therefore, it is not aligned with the acoustic dispersion curve at this Mach number. The increasing influence of the installed plate at larger
 $H/D$
fundamentally alters the preferred mode of the system from the natural jet screech to a plate-dependent tone.
3.9. Schlieren: spatial analysis
A brief explanation to facilitate a clear understanding of the spatial contours displayed in this section is provided below. The interactions between the jet flow elements can be represented using their respective wavenumbers, i.e.
 \begin{equation} k = k_{KH} - k_{sn}, \end{equation}
where
 $k_{sn}$
represents the wavenumber of the
 $n$
th shock cell. Figure 20 presents the axial wavenumber spectra for M2 = 1.16 and M3 = 1.44 under various installed configurations. The wavenumbers corresponding to the shock cells (
 $k_{sn}$
), acoustic waves (
 $k_a$
) and guided jet modes (
 $k_{\textit{KH}} - k_{sn}$
) are also indicated to aid in the interpretation of the spectral features. The wavenumbers for each shock cell are derived from the temporal average of the Schlieren images (Edgington-Mitchell et al. Reference Edgington-Mitchell, Li, Liu, He, Wong, Mackenzie and Nogueira2022). The wavenumber KH was extracted from the contour plot as previously suggested by Jeun, Wu & Lele (Reference Jeun, Wu and Lele2024). It is well established that the interactions between the first, or optimal, shock (
 $k_{s1}$
, dotted red line) and the second, or sub-optimal, shock (
 $k_{s2}$
, dotted black line) with the KH instabilities exert the most significant influence compared with subsequent shock cells (Edgington-Mitchell et al. Reference Edgington-Mitchell, Wang, Nogueira, Schmidt, Jaunet, Duke, Jordan and Towne2021). Therefore, the focus of this discussion is on these two interactions.
In figure 20 the interaction between the KH structures and the first shock is termed the optimal interaction (
 $k_{\textit{KH}} - k_{s1}$
), represented by the dashed red line. The interaction with the second shock is referred to as the sub-optimal interaction (
 $k_{\textit{KH}} - k_{s2}$
), shown by the dashed black line. For reference, the wavenumbers corresponding to the acoustic speed of sound (
 $k_{a}\pm$
) are also included. As previously noted, positive wavenumbers indicate downstream-propagating waves, whereas negative wavenumbers indicate upstream-propagating waves.
The wavenumber spectra at M2 = 1.16, the screech mode A2 (a,c,e,g) is observed at
 $St = 0.54$
for both the isolated jet and all installed configurations. For M3 = 1.44, the screech mode C (b,d,f,h) occurs at
 $St = 0.26$
for the isolated, H1 and H2 cases, while a distinct tonal component at
 $St = 0.22$
is identified for the H3 configuration. The wavenumbers corresponding to the shock cells (
 $k_{sn}$
), acoustic waves (
 $k_a$
) and the guided jet modes (
 $k_{\textit{KH}} - k_{\textit{sn}}$
) are indicated. The contours of energy distribution are plotted as a function of the normalised wavenumber
 $(kD_j$
) versus radial distance
 $(r/D$
).

In the present study, the snapshot POD algorithm is used, thus, the spatial POD modes are calculated using the method proposed by Sirovich (Reference Sirovich1987). It should be noted that the POD modes discussed here are obtained from the standard snapshot POD and are not the CPOD modes. The first two POD modes are combined as a complex field to capture coherent flow structures. A fast Fourier transform was then applied along the streamwise direction to obtain the spatial wavenumber spectrum. The spatial resolution was used to compute the corresponding wavenumber. The results for both the Mach numbers are presented in figure 20.
Figure 20(a) presents the normalised wavenumber spectra for the isolated jet following previous studies (Edgington-Mitchell et al. Reference Edgington-Mitchell, Wang, Nogueira, Schmidt, Jaunet, Duke, Jordan and Towne2021). Positive
 $kD_{j}$
values correspond to downstream-propagating KH instabilities, while negative
 $kD_{j}$
values indicate upstream-travelling neutral waves. The interaction lines at
 $k_{\textit{KH}} - k_{s1}$
and
 $k_{\textit{KH}} - k_{s2}$
, representing the guided jet modes (Edgington-Mitchell et al. Reference Edgington-Mitchell, Li, Liu, He, Wong, Mackenzie and Nogueira2022; Jeun et al. Reference Jeun, Wu and Lele2024; Nogueira et al. Reference Nogueira, Cavalieri, Martini, Towne, Jordan and Edgington-Mitchell2024), highlight a distinct resonance loop within the isolated jet configuration. This behaviour is indicative of coherent screech tone development, aligning with Edgington-Mitchell et al. (Reference Edgington-Mitchell, Jaunet, Jordan, Towne, Soria and Honnery2018), who emphasised the role of upstream-travelling neutral waves in screech feedback closure.
The dominant modes in the vicinity of the shear layer, located at
 $k/D_j = 5{-}10$
, correspond to the propagation of KH instabilities and exhibit symmetry between the upper and lower shear layers. These instabilities interact with shock-cell structures, leading to an increased energy concentration close to the shear layers, particularly near the lip lines. Furthermore, prominent energy peaks observed within the potential core at
 $k/D_j \approx -5$
are likely due to interactions between upstream-travelling acoustic waves and downstream-propagating hydrodynamic instabilities. Such interactions are characteristic of screech phenomena in under-expanded jets.
In figure 20(c) for the H1 configuration, the intensity of the downstream and upstream wave interactions is notably reduced compared with the isolated case. The proximity of the flat plate to the jet shear layer introduces disturbances that partially disrupt the feedback loop necessary for screech generation. The interference primarily affects the upstream-travelling neutral waves (
 $-kD_{j}$
), leading to a weaker feedback mechanism, though not eliminating it. The lower half of the jet (
 $r/D=-0.5$
) shows higher energy concentration compared with the upper half (
 $r/D=0.5$
). This suggests an asymmetry in the jet’s flow, possibly due to the installation effects or differences in the proximity of the shear layers to surrounding boundaries. As observed in DMD analysis, the lower shear layer tends to accumulate more energy.
Figure 20(e) reveals a significant shift in energy distribution within the potential core, with the majority of the energy within the core now concentrated in the positive wavenumber region. This indicates a reduction in upstream-travelling acoustic waves, suggesting a breakdown in the upstream acoustic feedback mechanism. The previously strong interaction between the KH instabilities and the shock-cell structures has weakened, indicating that the H2 configuration disrupts the feedback loop that sustains these interactions. The absence of upstream energy is consistent with the findings by Tam & Hu (Reference Tam and Hu1989), which highlights the importance of constructive interference for sustaining screech tones. The H2 configuration likely introduces some form of acoustic reflection, preventing upstream-travelling waves from reinforcing the jet’s oscillatory modes. The plate acts as an acoustic barrier (Baier et al. Reference Baier, Karnam and Gutmark2020), reflecting waves and preventing them from returning to the shear layer, thereby disrupting the resonance needed for screech.
The dominant modes in the vicinity of the shear layer have also undergone a significant shift from positive to negative wavenumbers and are observed at
 $k/D_j =-5$
to
 $-7$
. This shift suggests a reversal in the direction of the dominant instability waves in the shear layer, indicating a shift in energy direction from downstream to upstream. This shift further suppresses screech by preventing upstream shear-layer modes from interacting with the shock-cell structures to sustain resonance.
In the H3 configuration (figure 20 g), the flow behaviour begins to resemble the isolated jet case. The increased distance of the plate reduces its impact, allowing modes in the potential core and shear layer to realign with their initial positions. As a result, the trapped jet modes and screech feedback partially recover, enabling a weaker but still functioning resonance. Notably, the downstream-travelling modes now show a stronger energy presence on the lower shear layer.
Figure 20(b) presents the normalised wavenumber spectra for the isolated jet at M3. At this Mach number, the downstream-propagating KH instabilities dominate, with energy concentrated at positive
 $kD_j$
values. The upstream-travelling neutral waves, which are crucial for screech feedback, show reduced intensity at negative
 $kD_j$
values, with the highest levels observed at
 $r/D=0$
. This pattern is consistent with the findings of Tam & Hu (Reference Tam and Hu1989), where the weaker presence of upstream-travelling waves at higher Mach numbers correlates with changes in the screech generation mechanism. The interaction lines at
 $k_{\textit{KH}} - k_{s1}$
and
 $k_{\textit{KH}} - k_{s2}$
represent the guided jet modes, highlighting the persistence of resonance conditions that support feedback interactions between the shock-cell structure and the shear-layer instabilities. The upstream-travelling waves coincide with the interaction lines at
 $-k_a$
,
 $k_{\textit{KH}} - k_{s1}$
and
 $k_{\textit{KH}} - k_{s2}$
, capturing the complex triadic interactions between the upstream acoustic waves, the KH instabilities and the shock-cell structures. These triadic interactions, as discussed in Tam & Hu (Reference Tam and Hu1989), play a critical role in sustaining the feedback loop necessary for screech tone generation by facilitating energy transfer between the shear layer, the shock cells and the acoustic field.
The far-field acoustic wave, observed as a vertical line beyond the shear layer, is a result of shock leakage, where acoustic energy escapes due to the interaction between KH instabilities and shock-cell structures (Edgington-Mitchell et al. Reference Edgington-Mitchell, Li, Liu, He, Wong, Mackenzie and Nogueira2022). This wave radiates at a constant frequency, unaffected by the turbulent jet structures, indicating a dominant mode generated by the triadic interactions in the flow. The coherent system of energy exchange, involving upstream-travelling waves, KH instabilities and shock-cell structures, aligns the acoustic waves with the interaction lines, emphasising the role of shock leakage in jet acoustics. The vertical acoustic line beyond the shear layer confirms the transition of energy from the jet to the far field.
In the H1 configuration (figure 20
d), the flat plate alters the wavenumber spectra by reducing upstream-travelling waves in the potential core, disrupting the acoustic feedback loop responsible for screech. There is a higher energy concentration in downstream-propagating waves along the lower shear layer, near the flat plate. This intensified wave suggests that the plate reflects and reinforces wave propagation downstream, resulting in a concentrated energy distribution. The downstream acoustic wave at
 $kD_j=4$
, especially in the lower shear layer, is effectively stopped by the plate in the radial direction. This indicates that the plate functions as a reflector, amplifying the acoustic wave.
In the H2 configuration (figure 20 e), downstream-propagating acoustic energy is diffused compared with the isolated and H1 cases. While H1 shows concentrated energy on the lower shear due to plate proximity, H2 results in a broader energy distribution with no dominant region. Although downstream wave activity is still enhanced in H2, it is less than in H1, highlighting the critical influence of plate position on the acoustic field. Upstream wave energy is higher in H2 but localised and evenly spread across the wavenumber spectrum.
Figure 20(f) shows a significant redistribution of energy in the shear layer, with much of it now concentrated in the negative wavenumber region, indicating increased upstream-travelling acoustic waves. When considering the H3 configuration, the results are presented for the plate-induced tone. Therefore, the upstream acoustic feedback mechanism by reflecting acoustic energy towards the jet reinforces the feedback loop crucial for plate-induced tone resonance. The plate acts as an acoustic reflector, promoting interactions in the lower shear layer and strengthening upstream propagation. While upstream energy is amplified, there is also a strong concentration of downstream wave energy in the jet core, suggesting a balance between upstream feedback and downstream wave reinforcement in the H3 set-up. This configuration results in a complex energy distribution compared with previous cases, with both upstream and downstream wave activity enhanced.
In this section the method used to reconstruct the spatial distribution of wavenumber modes (Wu, Lele & Jeun Reference Wu, Lele and Jeun2020) from Schlieren images (Edgington-Mitchell et al. Reference Edgington-Mitchell, Jaunet, Jordan, Towne, Soria and Honnery2018) is outlined, providing a qualitative insight into the energy distribution across different wavenumbers. The energy associated with distinct wavenumbers is retrieved through an inverse Fourier transform, performed over a specified range of wavenumbers, i.e.
 \begin{equation} w_0(k,x,r) = \sum _{k_1}^{k_2} \hat {w}(k,r) e^{-ikx}, \end{equation}
where
 $ w_0(k,x,r)$
represents the spatial energy distribution corresponding to the central wavenumber
 $ k$
, reconstructed from the range
 $ [k_1, k_2]$
. The reconstruction was accomplished using a Kaiser window with a half-width of
 $ 1D$
centred on the wavenumber
 $ k$
, allowing the spatial energy contours to be refined. The approach closely follows the techniques used by Edgington-Mitchell et al. (Reference Edgington-Mitchell, Wang, Nogueira, Schmidt, Jaunet, Duke, Jordan and Towne2021), where a similar methodology was applied to visualise internal wave modes. Interpolation was employed to compensate for the limited spatial resolution of the Schlieren images, ensuring that the wavenumbers derived from the images aligned with the theoretical interaction wavenumbers discussed earlier. It is important to note that the reconstructed wavenumber modes, while providing a useful representation of the spatial energy distribution, are used as qualitative visualisations rather than quantitative assessments (Edgington-Mitchell et al. Reference Edgington-Mitchell, Wang, Nogueira, Schmidt, Jaunet, Duke, Jordan and Towne2021). The focus remains on capturing the spatial patterns and modal structures within the observed flow field.
Figure 21 presents the reconstructed wavenumber modes for the experimental round jet at M2 = 1.16 with three different plate positions: H1, H2 and H3, as compared with the isolated jet configuration. The results highlight the influence of the plate installation on the jet’s wavenumber modes, focusing particularly on the components
 $ k^+_{\textit{KH}}$
,
 $ k^-_{th}$
and
 $ k^+_{\textit{KH}} + k^-_{th}$
.
The reconstructed wavenumber modes for downstream
 $( k^+_{\textit{KH}}$
), upstream
 $( k^-_{\textit{th}}$
) and combined wavenumber
 $( k^+_{\textit{KH}} + k^-_{\textit{th}}$
) were analysed for both isolated and installed jets at M2.

In the isolated configuration (top row), the
 $ k^+_{\textit{KH}}$
modes exhibit a distinct downstream periodic structure, indicating the dominance of KH instabilities (Edgington-Mitchell et al. Reference Edgington-Mitchell, Wang, Nogueira, Schmidt, Jaunet, Duke, Jordan and Towne2021). This spatial view of the dominant downstream structures aligns with the DMD analysis, which identified the KH mode as the most energetic component of the flow. The
 $ k^-_{th}$
modes show clear upstream-propagating waves confined within the jet, although with reduced amplitude compared with the downstream modes Tam & Hu (Reference Tam and Hu1989), Jeun et al. (Reference Jeun, Wu and Lele2024). The clear structure of this upstream-propagating wave is fundamental to the screech feedback loop, which corresponds to the prominent screech tone observed in the SPL for the isolated jet. The
 $ k^-_{th}$
wave peaks at approximately the fourth shock cell (Edgington-Mitchell et al. Reference Edgington-Mitchell, Jaunet, Jordan, Towne, Soria and Honnery2018). The superposition of
 $ k^+_{\textit{KH}} + k^-_{th}$
reinforces constructive interference between the downstream and upstream components.
When the plate is installed at H1 (figure 21
d–f), an increase in energy is observed in the lower shear region, despite no direct interaction with the shear layer. This suggests that the
 $ k^+_{\textit{KH}}$
modes are indirectly influenced, possibly due to reflections or changes in the feedback mechanism caused by the plate. While the downstream periodicity remains, some reduction in amplitude indicates a disruption in the typical wave behaviour. The
 $ k^-_{th}$
modes lose coherence, suggesting a less effective feedback loop for upstream wave propagation. This disruption of the upstream feedback mechanism is consistent with the Fourier spectra, which showed a significant suppression of the screech tone at this plate position. This is particularly evident in the lower shear region, where the energy becomes concentrated, despite the flow being distant from the plate. The interaction between
 $ k^+_{\textit{KH}}$
and
 $ k^-_{th}$
leads to complex, less constructive interference downstream. The energy redistribution remains asymmetrical, with the lower shear retaining energy as the flow progresses.
At H2 (figure 21
g–j), a notable shift occurs between the
 $ k^+_{\textit{KH}}$
and
 $ k^-_{th}$
modes compared with both the isolated configuration and H1. In the
 $ k^+_{\textit{KH}}$
modes, there is a clearer recovery of the downstream wave structure, with distinct lobe formations. However, energy is initially concentrated in the jet core, with a delayed transition to the shear layers, indicating a shift in the dominance of core and shear instabilities, likely influenced by the plate’s effect on the feedback mechanism. The
 $ k^-_{th}$
modes show some improvement in structure compared with H1 but remain somewhat diffused. Energy initially resides in the core rather than the shear, a deviation from the isolated case where energy is evenly balanced. This suggests a temporary disruption of the feedback loop, where core instabilities dominate over the shear in the upstream feedback. The
 $ k^+_{\textit{KH}} + k^-_{th}$
combination shows constructive interference compared with H1, indicating less disruption in wave interactions at this plate position. The observed partial recovery of wave interaction correlates with the DMD findings, where the fundamental screech mode appears more defined than in H1 despite its reduced amplitude, and with SPL measurements reflecting a weaker but re-emerging screech tone. However, the influence of the plate remains evident, particularly in the delayed energy transfer from the core to the shear layers.
In the H3 position (figure 21
j–l), the
 $ k^+_{\textit{KH}}$
modes exhibit coherent downstream propagation with increased wave amplitude compared with H1 and H2. The energy in the shear layers returns to a stable and periodic distribution, similar to the isolated case, suggesting minimal influence of the plate on the downstream KH instabilities. The
 $ k^-_{th}$
modes also return to a periodic behaviour, indicating that the feedback mechanism is less disturbed by the plate at H3. The restoration of this feedback loop aligns directly with the SPL, which demonstrated a return of the strong, clear screech tone characteristic of the isolated jet. This suggests that the interaction between the jet’s flow structures and the plate is weaker, allowing the feedback loop to recover. The combined
 $ k^+_{\textit{KH}} + k^-_{th}$
modes show strong constructive interference, similar to the isolated configuration. This indicates that the plate at H3 allows for effective wave interaction, with energy evenly distributed between the shear and core regions. Overall, the flow dynamics at H3 closely resemble those of the isolated case, with minimal disruption to both downstream and upstream waves.
In summary, the presence of the plate significantly affects the wavenumber modes, particularly the upstream
 $ k^-_{th}$
modes, which are critical for the screech feedback mechanism. The plate’s position influences the extent of disruption, with H1 showing the greatest effect and H3 allowing for a partial recovery of the isolated jet behaviour.
The analysis of M3 = 1.44 reveals several key distinctions from M2, though some trends remain consistent. For the isolated configuration (figure 22
a–c), the
 $ k^+_{\textit{KH}}$
modes show a strong and periodic downstream structure, characteristic of KH instabilities dominating the shear layer. On the other hand, the upstream-propagating
 $ k^-_{th}$
modes retain a clear wave pattern, though with noticeably lower amplitude compared with the downstream waves. The combined
 $ k^+_{\textit{KH}} + k^-_{th}$
results illustrate efficient constructive interference, demonstrating a well-organised interaction between the upstream and downstream components, leading to a stable energy distribution across the flow.
The reconstructed wavenumber modes for downstream
 $( k^+_{KH}$
), upstream
 $( k^-_{th}$
) and combined wavenumber
 $( k^+_{KH} + k^-_{th}$
) were analysed for both isolated and installed jets at M3.

When the plate is positioned at H1 (figure 22
d–f), the impact on the jet’s dynamics becomes apparent. The periodicity of the
 $ k^+_{\textit{KH}}$
modes persists, though a significant increase in amplitude is seen, particularly in the lower shear region. Similarly, the upstream
 $ k^-_{th}$
modes experience reduced coherence, with energy concentrating in the lower shear layer. This loss of coherence in the feedback-related
 $ k^-_{th}$
mode explains the findings from the far-field spectra, where the fundamental screech tone was suppressed and replaced by plate-induced tones. The combined modes
 $ k^+_{\textit{KH}} + k^-_{th}$
reflect a noticeable reduction in constructive interference, as irregularities in wave interactions disrupt the energy distribution downstream, making the flow turbulent and less organised.
At H2 (figure 22
g–i), the energy levels of
 $ k^-_{th}$
in the shear layer are noticeably lower compared with the isolated case. This observation provides a spatial counterpart to the findings from the DMD analysis, which showed a corresponding weakening of the upstream mode, and the far-field spectra, which revealed a reduced amplitude of the primary tone. At the H3 position (figure 22
j–l),
 $ k^+_{\textit{KH}}$
exhibits a spatial structure similar to
 $ k^-_{th}$
observed in other configurations, but coherent structures are confined to the jet core in regions where
 $x/D \gt 4$
. In contrast,
 $ k^-_{th}$
at H3 displays asymmetry and elevated energy levels in the lower shear layer for
 $x/D \gt 4$
. Additionally, the combined mode
 $ k^+_{\textit{KH}} + k^-_{th}$
shows uneven energy distribution between the shear layer and the core region, indicating a significant impact of the plate on the jet’s dynamics. This complex spatial energy distribution is consistent with the DMD results, which revealed several competing modes of comparable energy, and aligns with the complex, multi-tonal signature observed in the Fourier spectrum for this configuration.
4. Conclusion
This study investigates the effects of plate height and jet Mach number on the noise characteristics, acoustic feedback mechanisms and flow structures of isolated and installed under-expanded jets. The findings reveal that the Mach number significantly influences far-field noise, affecting screech tones, BBSAN and turbulent mixing noise. For isolated jets, screech mode A2 dominates at lower Mach numbers (M2 = 1.16), while screech mode C and pronounced BBSAN emerge at higher Mach numbers (M3 = 1.44). Installation effects amplify overall SPLs and introduce plate-induced tones, while the screech Strouhal numbers remain largely unchanged.
A key observation is that the plate height has a distinctly non-monotonic influence on the amplitude of both screech and plate-induced tones. This behaviour is a direct consequence of the phase relationship between the direct acoustic feedback waves and those reflected by the plate. At certain plate heights, this interaction results in constructive interference that amplifies tonal noise, while at others, destructive interference leads to its suppression. This interplay governs the complex balance between the inherent screech mechanism and the installation-dependent plate-tone resonance.
This acoustic interference fundamentally alters the jet’s flow dynamics, captured through multiple diagnostic techniques. Dynamic mode decomposition highlights that the plate interaction creates a pronounced asymmetry in the flow, amplifying coherent energy in the lower shear layer compared with the upper shear layer. Crucially, a novel statistical link was established using CPOD, the energy ranking of the dominant coherent modes within the shear layer was found to correlate directly with the measured far-field tonal noise amplitudes. This provides quantitative evidence that the plate’s primary role is to modulate the energy of the jet’s shear-layer structures in regions closer to the plate.
Frequency–wavenumber analysis further clarifies the underlying wave dynamics. The plate disrupts the delicate balance between downstream-propagating KH instabilities and the upstream-propagating acoustic waves that close the screech feedback loop. Depending on its position, the plate can either lead to screech suppression or reflect them to reinforce different resonant interactions, giving rise to the plate-induced tones. The interaction of KH instabilities with shock cells is therefore particularly pronounced in installed configurations, highlighting the critical role of reflective boundaries in altering feedback loops.
Ultimately, this study demonstrates that the acoustic and hydrodynamic fields are coupled. The comprehensive analysis provides a clear physical basis for the observed acoustic behaviour, establishing that the plate installation directly modulates the energy content and spatial distribution of the coherent structures within the jet’s shear layer. The central conclusion is that once the jet–plate interaction is established, the energy contained within these dominant shear-layer structures becomes the primary driver of the resulting tonal noise magnitude. This direct link between shear-layer energetics and far-field acoustics is crucial for the development of predictive models and effective noise control technologies for installed jet engines.
Supplementary movie
Supplementary movie is available at https://doi.org/10.1017/jfm.2025.10693.
Acknowledgements
Appreciation is also due to the Engineering and Physical Sciences Research Council (EPSRC), whose support has been instrumental in this research under grant no. EP/S000917/1. Furthermore, the authors acknowledge the financial contribution from The University of Bristol CAME Pump-Priming Grant for Innovative Interdisciplinary Research 2021, which significantly facilitated the completion of this project. The authors extend their gratitude to Professor Mahdi Azarpeyvand for generously providing the required facilities for experimentation.
Funding
The research was funded by the Engineering and Physical Sciences Research Council (EPSRC), Grant No. EP/S000917/1 and from The University of Bristol CAME Pump-Priming Grant for Innovative Interdisciplinary Research 2021.
Declaration of interests
The authors report no conflict of interest.
Author contributions
Hasan Kamliya Jawhar: experimentation, conceptualisation, writing–original draft, writing review
 $\&$
editing, methodology, software, validation, visualisation, formal analysis, data curation. Kabilan Baskaran: conceptualisation, writing–original draft, writing review
 $\&$
editing, methodology, software, validation, visualisation, formal analysis.
Data availability statement
The data are available upon reasonable request.
Appendix A. Frequency calculation
The screech frequency and plate-induced tonal noise frequency are calculated based on a simple feedback mechanism as described by Tam & Chandramouli (Reference Tam and Chandramouli2020) and Edgington-Mitchell et al. (Reference Edgington-Mitchell, Li, Liu, He, Wong, Mackenzie and Nogueira2022), respectively. For brevity, these calculations are presented for the M3 = 1.44 case.
The calculation of the screech frequency relies on the downstream phase velocity,
 $ u_d$
, and the upstream phase velocity,
 $ u_u$
, both of which are extracted from figure 20. The standing wavenumber,
 $ k_{sw} = k_d + k_u$
, is obtained following Panda (Reference Panda1999) and is also derived from figure 20. The screech frequency,
 $ f_s$
, is then determined by the relationship (Edgington-Mitchell et al. Reference Edgington-Mitchell, Li, Liu, He, Wong, Mackenzie and Nogueira2022)
 \begin{equation} f_{s}=\frac {u_{d}k_{sw}}{2\pi \left (1+\dfrac {u_{d}}{u_{u}}\right )}, \end{equation}
and shows good agreement with experimental data.
For the calculation of the plate-induced noise frequency, attention is directed toward the H3 case, where plate-induced tones become evident in the absence of screech tones (Baier et al. Reference Baier, Karnam and Gutmark2020). This absence simplifies the extraction of phase velocities from figure 20. The relationship for calculating the plate-induced noise frequency, as proposed by Tam & Chandramouli (Reference Tam and Chandramouli2020), aligns well with the experimental observations from Zaman et al. (Reference Zaman, Fagan, Bridges and Brown2015) in their study of rectangular jet–plate interactions. Notably, the existence of a feedback resonance frequency for the plate is contingent upon the presence of upstream-propagating waves in the jet. Zaman et al. (Reference Zaman, Fagan, Bridges and Brown2015) and Tam & Chandramouli (Reference Tam and Chandramouli2020) observed that the absence of these upstream waves resulted in a defined cutoff Mach number. However, in the current study, the presence of upstream-propagating waves is evidenced in figure 20(h), as well as corroborated by figure 22(k). This observation is crucial for the existence of plate resonance, thereby validating the application of the proposed relationship in this context. The oscillation period, T, for the nth mode is given by the expression:
 \begin{equation} nT=\frac {L}{u_{d}}+\frac {L}{u_{u}}, \end{equation}
calculated as
 $ f = 1/T$
for different values of
 $ n$
, using the current plate length
 $ L = 5D$
. The frequencies and corresponding Strouhal number for varying
 $ n$
values are calculated and presented in table 4. This shows the influence of the phase velocities and plate length on the tonal frequencies observed in the plate-induced noise. It was observed that the analytical results for modes
 $ n = 4$
and
 $ 8$
closely align with the experimental data. For the fourth mode, the analytical Strouhal number
 $St = 0.23$
matches well with the experimental value
 $St = 0.22$
, as seen in figures 7, 8 and 20. Similarly, for the eighth mode, the analytical Strouhal number
 $St = 0.46$
is in close agreement with the experimental result
 $St = 0.44$
, as seen in figure 7. A summary of these calculated screech, plate-induced, and interaction tones for all configurations is provided in table 5.
Plate-induced tone at M3 calculated using (A2).
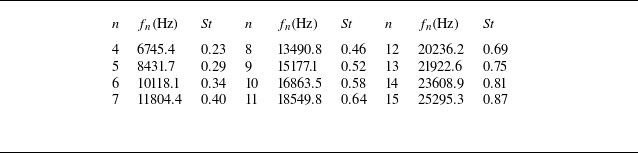
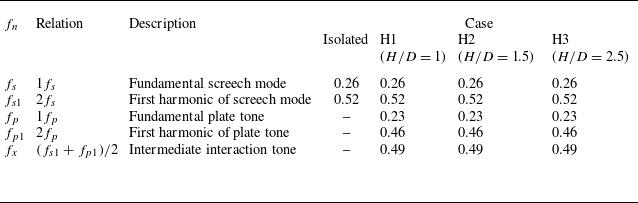
Appendix B. Shock-cell length
The shock-cell lengths corresponding to different operating conditions were estimated from the mean Schlieren images and plotted in figure 23. These computed values have been non-dimensionalised to obtain
 $L_{s}/D$
and plotted as a function of the fully expanded jet Mach number (M). For validation, the present results are compared with well-established correlations from Pack (Reference Pack1950) and Gao & Li (Reference Gao and Li2010), along with experimental data from Panda et al. (Reference Panda, Raman, Zaman, Panda, Raman and Zaman1997). As seen in the plot, the estimated shock-cell lengths show good agreement with the existing literature, thereby confirming the accuracy of the methodology employed. It is observed that the installation effects, represented by the H1, H2 and H3 cases, do not cause any significant deviation in the shock-cell length when compared with the isolated case. This indicates that, within the measurement uncertainty and the considered configurations, the installation has a negligible influence on the shock-cell length.
Comparison of non-dimensional shock-cell lengths (
 $L_{s}/D$
) as a function of fully expanded jet Mach number (M). Present measurements, derived from mean Schlieren images, are compared with empirical correlations from Pack (Reference Pack1950) and Gao & Li (Reference Gao and Li2010), and experimental data from Panda et al. (Reference Panda, Raman, Zaman, Panda, Raman and Zaman1997). Results for isolated and installed configurations (H1 (
 $H/D$
= 1), H2 (
 $H/D$
= 1.5), H3 (
 $H/D$
= 2.5)) show good agreement with existing literature, with minimal variation observed due to installation effects.

Appendix C. Wall-pressure spectra
To investigate the regions of jet–plate interaction, the jet boundary was extracted from the standard deviation of time-resolved Schlieren images. The extracted jet boundaries for the isolated and installed configurations at M2 = 1.16 and M3 = 1.44 are shown in figures 24(a) and 24(b), respectively. The plate position for the H1 configuration, the locations of the Kulite transducers and a reference line inclined at
 $7^\circ$
(representing the typical spreading angle of supersonic jets) are included for clarity.
The jet boundaries for the isolated and installed configurations are extracted using the standard deviation of the time-resolved Schlieren images for (a) M2 = 1.16 and (b) M3 = 1.44. The plate position corresponding to the H1 case is shown for reference, along with the Kulite transducer locations to aid interpretation.

The peak SPL values from figure 8 are extracted and plotted for screech mode A2 (
 $St = 0.55$
) at M2 = 1.16 (a) and screech mode C (
 $St = 0.26$
) at M3 = 1.44 (b), respectively.

As expected, the jet expands in the downstream axial direction. At M2 = 1.16 (figure 24
a), the upper shear-layer boundaries for the installed case closely follow those of the isolated configuration. However, significant deviations are observed in the lower shear layer, particularly for the H1 configuration, where the boundary intersects the plate at approximately
 $x/D = 5$
.
With increasing Mach number, as shown in figure 24(b), the upper shear layer continues to follow the isolated case, whereas pronounced deviations occur in the lower shear layer, particularly for H1, where interaction with the plate is evident at the axial location of transducer K4. Notably, the lower shear layer exhibits a greater spreading angle (
 $9.4^\circ$
) than the upper shear layer (
 $6.3^\circ$
), contrasting with the isolated jet, where the spreading angles are nearly symmetric (
 $4.8^\circ$
) in both shear layers. This asymmetric expansion toward the plate is attributed to the Coanda effect, consistent with observations by Baier et al. (Reference Baier, Karnam and Gutmark2020).
Figure 25 presents the peak SPLs extracted from the wall-pressure spectra shown in figure 8 for M2 = 1.16 and M3 = 1.44, corresponding to screech modes A2 and C, respectively. For M2 = 1.16 (figure 25
a), corresponding to screech mode A2 (
 $St = 0.55$
), the peak SPL values exhibit a monotonic decrease with increasing Kulite sensor location, particularly for the H2 and H3 configurations. The H1 case maintains relatively higher SPL levels across all Kulite locations, consistent with the stronger interaction between the jet and the plate at the closest position. As the plate height increases, the amplitude reduces, indicating weaker jet–plate interaction, diminished acoustic feedback and reduced screech tone amplitude.
The peak SPL values from figure 8 are extracted and plotted for the plate-induced tone at
 $St = 0.22$
for M3 = 1.44.

In contrast, for M3 = 1.44 (figure 25
b), corresponding to screech mode C (
 $St = 0.26$
), a different trend emerges. The H1 and H2 configurations show higher and relatively uniform SPL levels across all Kulite locations, suggesting sustained acoustic feedback and strong screech activity. The H3 configuration exhibits consistently lower SPL amplitudes at all sensor positions, reflecting the attenuation of the screech tone due to destructive interference mechanisms at this plate height, as discussed earlier in the paper.
Figure 26 presents the peak SPL values extracted from figure 8 for the plate-induced tone at
 $St = 0.22$
for M3 = 1.44. Interestingly, at Kulite location 1, the plate-induced tonal amplitude follows the trend
 $\textrm{H3} \gt \textrm{H1} \gt \textrm{H2}$
, which is consistent with the far-field noise spectra observations. However, based on
 $H/D$
, it is generally expected that the closest plate configuration H1, should exhibit the highest noise levels due to stronger interactions. This discrepancy is not immediately apparent from the far-field measurements alone. The wall-pressure data presented here provides critical insight: the Kulite transducer near the trailing edge shows a significant increase in the amplitude of the plate-induced tone for H1, clearly highlighting the local influence of the plate–jet interaction on the near-field pressure field. This constitutes an important observation, bridging the connection between far-field and near-field measurements for the installed configurations.