Buffalo mothers and calves have a strong mother–offspring bond (Mustafa et al., Reference Mustafa, Shahid and Mehmood2010). As these animals have not gone through such intensive genetic selection for milk production as European cattle breeds, the innate maternal bonding of buffalo dams and calves remains intact (Nardone et al., Reference Nardone, Ronchi, Lacetera, Ranieri and Bernabucci2010). This is reinforced by management, since buffalo mother–calf dyads are traditionally kept in dual-purpose systems where calves are allowed limited natural suckling from their mothers before or after milking, until they are completely weaned at 6–12 months of age (López et al., Reference Lopez, Elías and Delgado2008; Kumar, Reference Kumar2014). However, with recent increased emphasis in organized farms on intensive systems of production, there has been a shift from traditional rearing practices, and the separation of calves from their dams during the initial stage of life has become more common, as is typical for dairy cattle (Margerison et al., Reference Margerison, Preston, Berry and Phillips2003). Separation of calves from their mothers within 24 h of birth has a short term (in calves) and long term (in adult animal) influence on behaviour and response to stress since deprivation of maternal contact is linked, with the HPA-axis being more reactive with higher anxiety and more stereotypic behaviour (Latham and Mason, Reference Latham and Mason2008; Newberry and Swanson, Reference Newberry and Swanson2008; Sachser et al., Reference Sachser, Hennessy and Kaiser2011). Likewise, in buffalos, abrupt weaning immediately after birth is associated with a high cortisol level, poor growth rate and higher mortality rate in neonatal calves (Aref et al., Reference Aref, El-Sebaie and Hammad2016; Singh et al., Reference Singh, Kamboj, Chandra, Kumar and Kumar2019). Furthermore, it has been observed on various organized as well as in small buffalo farms in India and Pakistan, that the mortality rate is approximately 52% following limited contact and allowing restricted suckling (Pasha, 2013). This is because of poor colostrum management (Echeto et al., Reference Echeto, Vargas, Oviedo, de Vale, Castejon and Garcia2002) as buffalo calves are born agammaglobulaemic at birth (Hedegaard and Heegaard, Reference Hedegaard and Heegaard2016; Bharti et al., Reference Bharti, Dutt, Patel, Pandey, Gaur, Singh, Kamal, Verma and Upadhyay2017) and are slow at learning how to bottle feed (Smijisha and Kamboj, Reference Smijisha and Kamboj2012). These systems do have lower incidences of oral stereotypies in the calves compared to artificially reared calves (Kumar, Reference Kumar2014), but may not fully satisfy the behavioural needs of both mothers and their calves as repeated separations are stressful. In addition, when separated from their dams, calves have poor social skills, difficulties in dealing with novelty, lower learning ability and perhaps exaggerated negative emotions (Costa et al., Reference Costa, Von Keyserlingk and Weary2016).
With respect to the adverse consequences of separation in cattle and buffaloes, recent studies have shown that a fenceline mother–calf system (FCMC) can reduce stress and improve the health and growth of dairy and buffalo calves (Johnsen et al., Reference Johnsen, Zipp, Kälber, de Passillé, Knierim, Barth and Mejdell2016; Hassan et al., Reference Hassan, Mahmoud, Soliman, El-Mahdy and Hassan2019; Choudhary et al., Reference Choudhary, Kamboj, Jamwal, Pal, Arora, Ingle and Lathwal2022). Sirovnik et al. (Reference Sirovnik, Barth, De Oliveira, Ferneborg, Haskell, Hillmann and Johnsen2020) defined FCMC as limited physical contact between a mother and her own calf, allowing olfactory, visual, auditory and limited tactile contact. Further, Choudhary et al. (Reference Choudhary, Kamboj, Jamwal, Pal, Arora, Ingle and Lathwal2022) reported that the provision of full mother contact along with voluntary choice colostrum suckling from birth to 5 d followed by fence line mother contact and twice daily suckling at milking time reduced the separation and weaning stress and remarkably improved the growth, immune status and health of Murrah buffalo calves compared to calves which were allowed only limited contact twice daily or calves which were weaned at birth.
A number of investigations have explored the possibility that postures of ear may be indicative of emotional states in sheep, pigs and cattle (Reefmann et al., Reference Reefmann, Kaszàs, Wechsler and Gygax2009; Reimert et al., Reference Reimert, Bolhuis, Kemp and Rodenburg2013; Proctor and Carder, Reference Proctor and Carder2014). As far as we are aware, however, no study to date has observed buffalo ear postures and their potential as emotional indicators.
Bearing in mind all this information, we hypothesized that calf–mother contact would reduce the stress level, boost health and growth performance, abolish or reduce abnormal behaviour and improve the physiological state of mother-contacted buffalo calves. Therefore, the aim was to study the influence of different mother contact contacts on the health, growth performance, behaviour and physiological state of Murrah buffalo calves.
Materials and methods
The study was conducted at the Livestock Research Centre, ICAR – National Dairy Research Institute, Karnal, Haryana, India (29°42′ N; 76°58′ E, altitude = 227 m above mean sea level). The maximum environmental temperature range is 40–43°C in summer, and 2–15°C in winter. The experiment began in September 2019 and ended in November 2019. The Institutional Animal Ethics Committee approved the study, which was conducted following IAEC established standards as per Article Number 13 of the committee for the Control and Supervision of Experiments on Animals (CPCSEA) policies of the Government of India.
Experimental design
After parturition, a total of 24 calves were allocated to three treatments (n = 8 each), with each treatment balanced for calf birth-weight (31.4 ± 1.2 kg, 29.4 ± 1.3 kg and 30.3 ± 1.1 kg).
In the first group, the calves remained isolated from their mothers (NCM = No Calf–Mother Contact). The calves were separated from their dams immediately after their birth and were housed in a neonatal calf shed eliminating any social contact with their dams. Calves were offered colostrum for the first 5 d, and then whole milk from their mothers twice daily at 6.00 and 18.00 h, using plastic nipple bottles at the rate of 10% of the body weight until nutritional weaning.
Calves from the second experimental group had restricted contact with their mothers, (RCM). After parturition, the calves were allowed to be licked by their dams, and were housed in the same pen until after the first suckling of colostrum and then were separated from the dams and group-housed in a calf pen. They were allowed contact for 30 min with their mothers twice daily at 6.00–6.30 h and 18.00–18.30 h during which time they were allowed to suckle colostrum (10% of the body weight). This process was repeated for 5 d. After the sixth day, the calves were housed about 200 m away from their mothers and were allowed to suckle milk (10% of the body weight) twice daily (6.00 and 18.00 h) in the milking parlour.
The third group of calves had fenceline calf–mother contact (FCM). In this group, calf–mother pairs were kept together in the same calving pen during the first 5 d after parturition thereby allowing an opportunity for full physical contact, with voluntary access for calves to suckle colostrum. From the sixth day onwards, calves and dams were separated by a fenceline made up of galvanized iron pipe railings to a height of 5-ft, and with wire mesh sections between the railings. Further, these calves were allowed physical contact for 30 min and suckling of milk at about 10% of their body weight twice daily at each milking until nutritional weaning (6.00–6.30 and 18.00–18.30).
Housing and feeding of calves
The experimental calves were housed in a loose housing system within a roofed shed with an adjoining open paddock. The housing had a total floor space of 3 m2 per calf, a common feed-trough accessible through a fenceline feed barrier, and a common drinker. The provision of floor space and feeding space was consistent with the standards of the Bureau of Indian Standards for buffaloes in loose housing systems (BIS: 1223-1987). The floors of the calves' sheds were made of concrete, with grooves under the covered and open area. Calves of RCM and NCM groups remained in the calf pen having a closed shed adjoining through the gate, with an open paddock. The fenceline group calves were kept in the loose shed with mothers having a covered area with a connecting open paddock.
Calves were given whole buffalo milk twice a day at 10% of their body weight until 3 months. From the second week of age, chopped maize green fodder and calf concentrate were offered ad libitum. The calf concentrate mixture was composed of maize 35%, wheat bran 20%, gram 10%, groundnut cake 32%, mineral mixture 2%, and common salt 1%. Clean, fresh water and access to a salt lick were offered ad libitum.
Body weight and average daily gain
The body weight of each calf was recorded immediately after birth and then at weekly intervals. Weights of all calves were recorded in the morning between 6:00 a.m. and 6:30 a.m., before feeding and watering, using an electronic weighing machine with a precision of 200 g. Average daily gain (ADG) was calculated in grams as: (Final body weight-Initial body weight)/weekly intervals and expressed in g/day.
Diarrhoea score and eggs per gram (EPG)
Each calf was examined and given a diarrhoea score for the first 42 d of life. The health of all the calves was monitored on a daily basis for the first 42 d of life to record occurrence of diarrhoea. The scoring was done on a scale of 1–5 (for details refer to the online Supplementary File). To quantify the parasitic load, the eggs/g of faeces was assessed monthly for the first three months of life. A sedimentation and flotation technique was used and eggs were counted using the McMaster procedure. One gram of faeces was emulsified in 14 ml saturated salt solution. The slide was charged using a pipette after being strained. Floating eggs that stuck to the surface were counted under a microscope. The number of eggs counted was multiplied by 100 to get the number of eggs per gram in the faeces of calves for the various treatment groups.
Blood collection
Calves had their blood sampled through jugular venipuncture on days 0, 7, 28, 42 and 56 following their birth. Blood samples were immediately placed on ice to estimate immunoglobulin G1 (IgG1) and cortisol. Plasma was separated by centrifugation at 1200 rpm for 20 min. Blood samples were kept at −20°C until the IgG1 and cortisol hormone concentrations were determined. These were determined using Elisa kits for bovine IgG1 and bovine cortisol (‘Bovine Immunoglobulin G1 ELISA Kit'Cat.No E0385Bo, ‘Bovine Cortisol ELISA Kit’ Cat.No E0110Bo) from Life Science Inc. Ltd.
Observations on behaviour and ear posture
Continuous observations of behaviour were used to assess the frequency and duration in minutes of the abnormal behaviours performed by the calves (cross-sucking, licking inanimate things, self-licking) and their ear posture (backward, forward, asymmetrical, axial). Observations were made for 4 h once a week using a CP Plus Network Video recorder placed in the calf pen for all treatments. The time period for recording behaviour patterns was divided into four phases of one hour (9:00–10:00 a.m.; 12:00–1:00 p.m.; 3:00–4:00 p.m.; 6:00–7:00 p.m.) according to the occurrence of specified behaviour, but recording of cross sucking was done one hour before and after milking in the morning and evening hours due to the occurrence pattern of this behaviour. For ethogram of various behaviour and ear postures refer to the online Supplementary File.
Statistical analyses
The effect of treatment on body weight, ADG, diarrhoea score, egg counts, concentrations of IgG, and cortisol and abnormal and general behaviour along with various ear postures were assessed using a mixed model (IBM SPSS Statistic 22.0 computer software). Treatment, time, and their interaction were included as fixed effects, and the individual calves were included as random effects. Differences were considered statistically significant when P < 0.05. Results are presented as LS means ± sem.
Results
Body weight and average daily gain
The mean weight at birth was similar across the calves of the three groups, but there was an effect of treatment on the overall body weight at three months of age. The FCM calves were heavier that the RCM and NCM calves (P < 0.05) with no statistical difference between the RCM and NCM groups (mean and sem (kg) = 58.6 ± 1.5; 52.8 ± 1.3; 53.6 ± 1.3 for FCM, RCM and NCM calves respectively). The overall average daily gain (kg/d) at three months of age was greater in the FCM calves (0.6 ± 0.1) compared to the RCM (0.5 ± 0.1) and NCM (0.5 ± 0.1) calves (P < 0.05). Data are given in online Supplementary File Tables S3 and S4.
Immunoglobulin G and cortisol concentrations
Data are given in online Supplementary File Tables S5 and S6. There was an effect of time and group, and an interaction between treatment and time on the IgG and cortisol concentrations (P < 0.01 for all). The IgG concentrations were similar (P > 0.05) across the three groups of calves on d 0 at around 0.5 ng/ml, but were significantly greater in FCM than in RCM and NCM calves on d 7 (26.5 ± 0.8, 22.3 ± 0.5 and 19.7 ± 0.5), d 28 (23.1 ± 0.5, 18.5 ± 0.2 and 16.1 ± 0.5), d 42 (22.8 ± 0.5, 18.4 ± 0.2 and 15.9 ± 0.5) and d 56 (22.8 ± 0.6, 18.3 ± 0.2 and 15.9 ± 0.5) of sampling (P < 0.05 for all comparisons).
The cortisol concentrations on d 0 (7.1 ± 0.2 vs.12.6 ± 0.3 vs. 21.5 ± 0.4), d 7 (4.5 ± 0.3 vs. 8.0 ± 0.2 and 14.8 ± 0.8), d 28 (2.8 ± 0.1 vs. 5.9 ± 0.3 and 9.4 ± 0.5), d 42 (2.6 ± 0.1 vs. 5.7 ± 0.3 and 9.2 ± 0.5) and d 56 (2.4 ± 0.1 vs. 5.6 ± 0.3 and 8.9 ± 0.4), differed significantly among the three groups (P < 0.05, for all recorded days), being highest in the NCM calves followed by RCM and lowest in the FCM calves, respectively.
Diarrhoea score and eggs per gram in faecal samples
There was an impact of rearing system on the diarrhoea scores and eggs per gram in the faecal samples (P < 0.05 for all: online Supplementary File Table S7). When the diarrhoea scores of the treatment groups were compared, the NCM (2.7 ± 0.3) calves had significantly higher (P < 0.05) scores than the FCM calves (1.5 ± 0.2). However, the RCM (2.1 ± 0.4) group's diarrhoea score did not differ significantly (P = 0.11) from FCM and NCM group.
Throughout the experiment, monthly observations for eggs per gram in faeces for the calves in the FCM, RCM and NCM groups (Month 1: 37.5 ± 18.3, 50.0 ± 18.8 and 175.0 ± 45.3; Month 2: 25.0 ± 25.0, 37.5 ± 18.3 and 125.0 ± 36.5; Month 3: 25.0 ± 16.3, 50.0 ± 26.7 and 125.0 ± 31.3, respectively) revealed substantially greater (P < 0.05) EPG in faeces for calves in the NCM group compared to the FCM and RCM groups.
Cross-sucking, licking inanimate objects and self-licking
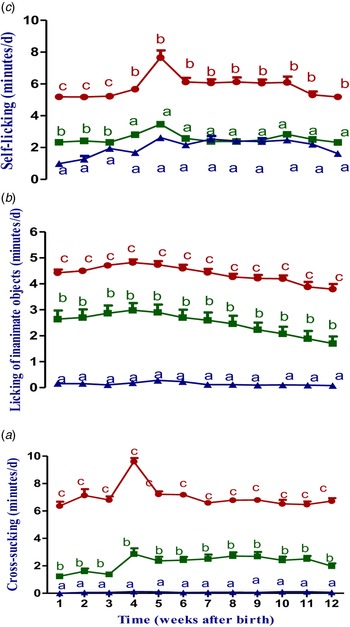
There was a significative effect of time, a treatment group and a treatment-time interaction on the cross-sucking behaviour of calves (P < 0.01). The time spent in cross sucking was greater (P < 0.01) in NCM calves, followed by RCM calves, and was almost non-existent in the FCM group in all the recorded weeks (Fig. 1a).
(a) Cross-sucking behaviour (min/d), (b) licking of inanimate objects (min/d) and (c) time spent on self-licking (min/d) of Murrah buffalo calves that had fenceline mother contact (‒▴‒; FCM), restricted mother contact (‒■‒; RCM) or no mother contact (‒●‒; NCM). The data are presented as LS means ± sem. Dissimilar letters indicate differences between the mean values of the groups in that time point (P < 0.05).

There were significant (P < 0.01) effects of time, group and the interaction between group and time on the time that calves spent on licking inanimate objects. The time spent on licking of inanimate objects was greatest in the NCM calves followed by RCM and lowest in the FCM calves on all the recorded weeks (P < 0.05) (Fig. 1b).
The data on the mean time spent in self-licking by calves are presented in Figure 1c. There were significant effects of group, time and the interaction between groups and time (P < 0.01 for all). The average time spent in self-licking differed significantly between the three groups of calves on 1, 2, 3 and 12 weeks, being greatest in the NCM calves followed by RCM and lowest in the FCM calves. However, it was significantly greater on week 4, 5, 6, 7, 8, 9, 10, 11, 12, in NCM calves than in RCM and FCM calves (P < 0.05 for all weeks).
Standing, resting and play behaviour
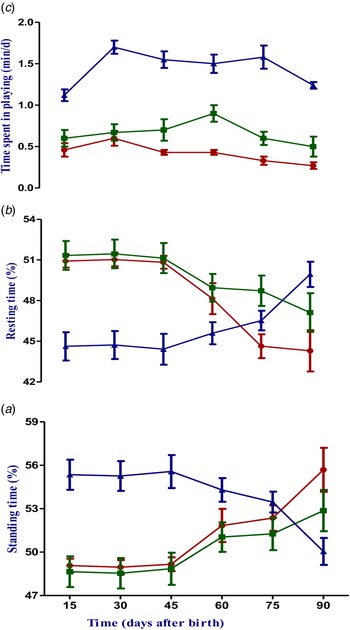
The data on the mean per cent time spent on standing and resting by calves are presented in Figure 2a and 2b. There was an effect of time, group, and an interaction of treatment and time on the time spent on standing and resting by calves (P < 0.05 for all). The average per cent time spent on standing was significantly lower in the FCM calves than in RCM and NCM calves on d 15, 30 and 45 (P < 0.05, for all days).
(a) Standing time (%), (b) lying time (%) and (c) time spent on playing (min/d) of Murrah buffalo calves that had fenceline mother contact (‒▴‒; FCM), restricted mother contact (‒■‒; RCM) or no mother contact (‒●‒; NCM). The data are presented as LS means ± sem. Dissimilar letters indicate differences between the mean values of the groups in that time point (P < 0.05).

The mean per cent time spent in resting by calves was higher (P < 0.05) in FCM calves as compared to RCM and NCM groups of calves on d 15, 30 and 45 of recording. However, it was statistically similar on days 60, 75 and 90 between the three groups of calves. The data on the mean duration (min/h) of play behaviour of calves are presented in Figure 2c. There were effects of time, group and interaction of groups and time on the duration of calves play behaviour (P < 0.05 for all). The average duration of play behaviour on d 15, 30, 45, 60, 75, and 90 was greater (P < 0.05) in FCM calves, followed by RCM, and was shortest in the NCM group.
Different ear positions
Backward ear position was measured in multiple groups of calves, with calves in the FCM (110.7 ± 1.5 min/d) group spending significantly more time with their ears facing backward (P < 0.05) than those in the RCM (78.2 ± 0.6 min/d) and NCM (68.4 ± 1.0 min/d) group. The average time calves spent with an forward ear position differed significantly (P < 0.05) among the three groups of calves, being greatest in the RCM (82.4 ± 0.6 min/d) calves followed by NCM (73.2 ± 0.8 min/d) and lowest in the FCM (64.4 ± 0.9 min/d) group of calves.
The mean duration of time spent with an asymmetrical ear position differed significantly between NCM, RCM and FCM groups of calves (24.6 ± 0.4, 28.9 ± 0.4 and 20.6 ± 0.7 min/d, respectively, P < 0.05). The overall mean duration of time spent in the axial ear position was significantly greatest (P < 0.05) in NCM (73.8 ± 1.2 min/d) calves followed by RCM (50.4 ± 0.7 min/d) and FCM (44.5 ± 1.2 min/d) calves.
Discussion
The results of this study support the original hypothesis that calf–mother contact reduces stress levels, boosts health and growth performance and abolishes occurrence of abnormal behaviour and improves the physiological state of mother contacted calves.
The greater body weight and ADG attained by calves that were housed with their mothers during the initial days of life and then received fenceline contact probably has a number of causes. Firstly, they had the opportunity for adequate colostrum intake. The maintenance of the social bond and interaction between calf and its mother during the initial days of life having a positive emotional and calming effect on the calf could also be important (Krohn et al., Reference Krohn, Foldager and Mogensen1999). By contrast, the lower body weight and ADG in the artificially reared calves is partly due to the lower intake of colostrum in the initial days of life and partly because of maternal separation stress. Moreover, artificially reared buffalo calves have been reported to be immature and slow at learning compared to cattle calves, and therefore required more time to be taught to drink from a bottle or pail (de la Cruz-Cruz et al., Reference De la Cruz-Cruz, Bonilla-Jaime, Orozco-Gregorio, Tarazona-Morales, Ballesteros-Rodea, Roldan-Santiago and Vargas-Romero2019). Also, the calves display reluctant behaviour to drink during bottle-feeding training sessions, resulting in higher stress levels in the calves. However, this study also supports the hypothesis that natural suckling and restricted contact of calves with their mothers had better growth rate and lower stress levels than completely maternally separated calves.
The findings of the current study complements previous research suggesting that buffalo calves are born agammaglobulaemic and rely heavily on maternal colostrum for passive immunity (Bharti et al., 2015; Hedegaard and Heegaard, Reference Hedegaard and Heegaard2016). They need an adequate amount of colostrum at frequent intervals to promote the development of appropriate levels of passive immunity (Hammon and Blum, Reference Hammon and Blum1998; Choudhary et al., Reference Choudhary, Kamboj, Jamwal, Pal, Arora, Ingle and Lathwal2022). Thus, this illustrates the real importance of provision of full physical calf–dam contact and consequent full opportunity for ingestion of colostrum compared to a limited contact and artificial feeding system for buffalo calves. This superior access to colostrum for the full calf–mother contact group calves in the present study presumably facilitated the higher IgG concentrations in these calves compared to the artificially reared and restricted contact groups. Further, the limited suckling group had higher IgG levels compared to the artificially reared calves, presumably because of limited maternal contact. Natural suckling may have enhanced the absorption and utilization of immunoglobulin in the calves (Selman et al., Reference Selman, McEwan and Fisher1971; Krohn et al., Reference Krohn, Foldager and Mogensen1999).
Calves in the fenceline and restricted contact groups had lower diarrhoea scores and EPG values. Maternal interactions could facilitate the consumption of higher colostrum intake in the initial days of life. Further, we assumed that the greater villus size of the small intestine mucosa in repeatedly colostrum-fed calves (Blum, 2006), would lead to greater absorption and utilization of the colostrum bioactive components, resulting in lower diarrhoeal score and EPG. In contrast, the calves that were separated from their mothers had higher diarrhoeal score and EPG probably because of delayed colostrum intake resulting in delayed gut development. Moreover, the 12-h inter-suckling period may increase hunger levels, encouraging calves to gulp more milk quickly in a shorter time, leading to frequent diarrhoea. This quick and shorter suckling period, devoid of the fulfillment of natural suckling behaviour of calves, may have encouraged non-nutritional licking of inanimate objects, leading to higher EPG in these calves.
The calves who maintained social contact with their mothers, initially with full contact and subsequently through a fenceline, had a shorter duration of oral stereotypies. Maternal contact and free access to colostrum encouraged the calves to spend the majority of their time sleeping and resting. Although not directly investigated in this study, this is likely to have a favourable impact on the development of oral stereotypies. However, limited calf–mother contact and suckling may not entirely meet the normal behavioural demands of calves, because repeated separations are unpleasant, resulting in increased oral stereotypies. Similarly, complete mother separation and artificial bottle-feeding cause calves become more frustrated, resulting in a higher propensity to perform abnormal behaviours to satisfy their intense suckling desires (Froberg et al., Reference Froberg, Gratte, Svennersten-Sjaunja, Olsson, Berg, Orihuela, Galina, Garcia and Lidfors2008; Rath, Reference Rath2020).
Higher resting time and play behaviour in fenceline reared calves may be due to the visual, olfactory, auditory and tactile maternal contact. Social interaction with the mother may lead the calf to exhibit more social play and a higher resting time because of lower separation stress.
To the best of our knowledge, this is the first study in buffaloes investigating different ear postures as indicators of emotional state in artificial and mother reared buffalo calves. The calves kept in fenceline contact with their mothers had more time spent in the backward ear position, which is supposed to be triggered by the positive stimulus of social interactions during low arousal level periods that are comfortable, content and cheerful, resting, interacting with the mother and at feeding (Reefmann et al., Reference Reefmann, Kaszàs, Wechsler and Gygax2009). Further, forward ear position, asymmetrical ear position and axial positioning of the ears were higher in calves kept in restricted contact and no-mother contact groups. Based on our observations, we assumed that these ear positions were adopted by calves when they were stressed, frightened or agitated during their daily activities (Battini et al., Reference Battini, Agostini and Mattiello2019). It has also been observed that calves assume asymmetrical and axial ear postures when they are in a confused state, lack ability to make decisions or are uncertain, alarmed or overly alert as a response to challenges in their environment (Battini et al., Reference Battini, Agostini and Mattiello2019). When separated from their mothers, research has shown that calves have poor social interaction skills, difficulties in dealing with novel stimuli, impaired learning abilities and probably intensified negative emotions (Costa et al., Reference Costa, Von Keyserlingk and Weary2016). Therefore, the results of the present study suggest that the no-mother contact and the repeated separation and reunion of the restricted access treatment results in higher stress-related arousal as expressed by the time spent with the ears in the ‘negative’ postures. This emphases the importance of calf-mother contact in social learning and expression of emotions in buffaloes, and therefore implies that although fenceline contact might be better than complete separation, it still limits the potential ability of calves to experience the most positive emotional situation.
In conclusion, fenceline calf–mother contact buffalo calves had increased growth rate, reduction in some stress responses, fewer oral stereotypies and better intestinal health than those without maternal contact. In addition, ear postures may be used as a dependable and reliable measure of positive, low excitement emotional state.
Supplementary material
The supplementary material for this article can be found at https://doi.org/10.1017/S0022029922000747
Acknowledgements
This research was funded by the ICAR-National Dairy Research Institute, Karnal, Haryana (India).