Much variationist work explores which speakers use innovatory forms within a community (Britain, Reference Britain2005; Docherty, Foulkes, Milroy, Milroy, & Walshaw, Reference Docherty, Foulkes, Milroy, Milroy and Walshaw1997; Trudgill, Reference Trudgill1974), but fewer studies focus on speakers who continue to use recessive forms and in which phonological and conversational contexts they are preserved. This study samples speakers from ex-coalmining villages in Northeast England, which have witnessed considerable social change through industrial decline over the past half-century. It investigates usage of a form highly localized to parts of the region: the [ɛʊ] variant of the mouth vowel (Wells, Reference Wells1982),Footnote 1 compared to a nonlocalized [aʊ] variant. The distribution of the form across four geographically contiguous speech communities is examined to assess whether the change from one form to the other is gradual or abrupt, as well as use of the form across age groups and across conversational topics.
ECONOMIC AND LINGUISTIC CHANGE
Older work on recessive heritage forms sampled nonmobile older rural males (NORMs) (Chambers & Trudgill, Reference Chambers and Trudgill1998:47) in isolated villages. Considered more likely to resist change (Schilling, Reference Schilling, Chambers and Schilling2013:36), British (Orton, Reference Orton1962:15) and American (Kurath, Reference Kurath and Ware1940) NORMs produce nonstandard, conservative vernacular speech, though not always (Stoddart, Upton, & Widdowson, Reference Stoddart, Upton, Widdowson, Foulkes and Docherty1999). Subsequently, Labov's (Reference Labov1963, Reference Labov1972) celebrated Martha's Vineyard study explored the retention of traditional features on an isolated island through the social dynamics of the community. By linking the differentiation of the speech patterns with islanders’ changing norms and conflicting attitudes toward the island compared to the US mainland, highly localized pronunciations were shown to reflect orientation to traditional lifestyles.
Modern discussions of the construction of place have highlighted the role of social influences. Variants gain associations with repeated use in the same environments (Johnstone & Kiesling, Reference Johnstone and Kiesling2008) and use of certain forms indexes speakers’ allegiances to social groups (Lawson, Reference Lawson2009) or places (Llamas, Reference Llamas2007). Speakers construct place “as they experience physical and social space, and different speakers may orient to place, linguistically, in very different ways for very different purposes” (Johnstone, Reference Johnstone and Fought2004:66).
Recently, there appears to be a renewed focus on “historical dialect enclave communities” (Wolfram, Reference Wolfram, Nagle and Sanders2003:143) and small neighboring localities, both urban (Britain, Reference Britain1991, Reference Britain2005) and rural (McNair, Reference McNair2002), and across physical and perceptual borders (Llamas, Reference Llamas2007; Llamas, Watt, & Johnson, Reference Llamas, Watt and Johnson2009). Studies have explored the preservation of heritage linguistic features in new generations or environments among insular communities, labeled dialect “concentration” (Wolfram & Schilling-Estes, Reference Wolfram and Schilling-Estes1999). For example, in the Appalachian mining area of West Virginia, gradient differences in forms of pronunciation were found according to the degree of sociolinguistic awareness speakers have about each feature, its linguistic prevalence, and its level of stigma. Features which non-Appalachians consider uneducated construct a “down-home” West Virginian sociolinguistic identity that highlights speakers’ origins (Hazen & Hamilton, Reference Hazen and Hamilton2008:113).
TOPIC SHIFT
Speakers create and enact identity through language, with shifts related to the speaker's own identity (Becker, Reference Becker2009; Lawson, Reference Lawson2009) or influenced by someone else (Mendoza-Denton, Hay, & Jannedy, Reference Mendoza-Denton, Hay, Jannedy, Bod, Hay and Jannedy2003). Fine-grained acoustic phonetic variation has been explored: Glaswegians produce a retracted /æ/ form associated locally with violent gang speech when discussing violent conversation topics (Lawson, Reference Lawson2009); a traditional rhotic variant in local conversational topics in New York was interpreted as a response to the perceived decline of the “authentic” local accent (Becker, Reference Becker2009:653); and the degree of rhoticity in the speech of US sports fans shifts significantly according to whether the talk is about English association football clubs or American football teams (Love & Walker, Reference Love and Walker2013).
Exploring the historical change in New Zealand medial /t/ from [t] to [d], Hay and Foulkes (Reference Hay and Foulkes2016) showed that situating the conversational topic in different eras affects variant realization, with more frequent usage of the older [t] variant in conversations about older events and discussions of more recent events eliciting the innovative [d] variant. This may be due to people storing and accessing particular pronunciations and social and contextual information (such as the situation in which the exchange occurs) from each encounter they have with a particular token of a word. Linking the pronunciation of a feature with the environment in which it is uttered—including topic of conversation—means that particular variants may associate more readily with certain situations (Goldinger, Reference Goldinger, Johnson and Mullennix1997; Hay & Drager, Reference Hay and Drager2010).
The more a speaker encounters different variant forms over time, the more the variant used by that individual shifts, which accounts for the replacement of forms in speakers who move to a different dialect area (Hay & Foulkes, Reference Hay and Foulkes2016). Equally, the fact that these geographically mobile speakers have been shown to revert back to the pronunciation found in the previous location during interactions with speakers who have not left the area (Howell, Barry, & Vinson, Reference Howell, Barry and Vinson2006), suggests that older exemplars of interactions with speakers from the native location remain accessible to these speakers even after a long time living away—this is called ‘remembered time’ (Hay & Foulkes, Reference Hay and Foulkes2016:304).
Hay and Foulkes (Reference Hay and Foulkes2016:322–325) accounted for their results by suggesting that older topics reflect a shift in identity toward a historic representation of the speaker, by projecting a version of himself at the time of the event being discussed, including his contemporary speech patterns. This effect may also interact with addressee-influenced shift, whereby particularly old topics might be most likely discussed with older speakers, meaning that forms associated with these events are biased toward older pronunciations associated with these older speakers (Bell, Reference Bell1984). Certain topic-specific groups of words, overwhelmingly used in restricted speaker groups or situations, can be the last to change in a historical phoneme shift; for example, French-Canadian words with old-fashioned associations (glacière, ‘ice-box’) are produced with older vowel variants (Yaeger-Dror, Reference Yaeger-Dror, Guy, Feagin, Baugh and Schiffrin1996; Yaeger-Dror & Kemp, Reference Yaeger-Dror and Kemp1992).
Research on the derhoticization of New Zealand English (Gordon, Campbell, Hay, Maclagan, Sudbury, & Trudgill, Reference Gordon, Campbell, Hay, Maclagan, Sudbury and Trudgill2004), in which lexical items were categorized according to topic, found specialist vocabulary associated with “old-time” New Zealand lifestyles, such as farming and mining terms, were more likely to retain the conservative, declining feature of coda /r/ than other, nonspecialist words (Gordon et al., Reference Gordon, Campbell, Hay, Maclagan, Sudbury and Trudgill2004:182). The study found that only topic-specific vocabulary—and not words with more general currency produced in the same conversational topic—were significantly more likely to feature the traditional rhotic form (Gordon et al., Reference Gordon, Campbell, Hay, Maclagan, Sudbury and Trudgill2004:281).
THE COMMUNITY
The research site is four adjacent former colliery communities situated on a nine-mile (15km) stretch of the County Durham coast (henceforth East Durham). Dawdon, Easington, Horden, and Blackhall lie between two urban centers and dialect zones: Sunderland to the north and Hartlepool (Teesside) to the south.
They are socially and economically homogeneous according to various measures, including indices of ethnic diversity, average household income, and level of business activity (Office for National Statistics, 2012). They have been depopulating since the 1970s (Historical Geographical Information System Project, 2014), with similar population sizes below 10,000 inhabitants, and population densities between 0.025 and 0.181 people/km2, less than the UK average of 256 people/km2 (Office for National Statistics, 2012).
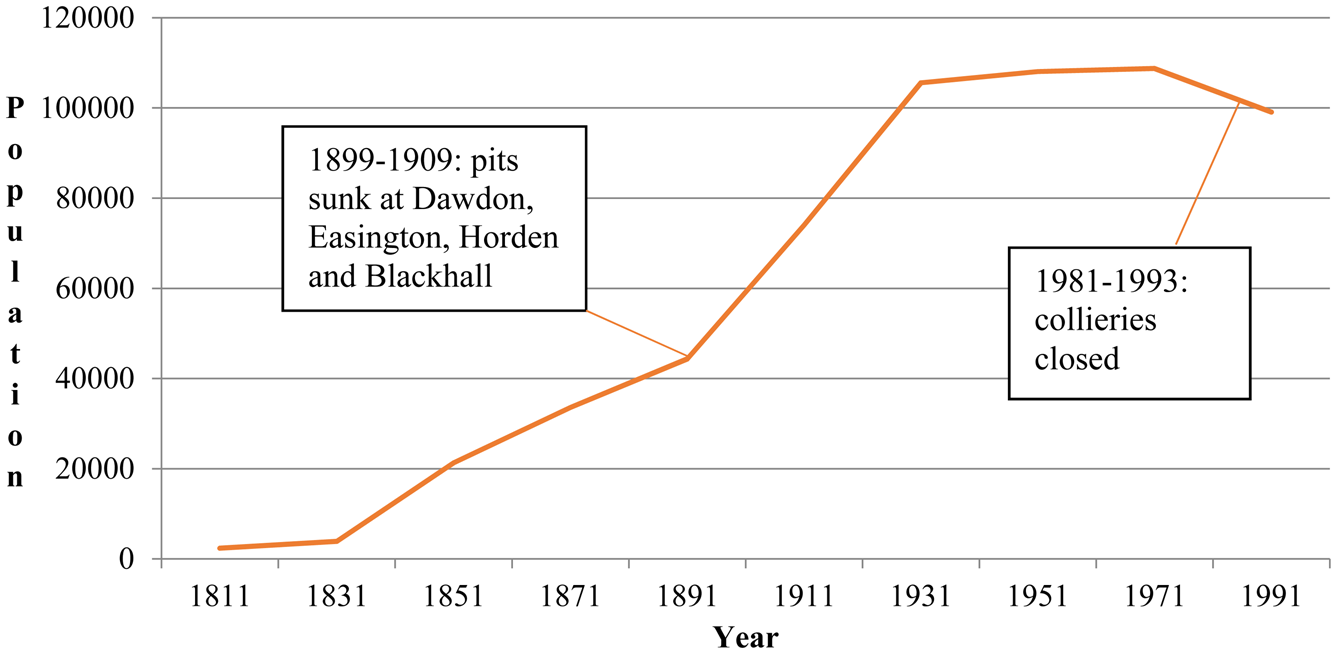
The research site sits within the once extensive Durham coalfield. Coal extraction began in the thirteenth century, significantly expanding from the 1830s (Wilkinson & McCay, Reference Wilkinson, McCay, Fox, Moore and McIntosh1998). At the turn of the twentieth century, coal brought the first major development to East Durham, with pits sunk at Easington in 1899, Horden in 1904, Dawdon in 1907, and Blackhall in 1909 (Durham Records Office, 2012) and villages growing around the mines. Figure 1 shows that during the 20-year census period when these collieries opened, the district population increased by 67% from 44,351 to 74,036 (Historical Geographical Information System Project, 2014).
Population change of East Durham district 1811–1991.

By 1911, 152,000 men were employed in a coal mine in County Durham, representing 30% of the county's total workforce (McCord, Reference McCord1979:111). During the national decline of the industry in the latter half of the twentieth century, almost all pits in Northeast England closed; the East Durham collieries shut between 1981 and 1993.
Coalmining has had a linguistic influence. Dialect perception survey respondents consider the East Durham dialect to differ from other local areas due to its mining heritage; “people who are from a village or a colliery have a different twang than those who live in the town centre a couple of miles from these pit villages” (Pearce, Reference Pearce2009:176). “Pitmatic,” a term conceived as a nineteenth-century industrial glossary of coalmining techniques, developed as the dialect of pitmen (Griffiths, Reference Griffiths2007:10), but also covering all other speakers living in the general geographic area where coal mines once stood.
MOUTH VARIATION
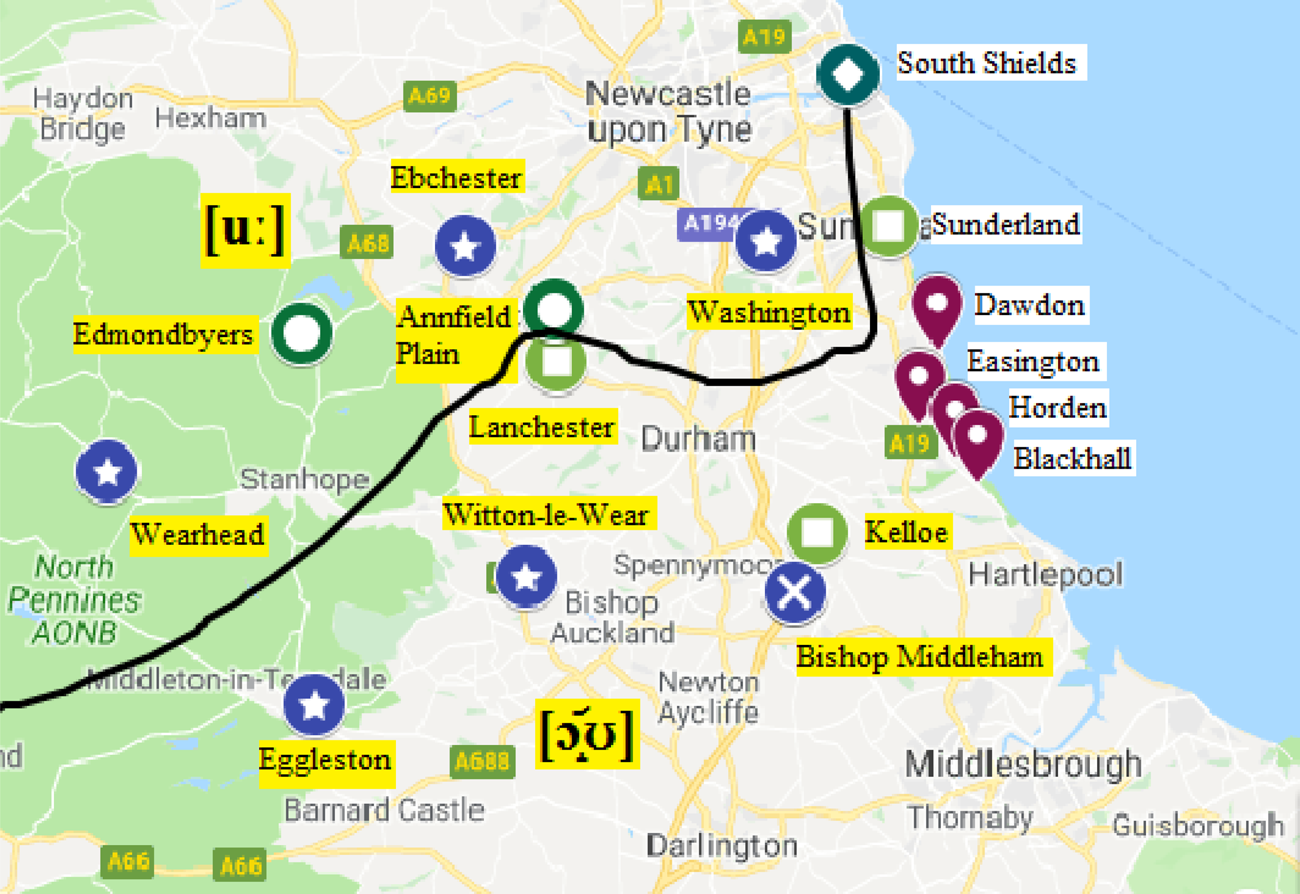
The mouth vowel varies on a region-to-region (Ellis, Reference Ellis1889) or even town-to-town (Britain, Reference Britain1991) basis in many varieties of English (Britain, Reference Britain2008; Chambers, Reference Chambers1973). The British standard form is a diphthongal variant approximating [aʊ] (Wells, Reference Wells1982:151). The earliest record of mouth variation in Northeast England found no evidence of [aʊ] low nucleus diphthongs. Instead, usage varied between the unshifted monophthong [uː]Footnote 2 in the north and west of the region, and a high diphthong [ɔ̝᷄ʊ],Footnote 3 found further south and east (Ellis, Reference Ellis1889:649). Figure 2 shows a representation of this boundary, with the research site of this study situated in the categorically [ɔ̝᷄ʊ]-producing area.Footnote 4 This dividing line remains intact at the time of the Survey of English Dialects (SED) seventy years later (Orton & Dieth, Reference Orton and Dieth1962–71), with zero instances of [aʊ] or other open nuclei reported in the six Durham locations surveyed.
Map of mouth pronunciations recorded in locations surveyed by Ellis (Reference Ellis1889), with circle markers indicating [uː] usage and square markers indicating [ɔ̝᷄ʊ] usage (South Shields has both), and Survey of English Dialects (1962–71) Durham locations indicated by star markers (Bishop Middleham is sampled by both Ellis and SED) with the villages sampled in this study marked with balloons (Google, 2019).

More recently, many traditional features in Northeast Englishes have undergone change toward supralocal forms covering a wider geographical area at the expense of highly local variants (Kerswill, Reference Kerswill, Britain and Cheshire2003). Communities 16 miles (26 km) west of Durham have undergone “an almost total change, over two generations” from monophthong [uː] to a closing diphthong with a low, back nucleus ([ɑʊ]) (Kerswill, Reference Kerswill2002:192). [u:] is now restricted to a smaller geographical area centering on more northerly Newcastle-upon-Tyne (Beal, Reference Beal2000:348; Pearce, Reference Pearce2009:184), and the main alternative variant to [aʊ] in Sunderland English is the raised, fronted [ɛʊ] diphthong, with these two forms recorded as being used roughly equally (Beal, Burbano-Elizondo, & Llamas, Reference Beal, Burbano-Elizondo and Llamas2012:35). In contrast, only the open [aʊ] form is found in Hartlepool, meaning that mouth variation either side of East Durham depends upon the presence or absence of a raised diphthong [ɛʊ].
There is some evidence that [ɛʊ] is salient in Sunderland. Beal (Reference Beal2000:352) highlighted a series of cartoon strips from a local newspaper that focused on the intercity rivalry between Newcastle-upon-Tyne and Sunderland. They showed repeated use of [εu] phonetic spellingsFootnote 5 in speech of stereotyped characters from Sunderland. Given the research site's location between Sunderland, where [εu] and [aʊ] compete, and Hartlepool, where [εu] is not found, the present study explores the distribution of East Durham speakers’ usage of [εu] and [aʊ] variants.
METHODOLOGY
Participants
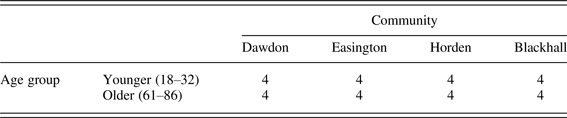
Table 1 shows how 32 males were divided into two emically defined cohorts (Friedman & Schustack, Reference Friedman and Schustack2003:448) according to an objectively defined shared life stage, roughly representing the life stages of young adulthood and retirement. Two extreme age ranges were deliberately chosen to reflect the changing identity of East Durham in terms of the availability of coalmining as a local occupation, with the older generation growing up when mining was a major local employer, and the younger generation raised since the closure of the local collieries. From these age groups, apparent time variation and its connection with the demise of the local coal industry was examined in terms of speakers’ attitudes toward mining and other aspects of life in the local community.
Distribution of participants

The young adult group (hereon “younger”) comprises 16 speakers born between 1979 and 1993 (aged 18 to 32 years, mean = 23.5 years, at the time of recording), an almost direct match with the timeline of pit closures in East Durham (1981 to 1993). This confirms that none of the younger cohort were able to work in a coalmine locally and suggests that even the oldest participants in the younger group grew up with the coal industry in the throes of terminal decline. There are also 16 speakers in the retirement group (henceforth “older”), born between 1925 and 1950 (aged 61 to 86 years, mean = 71.2 years), when the mining industry thrived in East Durham, meaning these speakers were able to work in the regional coalmining industry for almost an entire working life.
Method of elicitation
Using a Zoom H4 mobile digital solid-state recorder with DPA 4066 headset microphones and adapters, participants were recorded speaking to the lead author, whose East Durham upbringing minimized accommodation effects (see Llamas et al.’s [Reference Llamas, Watt and Johnson2009] discussion of the interviewer effect). The 16-bit stereo recordings were sampled at 44,100 Hz and transferred from the recorder's memory card to a computer.
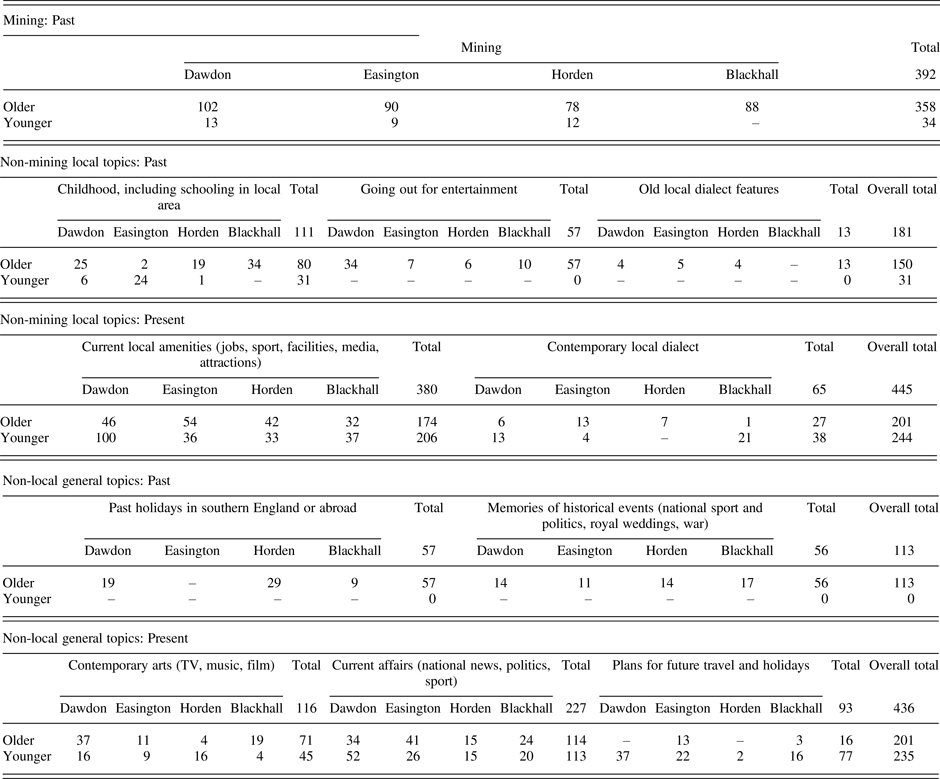
Interviews were conducted in locations familiar to the participants, like their homes or community centers, in order to try to create a relaxed atmosphere conducive to eliciting casual speech (Feagin, Reference Feagin, Chambers and Schilling2013). A structured sociolinguistic interview to test for the effect of conversational topic on variant production was devised, incorporating two tasks eliciting read speech: a word list which included four tokens of the mouth vowelFootnote 6 and a passage of text which included 13 mouth tokens.Footnote 7 Conversational data were obtained through an oral discussion of an Identity Questionnaire (IdQ), divided equally into three sections: about coalmining, other local topics, and general topics. Table 2 shows a full list of topics discussed, and coding of these sections is explained below.
Tokens elicited in each interview topic

Llamas’ (Reference Llamas1999) IdQ from the Survey of Regional English methodology was adapted with the original questions augmented to elicit data specifically pertaining to coalmining and the local area. The IdQ correlates spontaneous responses from participants about their attitude toward their local area and the language used therein (Johnston, Reference Johnston and Kirk1985:83) with the production data (Llamas, Reference Llamas2001:88). Among other topics, questions cover perceptual dialect boundaries (Montgomery & Beal, Reference Montgomery, Beal, Maguire and McMahon2011) and linguistic identity (Le Page & Tabouret-Keller, Reference Le Page and Tabouret-Keller1985), and a Sense-Relation Network data elicitation task evaluates respondents’ awareness and usage of dialect-specific synonyms for standard notion words in terms of distribution and social meaning locally (see Llamas, Reference Llamas1999:98).
Method of analysis
A total of 2,092 tokens were coded for vowel quality, conversational context (Gordon et al., Reference Gordon, Campbell, Hay, Maclagan, Sudbury and Trudgill2004), recency of topic (Hay & Foulkes, Reference Hay and Foulkes2016), and the age (Kerswill, Reference Kerswill2002), geographical origin (Williams & Kerswill, Reference Williams, Kerswill, Foulkes and Docherty1999), orientation (Labov, Reference Labov1963), and occupation of the speaker. Triphthongs (power, towel) were excluded from analysis (Britain & Sudbury, Reference Britain and Sudbury2007) due to the potential for “smoothing” (Wells, Reference Wells1982:238–242). A limit of five tokens of a lexical item was enforced per speaker per interview topic.
As the mouth vowel varies locally between [εʊ] to [aʊ], the acoustic F1 value is taken to reflect the height of the diphthong nucleus. Age may affect first formant frequencies: repeated tracking of individual speakers shows F1 values following a V-shaped curve of decrease followed by increase over time (Reubold, Harrington, & Kleber, Reference Reubold, Harrington and Kleber2010), although corner vowels such as [a] are much less likely to change (Eichhorn, Kent, Austin, & Vorperian, Reference Eichhorn, Kent, Austin and Vorperian2018). Reference F1 values for males from nearby Newcastle-upon-Tyne are reported at around 515 Hz for [ɛ] and 695 Hz for [a] (Ferragne & Pellegrino, Reference Ferragne and Pellegrino2010).
Recordings were opened and played using Praat software (Boersma & Weenink, Reference Boersma and Weenink2012), with the first two formants of each token measured at stable points in a spectrogram set to display frequencies up to 5000 Hz. Assuming that adult males typically produce speech sounds containing one formant per 1000 Hz (Ladefoged, Reference Ladefoged2003), the ‘number of formants’ command that seeks and plots the formants on the spectrogram was set at 5.0, but sometimes found formants more clearly at a setting of 4.5 formants. Following transition from any preceding segment, one reading was taken near the start of the nucleus. The other measurement was made toward the end of the offglide. Measurements were executed manually by cursor movements, with the inbuilt measuring tool disabled due to inaccurate measurements being provided (Adank, Van Hout, & Smits, Reference Adank, Van Hout and Smits2004). If formant bars were not clearly plotted, these tokens were excised from the analysis, as it was not possible to confidently take a formant reading. All measurements were rounded to the nearest 5 Hz.
The impact of coalmining on variant usage is explored in terms of mining as a traditional conversational topic (mining topic/other local topic/nonlocal topic). As Hay and Foulkes (Reference Hay and Foulkes2016) found that older topics elicit more traditional pronunciations, tokens were also coded for ‘remembered time’: whether the discussion related to the past or present. Due to the demise of the coal industry in the late twentieth century, mining topics were based entirely in the past, with even the (few) tokens elicited from younger speakers referring to recollections of stories related by grandfathers who had worked in the industry. Interviewees were also asked for their outlook about East Durham, and, specifically, whether they felt positively or negatively toward the two larger urban areas of Sunderland and Hartlepool, in order to explore participants’ identity and orientation to the local area. A full breakdown of the numbers of tokens elicited from different topics in the past and present time is provided in Table 2.
RESULTS
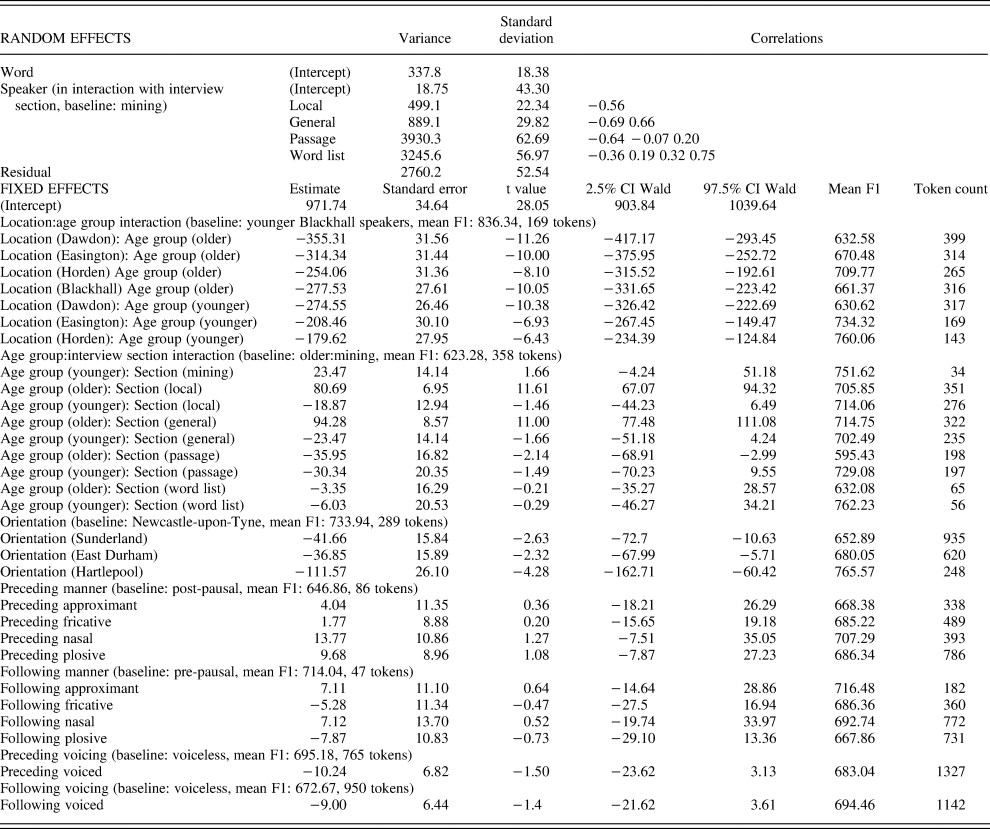
Table 3 shows the linear mixed effects model produced in RStudio version 3.5.0 (R Core Team, 2018) to test significance of the dependent variable of F1 values according to the independent variables.Footnote 8
Output from the mixed effects model for F1 of mouth

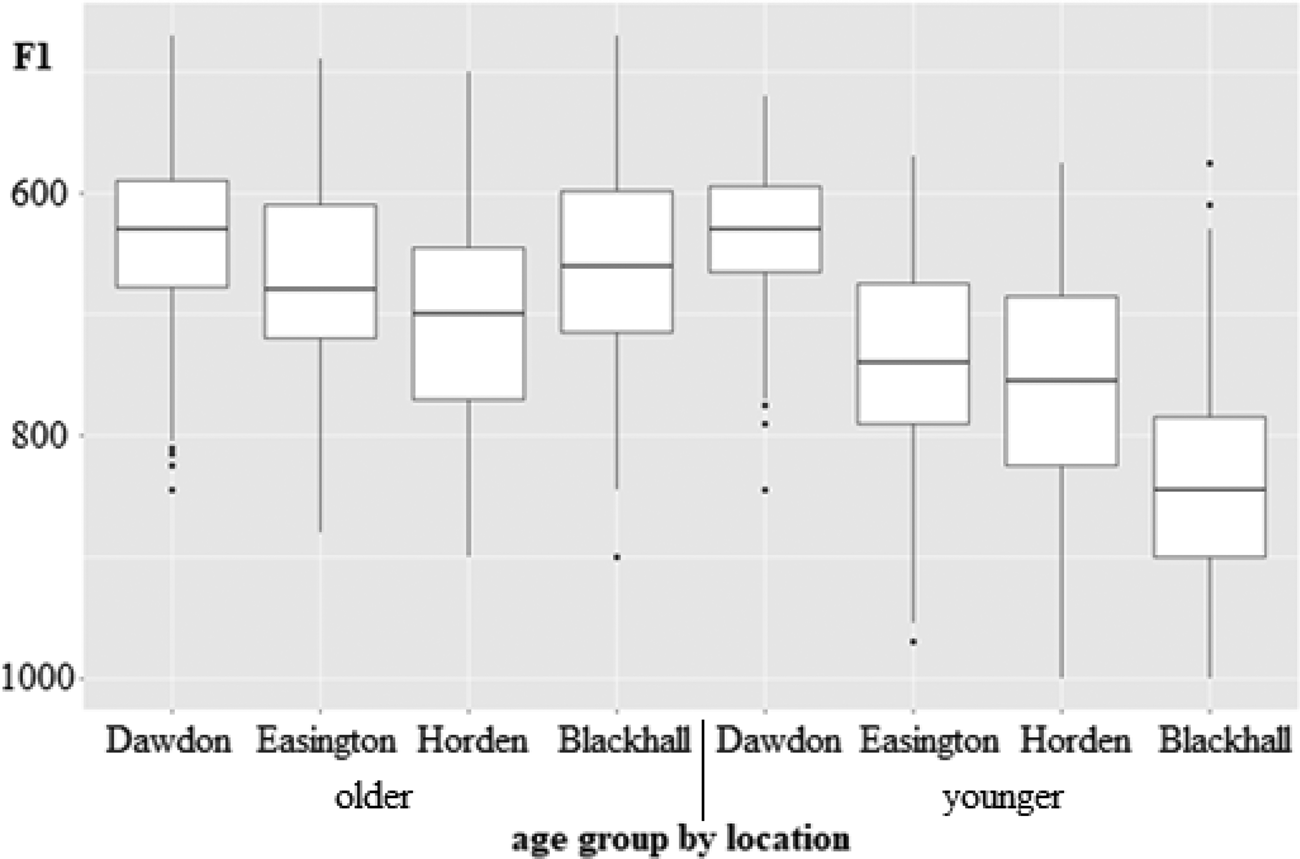
Interaction of age and location
Figure 3 shows that speakers in Dawdon, the village closest to [ɛʊ]-retaining Sunderland, produce a greater proportion of variants with closer F1 values–more [ɛʊ]-like–than villages further away, among both age groups. Older speakers in Horden produce an average F1 value of 710 Hz, compared with 670 Hz average F1 among older speakers in more northerly Easington, and 630 Hz average F1 among older speakers in northernmost Dawdon. A gradual shift is thus demonstrated across geographical space from Horden north to Dawdon, although Blackhall does not participate in this trend because older speakers in this village produce an average F1 value of 660 Hz, lower than more northerly Easington and Horden (discussed further below).
Overall distribution of mouth variants by age and location (n = 2092).

The younger speakers show more marked differences with a range of more than 200 Hz between the average F1 value found among younger speakers in northernmost Dawdon (630 Hz) compared to Easington (735 Hz), Horden (760 Hz), and most southerly Blackhall (835 Hz). While both age groups in Dawdon have similar F1 scores, Easington and Horden younger speakers’ F1 values are on average 50 Hz more open than their elders in their villages, a difference which increases to 175 Hz between the two Blackhall age groups. An interaction between location and age group is therefore a highly significant improvement to the model (χ2 (6) = 48.322, p < 0.001).
Orientation
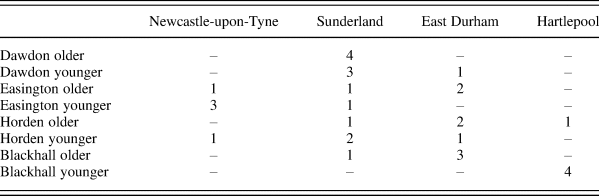
Using IdQ data that asked respondents about their local identity, pride in their hometown, and where they spend their leisure time, speakers were categorized by which local place they most affiliated with. As well as the four villages, which have been merged as ‘East Durham’ in order to avoid replication with the speaker location factor in the model, speakers also discussed their connections to the two larger urban areas surrounding East Durham: Sunderland and Hartlepool. A minority of speakers oriented to Newcastle-upon-Tyne, as shown in Table 4.
Orientations of speakers to East Durham or other local places

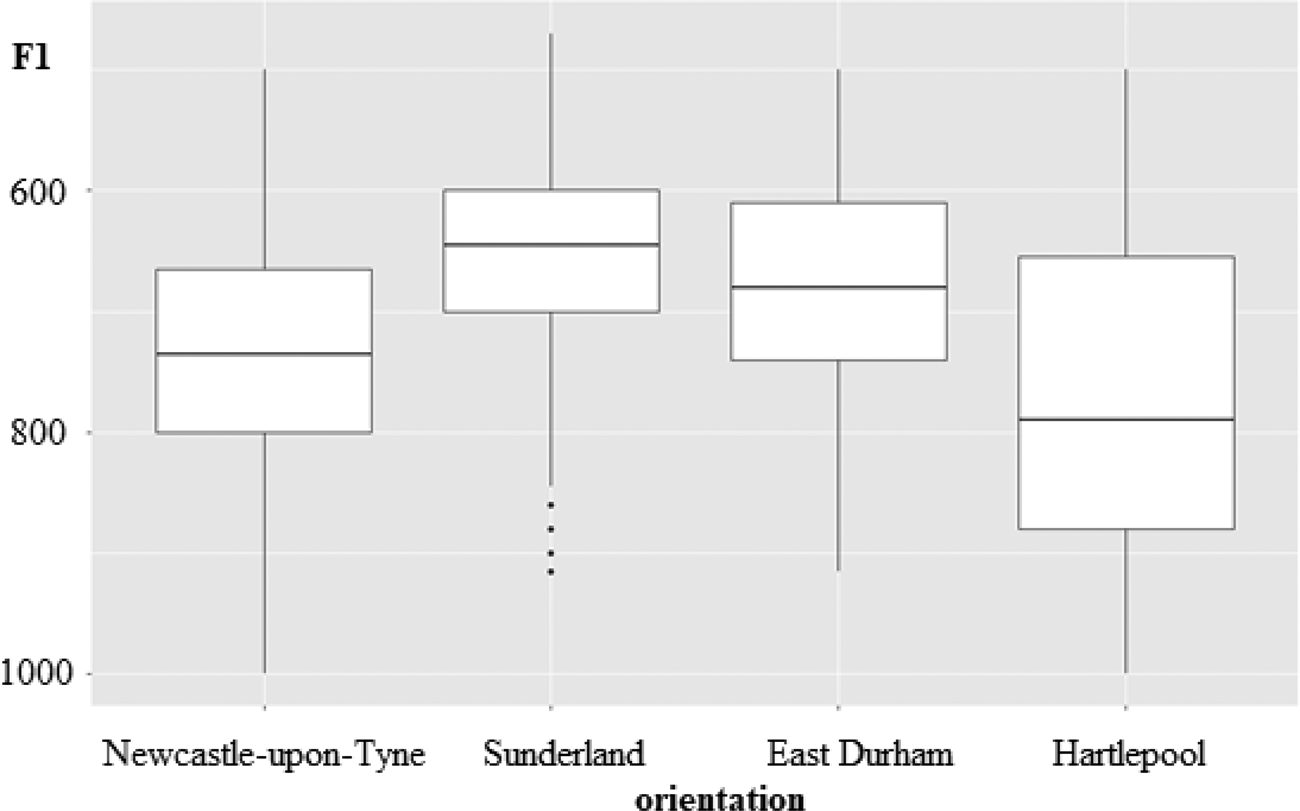
Figure 4 shows that speakers who orient to Newcastle-upon-Tyne or Hartlepool—two locations where [εʊ] is not associated—produce more open mean F1 scores than those who orient to Sunderland or the East Durham villages, where mouth diphthongs with raised nuclei are traditionally found (Beal et al., Reference Beal, Burbano-Elizondo and Llamas2012; Ellis, Reference Ellis1889). With reference F1 values for males from nearby Newcastle-upon-Tyne reported at 515 Hz for [ɛ] and 695 Hz for [a] (Ferragne & Pellegrino, Reference Ferragne and Pellegrino2010), the mean F1 score among speakers affiliating with Newcastle is 735 Hz, compared to 765 Hz for those orienting to Hartlepool. These scores are 50 to 100 Hz lower than the values recorded among those affiliating with Sunderland (650 Hz) or East Durham (680 Hz). Speaker orientation is therefore shown to significantly affect F1 score (χ2 (3) = 13.747, p < 0.01).
Overall distribution of mouth variants by speaker orientation (n = 2092).

Interaction of age and intraspeaker variation
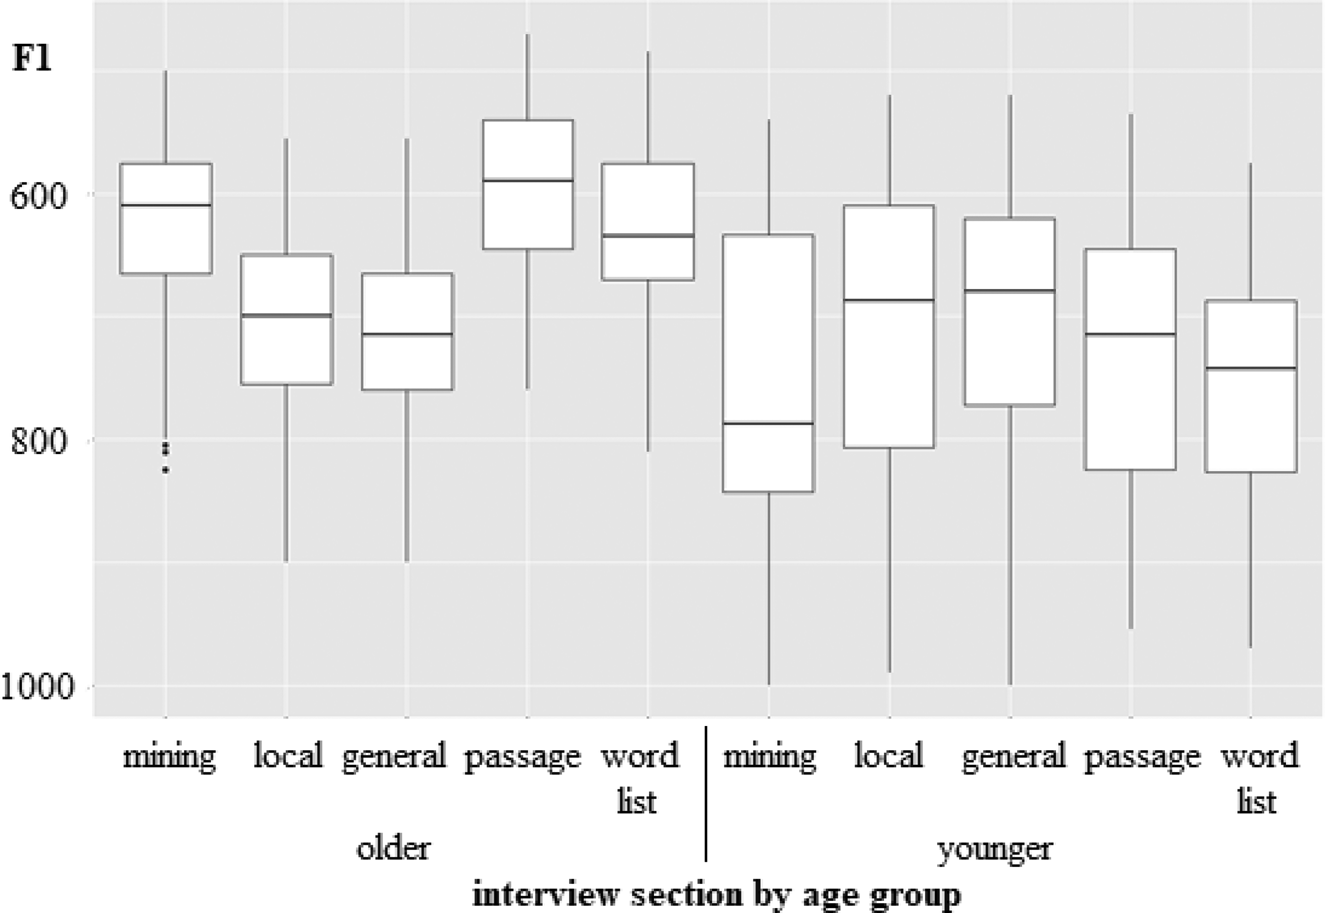
As discussed above, read and interview speech were demarcated into five subsections, resulting in two read speech subcategories encompassing the word list and the passage of continuous prose, and three conversational contexts covering mining, local topics other than mining, and nonlocal (general) topics. Figure 5 shows that both age groups have similar distributions of F1 score between the two nonmining conversational topics, with mean values in the range of 700 to 715 Hz. Mining mean F1 values are nearly 100 Hz lower than both other topics among the older speakers (mean: 625 Hz) but are more open among younger speakers (mean: 750 Hz). F1 values in the nonmining conversations are also more open than in the read speech sections among older speakers. Age and interview section in interaction therefore significantly affects F1 score (χ2 (8) = 57.256, p < 0.001).
Overall distribution of mouth variants by age and interview section (n = 2092).

DISCUSSION
Geographic patterns
[ɛʊ] does not occur in Hartlepool and is used less frequently than both another local variant, [u:], and nonlocal [aʊ] in Newcastle-upon-Tyne (Beal et al., Reference Beal, Burbano-Elizondo and Llamas2012:35) but is considered a “shibboleth” of Sunderland English (Beal, Reference Beal2000:353). This is supported by this study's finding that [ɛʊ] is most frequently used by speakers located near or strongly affiliated to Sunderland.
[ɛʊ]-like pronunciations are used by speakers in all four East Durham villages, suggesting a “mixed lect” (Chambers & Trudgill, Reference Chambers and Trudgill1998:110) between the Sunderland variety, where [ɛʊ] and [aʊ] both compete, and Hartlepool speech, where the [aʊ] form dominates. However, each village's distribution is distinctive, supporting the perceptual finding that speech patterns differ from place to place (Pearce, Reference Pearce2009:165). Dawdon, nearest Sunderland, shows a significantly different distribution to the other three villages, although in general the findings suggest a gradual change from north to south, with F1 values incrementally more open as geographical distance from Sunderland increases. However, this pattern does not extend to the most southerly village of Blackhall, with a closer average F1 value among older speakers there than in the middle villages of Easington and Horden.
People construct and relate to regions differently (Montgomery & Beal, Reference Montgomery, Beal, Maguire and McMahon2011), so dialect zone boundaries can overlap: Atkinson (Reference Atkinson2011: 245–255) found Teesside speakers linguistically diverging from the rest of Northeast England in producing vocalic variants found in varieties from the more southerly region of Yorkshire (cf., Watt & Tillotson, Reference Watt and Tillotson2001; Williams & Kerswill, Reference Williams, Kerswill, Foulkes and Docherty1999). In contrast, speakers in the Yorkshire city of York (around 60 miles/96 km south of Hartlepool) converge with the Northeast over the rest of Yorkshire (Richards, Haddican, & Foulkes, Reference Richards, Haddican and Foulkes2009), suggesting that the boundaries of the Yorkshire and Northeast dialect zones intersect.
In attitudinal data from the IdQ, the older Blackhall speakers are more likely to orient away from Hartlepool than those from Horden. When asked their opinions of Hartlepool and its accent, none of the four older Horden men gave negative responses:
“People from the pit villages would go to maybe the town, Hartlepool…there used to be a fair bit of rivalry…but it was always a friendly sort.” Horden speaker, aged 75
In contrast, three of the four older Blackhall speakers recalled strained relations between the two places, stressing the difference in speech patterns between Blackhall miners who were labelled “pit yackers” and Hartlepool:
“The lingo–total different, cultural change and everything from just two mile down the road to Hartlepool. People worked in different industries, they talked different…it was pretty hostile when we were young'uns.” Blackhall speaker, aged 69
“When we used to go down as teenagers down to Hartlepool from the pit villages, we were called the yackers coming and invading…when you used to go down there you were cast as invaders.” Blackhall speaker, aged 68
These differences in perceptions of Hartlepool are consistent with Figure 4, which shows that speakers who orient toward Hartlepool produce more open vowels than those who affiliate with East Durham or Sunderland. Table 4 shows that the group that orients to Hartlepool includes one older Horden speaker but no older Blackhall speakers. This divergence from Hartlepool may explain why older speakers in Blackhall produce less open vowels than older speakers in Horden, despite their closer geographic proximity to the area where more open mouth vowels are found.
Coalmining did not extend south of Blackhall to Hartlepool, which instead has a nuclear power plant that directly competed with the East Durham mines (Davenport, Reference Davenport1984). Many older speakers lamented the role of the nuclear industry in Hartlepool as accelerating the loss of coalmining and thus viewed Hartlepool negatively:
“They should never have built that nuclear power station at Hartlepool. That should've been a pit, that.” Easington speaker, aged 64
“It's horrible, Hartlepool - they're nothing like us.” Easington speaker, aged 61
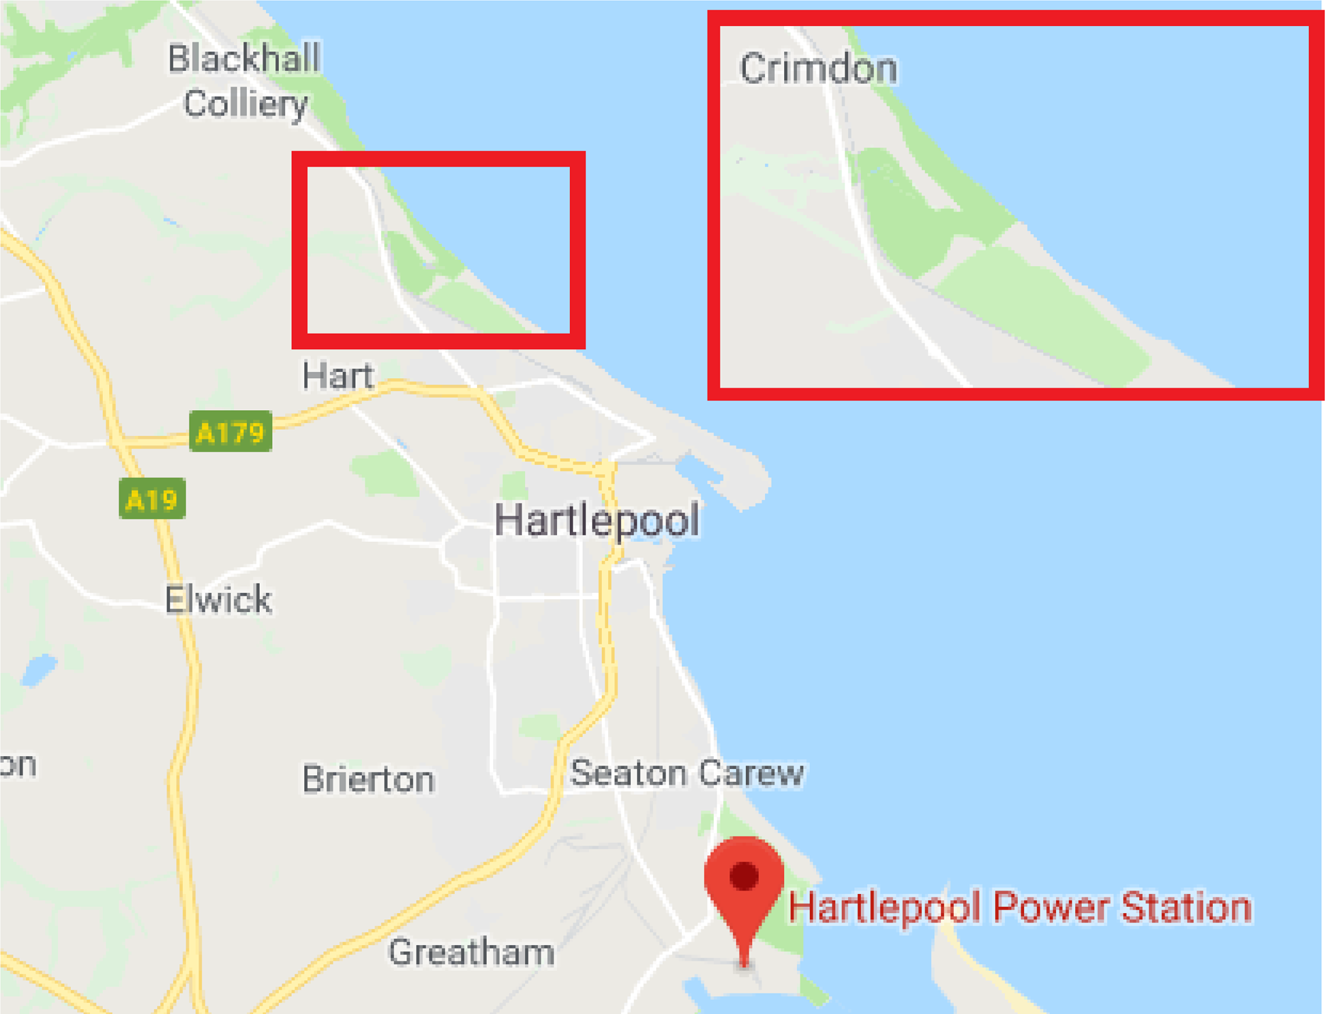
Britain (Reference Britain1991:612–13) reported the emergence of a social boundary between locations with categorically different realizations of the mouth vowel in the Fens in Eastern England. Such culturally constructed boundaries also affect East Durham: the county border ends between Blackhall and Hartlepool, and the aversion to Hartlepool's nuclear industry among East Durham miners suggests the creation of a pair of socially determined outgroups. These combine with physical obstacles within the built environment—Figure 6 shows Crimdon Dene, a valley situated between Blackhall and HartlepoolFootnote 9—to explain the presence of some [ɛʊ] in Blackhall but none in Hartlepool. Despite the contiguity between Blackhall and Hartlepool, the older Blackhall speakers conceive a place identity in opposition to Hartlepool.
Map of notable physical and perceptual boundaries between Blackhall and Hartlepool (Google, 2018).

Change over time
The age-correlated data suggest change in progress from local [ɛʊ] realizations to the unmarked [aʊ] variant, indicating dialect leveling in common with other Northeast locations such as Newcastle-upon-Tyne (Watt, Reference Watt2002) and west Durham (Kerswill, Reference Kerswill2002). The increase in more open F1 values among younger speakers in all locations but Dawdon results in speech that is less like Sunderland English, representing a divergent linguistic trend. [ɛʊ] is largely preserved across the age groups in Dawdon, in line with Wolfram and Schilling-Estes’ (1999) “concentration” model of dialect maintenance. This seems to be explained by the speaker orientation data in Table 4, as all but one of the older and younger speakers from Dawdon affiliated with [ɛʊ]-producing Sunderland:
“Newcastle's sort of got their own language but Hartlepool and ‘Boro [Middlesbrough] I think have got a bit of a difference. I think Sunderland, Dawdon, Easington, Horden, all of them places, we're all relatively the same.” Dawdon speaker, aged 18
Outside Dawdon, younger speakers were less likely to orient toward Sunderland and, accordingly, five of the eight younger respondents from the two middle villages, Easington and Horden, felt that Sunderland's accent was different from their own:
“I think Easington's categorized with Dawdon. I think maybe once you get to after Ryhope way [Sunderland] it starts to change.” Easington speaker, aged 23
“If you put me in a room with somebody from Dawdon and somebody from Horden I don't think I'd be able to tell the difference [but] you can tell the difference with Sunderland.” Horden speaker, aged 25
These responses also classify Dawdon, Easington, and Horden accents as similar, despite the large difference between F1 values in Dawdon compared to the other villages. However, two of the four younger Dawdon speakers perceive the accent of the southernmost village, Blackhall, to be different:
“I've got a mate from Blackhall and I think he sounds slightly different.” Dawdon speaker, aged 21
“It definitely changes there. It's more like Hartlepool.” Dawdon speaker, aged 21
This is borne out in the production data that show younger Blackhall speakers producing F1 values more than 200 Hz more open than younger Dawdon speakers, and almost 100 Hz more open than the nearest village of Horden. The attitudinal data point to potential convergence with the Hartlepool variety—in stark contrast to the older Blackhall speakers—with all four of the younger Blackhall speakers perceiving their accent to be indistinguishable from Hartlepool, and considering the village to be a part of Hartlepool:
“I would say I have a typical Hartlepool accent.” Blackhall speaker, aged 30
“I think Blackhall's part of Hartlepool, yeah.” Blackhall speaker, aged 32
Coalmining and a sense of place
Physical spaces are socially constructed, experienced, and given meaning as places by speakers, and this can affect linguistic behavior (Britain, Reference Britain2000). Places can be delimited by political, historical, and economic criteria as well as by shared experiences (Johnstone, Reference Johnstone and Fought2004:66–69), so that to be a “pit yacker” or to talk “pitmatic” requires someone from East Durham to adopt a stance in relation to the coal mines that formerly peppered the local landscape.
“It's still important. It's the reason our ancestors came to live here and we're still here but the community has lost something pretty major. We still organize things at the Welfare [Hall] and go into the schools to talk about the pit to keep it alive but it's not the same, obviously.” Easington speaker, aged 64
“I don't know much about it [mining] really. I've been down where the pit was but there's no trace of it anymore. It's all just walkways and beach fronts now.” Easington speaker, aged 23
Although these two speakers can both be considered representative of Easington in the demographic sense of their upbringing and current residence there, economic change affecting the local area may have led them to inhabit different “lifestyle enclaves” within the same geographic space (Giddens, Reference Giddens1991:147), and their disparate orientations to the mining heritage of the village provide two distinct interpretations of what being from Easington really incorporates.
Given the presence of [aʊ] across the Northeast and elsewhere in the UK, [ɛʊ] can be interpreted as both nonstandard and local (to nearby Sunderland). Schilling-Estes (Reference Schilling-Estes2002) showed that speakers faced with economic and social change shift toward old variants associated with local place identity in certain styles. Although nothing in the extant literature confirms that [ɛʊ]-like pronunciations are heritage mining forms, it may be that, when older speakers discuss the highly locally resonant topic of coalmining, these forms reflect their local identity, which indexes both East Durham geographically and mining historically as components of place. Although it has been shown that long-standing local forms may persist among speakers if they become markers of local identity (Johnstone, Bhasin, & Wittkofski, Reference Johnstone, Bhasin and Wittkofski2002), usage of [ɛʊ] was not mentioned by any of the speakers in the qualitative data to be especially noticeable to them as a marker of local speech. However, Beal (Reference Beal2004) found that local people's perceptions of linguistic features were not a bar to them becoming local identity markers, with monophthongal [u:] mouth forms said to be highly stigmatized in nearby Newcastle-upon-Tyne but nevertheless prevailing as a marker of that place. Furthermore, speakers have been shown to be unaware that they produce certain local variants (Johnstone & Kiesling, Reference Johnstone and Kiesling2008), which may also be the case with [ɛʊ]-like realizations in East Durham.
Dyer (Reference Dyer2002) showed that the social associations of a variant can be reallocated by speakers in order to reflect a different place identity from previous generations, with short [o] goat realizations signifying Scottish origin among older speakers who had migrated to Corby, Northamptonshire and simultaneously indexing affinity to Corby over a nearby rival town among younger males. Thus, even within one geographic community, the same forms may refer to different social characteristics depending on the speaker group. The [ɛʊ] form has appeared in Newcastle-upon-Tyne media as a negative stereotype of Sunderland English (Beal, Reference Beal2000), and perhaps—like [o] in Corby—has been reallocated to assert positive Sunderland place identity by locals, which has spread to nearby East Durham through contact. Alternatively, it may simply be the case that variant usage and speaker orientation do not correlate neatly, as found in nearby Middlesbrough where increased usage of glottalized /p/ reflected convergence with production patterns in Newcastle-upon-Tyne, even though Middlesbrough speakers evaluated neither Newcastle as a place nor its accent positively (Llamas, Reference Llamas2007).
It is possible to infer that the shifting identity of East Durham brought about by the demise of coalmining has changed how residents identify with their local area. Greater usage of a supralocal feature like [aʊ] among younger speakers might reflect a broadening of their geographic horizons in terms of where they spend their time. Speakers from small localities may come into contact with speakers from larger urban areas if they commute for work or study (Britain, Reference Britain2011). Regular and repeated patterns of geographic movement between villages and larger cities diffuse linguistic features across the geographic span of the area through face-to-face contact with speakers of other varieties (Labov, Reference Labov, Britain and Cheshire2003:15), which might consequently lead to an increase in a less localizable feature.
In the East Durham data, there appears to be a trend toward younger speakers spending more time outside of their hometowns, which is reflected in their more supralocal mouth vowel pronunciation. Whereas only four of the 16 older speakers had worked outside of the four villages, with the remainder spending almost their entire careers in a pit-related job in East Durham, nine of the 16 younger speakers were working or studying in Hartlepool, Sunderland, or farther afield, representing a 125% increase across the two cohorts. Working outside of East Durham brings the younger speakers into daily contact with speakers of other varieties of regional Northeast English. Indeed, one younger Easington speaker remarked that colleagues at his workplace in Gateshead (a town between Newcastle-upon-Tyne and Sunderland [see Figure 2]) mocked linguistic features of his accent that were uncharacteristic of theirs. Although the specific feature of the mouth vowel appears to be leveling in East Durham, it seems language users are aware that other intraregional variation across the Northeast continues to exist:
“Everyone from Gateshead like can't believe how much I sound like a mackem [someone from Sunderland]…they'd definitely group Easington with Sunderland.” Easington speaker, aged 23
Younger East Durham speakers, starting work without large employers in their hometowns, do not appear to use local forms in the same ways as their elders. Johnstone (Reference Johnstone and Coupland2010) described how increased geographical mobility due to economic globalization (such as commuting) leads to greater awareness of local dialects and outsider perceptions of them (for example, colleagues from other areas comment on accent differences) that, in turn, can lead to speakers expanding their range of speech styles (either reinforcing local identity, leveling to a supralocal variety, or standardizing, according to audience or situation). Furthermore, highly localized features are most susceptible to change in the most geographically mobile speakers (Hazen & Hamilton, Reference Hazen and Hamilton2008:114). Whereas it seems that older speakers index their local identity by using highly local mouth pronunciations, particularly when talking about coalmining, this is not mirrored in the more geographically mobile younger speakers’ speech.
There is some evidence suggesting that the nearby Newcastle-upon-Tyne accent has recently become more overtly prestigious by gaining greater exposure in local and national media and popular culture (Beal, Reference Beal2004:37; Llamas, Reference Llamas2001:228–229). Varieties well represented in the media are more likely to influence the speech patterns of speakers of similar varieties more than those that are markedly different (Foulkes & Docherty, Reference Foulkes, Docherty, van de Velde and van Hout2001) so it may be that the [aʊ] form, leveling out local [u:] in Newcastle-upon-Tyne (Watt & Milroy, Reference Watt, Milroy, Foulkes and Docherty1999), becomes more attractive to younger East Durham speakers than their more local but less socially influential [ɛʊ] form.
The older speakers’ shift to [ɛʊ] when discussing mining suggests that topics with a highly local resonance entail a greater usage of a highly local variant, even when this variant is otherwise in decline. The shift occurs across all types of words within the conversational topic, and is not restricted to topic-specific mining words (as found in Gordon et al., Reference Gordon, Campbell, Hay, Maclagan, Sudbury and Trudgill2004). Furthermore, while all of the discussions of coalmining were situated in the past, there was no significant difference between past and present-day discussions of nonmining topics, challenging Hay and Foulkes's (Reference Hay and Foulkes2016) finding that tokens occurring in ‘remembered time’ are more likely to shift to an older variant. Given the link drawn by Johnstone (Reference Johnstone and Coupland2010) between old working-class variants and localness, both history and geography could be playing a role in the mining shift.
Younger speakers did not link accent to identity in the same way as the older participants. In the IdQ data, only the oldest participant in the younger cohort had any actual memory of their village having a colliery and only two of the sixteen younger speakers demonstrated awareness and understanding of mining terms, and neither professed to use these terms in their own speech. Although more of the cohort perceived mining to have affected the local language and culture, at least partially, they struggled to provide any examples and considered this influence to be historic. The following response was typical:
“My grandad was a miner but that's about all I know.” Horden speaker, aged 20
This lack of familiarity with the industry perhaps illustrates why the younger speakers predominantly use [aʊ] in the mining topic, in contrast to their elders who shift significantly toward [ɛʊ].
The topic of mining, with its special resonance locally, thus seems to contribute to the sound change. The shifting social context of life and work in East Durham reflected by the loss of the mining industry and a swing to working outside of one's hometown has occurred in tandem with the replacement of a declining local form by a nonlocal form: [aʊ]. Yet despite participating in a sound change, the recessive local [ɛʊ] form persists in topic-specific speech about traditional, locally relevant heritage topics, but only when the speakers involved are familiar with the topic by virtue of being old enough to remember it. As the factor that most significantly improved the model was age, with the shift to the local form in the mining topic made by older speakers but not younger speakers, this supports the view that exposure to the “pitmatic” variety explains the topic shift (Love & Walker, Reference Love and Walker2013) better than speaker identity (Mendoza-Denton et al., Reference Mendoza-Denton, Hay, Jannedy, Bod, Hay and Jannedy2003). Despite the significantly different distributions among speakers who orient to Sunderland or East Durham compared to Hartlepool or Newcastle evidencing the role of place identity among speakers, level of orientation to the mining industry was not shown to be significant neither in terms of having worked in the industry nor in terms of attitudinal data, where all older speakers considered mining to be important to their identity. The consequences of change in the social context of a speech community on the progression of sound change are clearly seen.
SUMMARY AND CONCLUSIONS
The East Durham data offer three main sets of findings. Geographically, speakers’ pronunciations are generally closer to [aʊ] the farther they are physically located from [ɛʊ]-producing Sunderland. This shift is fairly abrupt after northernmost Dawdon, which most closely mirrors the distribution reported in Sunderland, with more of a mixed lect between the Sunderland and Hartlepool varieties in the more southerly villages, Easington, Horden, and (among older speakers in) Blackhall. Furthermore, speakers who affiliate with the local areas of East Durham and Sunderland produce more local forms than those who orient toward places where [ɛʊ] is not typically found.
The age-correlated variation suggests change in progress in apparent time from [ɛʊ] to [aʊ]. The decline in usage of a highly local pronunciation in favor of an unmarked variant points to dialect leveling, in line with other Northeast English varieties. This sound change can be analyzed in light of increased opportunities for contact with speakers from a wider regional area caused by social change over time, with the loss of mining as a major local employer forcing the younger East Durham speakers to seek work and leisure prospects farther afield than previous generations. This experience is one that is presumably shared by speakers in many different industrial contexts over many geographical areas. By taking a microlinguistic perspective on the potential outcomes of the large-scale social change brought about by the demise of this industry in this region, this paper highlights the broader issue of the interdependence of social change and linguistic change.
Finally, this research adds to the literature on the effect of conversational topic on fine-grained phonetic style shifts. That the older speakers most frequently produce a highly local variant when discussing coalmining suggests that the locally resonant topic conditions a highly local pronunciation. Despite sharing the same geographical space, the younger speakers’ conception of local identity differs from their elders, and they do not participate in the same shift, predominantly using the unmarked, nonlocal [aʊ] form. Examining the role of conversational topic—and particularly the locally relevant topic of mining—provides further evidence of the connections between shifting social contexts and sound change. The findings specifically show that recessive local forms being replaced by less localizable variants can persist in speech focused on the vestiges of traditional, locally relevant heritage topics.