I. INTRODUCTION
A few years ago there was only scarce data on the AlInN alloy properties. Actually, the scientific work on this material system was intensified only since 2005. At that time, the well established material system for high power devices was AlGaN/GaN. These heterostructures exhibit typical 2D electron gas (2DEG) density confined at the heterointerface of the order of ~1.0 × 1013 cm−2. Especially, high electron mobility transistors (HEMTs) operating at GHz frequencies processed from these heterostructures already reached market maturity and are nowadays successfully commercialized with a special interest in communication technologies such as “worldwide interoperability for microwave access”.
However, it was found that lattice-matched (LM) AlInN/GaN heterostructures exhibit more than twice the amount of electrons confined at the heterointerface, i.e. in the order of 2.6 × 1013 cm−2 and hence there is a serious interest for the next generation of high power electronics. Unfortunately, these electrons forming the so-called 2DEG may suffer from poor in-plane transport properties due to alloy disorder scattering. Therefore, we used an approach already explored within the AlGaN/GaN system, namely the insertion of an AlN interlayer. This helps to keep the electrons better confined in the GaN channel and prevents 2DEG electrons from alloy scattering within the AlInN barrier. The variation of the interlayer thickness thereby results in a “high mobility window” with a maximum of 1200 cm2/V s at an interlayer thickness of ~1 nm at room temperature (RT) [Reference Gonschorek1]. HEMTs processed from these heterostructures exhibit saturation current densities up to 2 A/mm [Reference Medjdoub2] and operate at frequencies up to 100 GHz for heterostructures grown on Si(111) substrate [Reference Sun3]. Such devices typically exhibit maximum power densities up to 10 W/mm at 10 GHz [Reference Sarazin4].
Details on the growth of these films can be found in refs. [Reference Butte5, Reference Carlin6]. However, the growth of high-quality AlInN films is a difficult task due to the large difference between InN and AlN covalent bonds, which might lead to phase separation and strong composition inhomogeneities. In this framework, we discuss here only epilayers that exhibit a coherent growth on GaN templates, which was verified with reciprocal space maps recorded with X-ray diffraction [Reference Gonschorek7] in the composition regime 0.07 ≤ x ≤ 0.21.
Since a thorough description of electrical properties of such AlInN/AlN/GaN heterostructures is still lacking in the literature it is the scope of this article.
II. BIAXIALLY STRAINED Al1−xInxN on GaN
A) Critical thickness
The generation of misfit dislocations (MDs) is a well-known phenomenon in heteroepitaxy, in which a thin film is grown on a substrate with a significantly different lattice parameter. Below a certain film thickness, called the critical thickness t cr, a heteroepitaxial film may be grown pseudomorphically on a substrate, whereas a relaxation of misfit strain via plastic deformation occurs for thicker films t > t cr. In this sense, the most common mechanism of plastic relaxation is through the formation of MDs.
Several theoretical models for calculating the critical thickness in isotropic materials have been published over the years [Reference Fischer, Kuhne and Richter8–Reference People and Bean10]. Although they account reasonably well for the strain relaxation processes occurring in cubic systems such as SiGe/Si and InGaAs/GaAs, there has been only one report attempting to estimate the effect of hexagonal symmetry on the t cr values [Reference Holec11]. Nevertheless, the model of Fischer et al. [Reference Fischer, Kuhne and Richter8] provides a simple estimate for the critical thickness, namely t cr ~ b e/2ɛ ‖, with b e = 0.31825 nm the length of the Burgers vector and the layer in-plane biaxial strain component ɛ ‖ = (a − a 0)/a 0, with the strained lattice parameter a and its relaxed value a 0. Figure 1 shows t cr expected for the onset of plastic relaxation via the formation of MDs for the Al1−xInxN alloy grown on GaN with a = 0.31825 nm. The lattice matched condition is met at x = 0.175, where epilayers could potentially be grown infinitely thick. Experimentally, layer thicknesses of ~500 nm were achieved. In practice, t cr drops rapidly below 100 nm within a ±1% range beside the LM condition. In the limits of the binary compounds, i.e. AlN and InN grown on c-plane GaN, the estimate yields t cr ~ 6.5 nm for AlN/GaN, in very good agreement with experimentally results [Reference Cao and Jena12]. For InN/GaN, the experimental t cr is found to be ~1 monolayer (ML), i.e. t cr is slightly overestimated in Fig. 1. [Reference Yoshikawa13]. As indicated by the horizontal gray bar, the t cr is >15 nm in the composition regime 0.07 ≤ x ≤ 0.21.
Critical thickness t cr expected for the onset of plastic relaxation via the formation of MDs for the Al1−xInxN alloy grown on GaN with a = 0.3182 nm. The lattice matched condition is met at x = 0.175, where epilayers could potentially be grown infinitely thick. In practice, t cr drops rapidly below 100 nm within a ±1% range from the LM condition.

B) Spontaneous and piezoelectric polarizations
Understanding the polarization is crucial for accurately interpreting the optical and electrical properties in nitride heterostructures. The total polarization can be defined as the sum of the spontaneous polarization P sp(x) and the piezoelectric polarization P pz(x). The spontaneous polarization is an intrinsic property. In general, P pz(x) is described by a tensor but can be simplified for biaxially strained epilayers with growth in the [0001] direction as P pz(x) = 2ɛ ‖(e 31 − e 33C 13/C 33) with the piezoelectric constants e 31 and e 33, and the elastic constants C 13 and C 33. An extensive discussion can be found in ref. [Reference Ambacher and Cimalla14].
The polarization is basically a volume effect but since vicinal dipole sheets in the z-direction cancel out each other the polarization manifests itself at interface as the difference of the total polarization of neighboring layers. Thin pseudomorphic AlN layers grown on GaN exhibit therefore a higher total polarization charge density due to the significant contribution of the piezoelectric polarization. In the case of LM AlInN, this contribution vanishes completely and only the spontaneous polarization is present. Figure 2 displays the total polarization P sp(x) + P pz(x) for III-nitride epilayers pseudomorphically grown on GaN as a function of their composition. Material parameters are taken from ref. [Reference Ambacher and Cimalla14]. If the polarization charge density is positive, electrons are attracted forming a 2DEG, if there is a plane of negative charges a 2D hole gas (2DHG) should be formed. Typically, AlGaN/GaN HEMTs are grown with a barrier Al content of ~30% giving rise to a t cr of ~30 nm while holding a polarization charge density of 1.3 × 1013 cm−2. For higher Al content, barriers tend to relax via MDs. From Fig. 2(a) it is clearly visible that LM AlInN/GaN heterostructures provide a polarization charge density which is twice the amount of typical Al0.3Ga0.7N/GaN heterostructures, and additionally, they are strain free.
(a) Polarization charge density bound at the heterointerface of the ABN/GaN heterostructure grown on Ga-face GaN [14]. Positive sign indicates the presence of a 2DEG whereas for negative polarization charges a 2DHG is expected. (b) Band diagram for the balance equation model of an AlInN/AlN/GaN heterostructure. Note the signs of the polarization across both heterointerfaces, which have crucial importance.

III. ELECTROSTATICS OF AlInN/AlN/GaN HETEROSTRUCTURES: A BALANCE EQUATION MODEL
In the following, we are aiming to extract important parameters such as surface potential, polarization charges, and dielectric constant from our heterostructures. The ground state energy of the triangular quantum well located at the heterointerface is given by the variational solution as [Reference Jena15]

where ћ is the reduced Planck's constant, e the electron charge, n 2d the 2DEG sheet density, ɛ 0 the permittivity of the free space, ɛ b(x) the relative dielectric constant, and m* the electron effective mass. Now the balance equation can be set up going from the left to the right in the band diagram Fig. 2(b) respecting the AlN interlayer. In the following, we are referring to the concrete material, namely AlInN for the barrier, AlN for the interlayer, and GaN for the bulk. Then the balance equation can be written as

Note that in this case E C, AlN = e(σAlN/GaN − n 2d)/(ɛ0ɛAlN) is the field across the AlN interlayer and E C,AlInN = e(σAlInN/AlN (x) + σAlN/GaN − n 2d)/(ɛ0ɛAlInN(x)) the field across the AlInN barrier. The latter is thus determined by the total polarization charge across the AlN interlayer.
The difference between the Fermi level E F and the ground state energy E 0 is given under the assumption that only one subband is filled as

By setting n 2d = 0 in equation (2) allows determining the cases where the 2DEG is completely depleted, namely by a sufficiently thin barrier thickness t depl via the pinned surface potential often also referred to as the “critical thickness” (but this time to form the 2DEG):
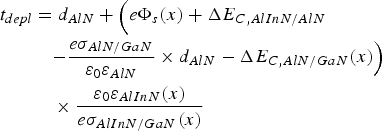
and for the depletion voltage, i.e. the potential added to the built-in surface potential to completely deplete the 2DEG:
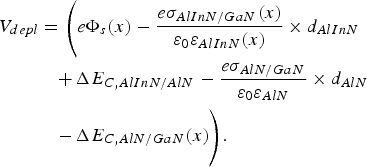
For a fixed interlayer thickness d AlN, the slope of the depletion voltage for a given AlInN composition versus AlInN barrier thickness gives directly σAlInN/GaN(x)/ɛ AlInN(x). The offset at d AlInN = 0 yields then

IV. 2DEG DENSITIES IN Al1−xInxN/(AlN)/GaN HETEROSTRUCTURES
Usually, 2DEG densities are measured using capacitance voltage technique. However, this requires the fabrication of Schottky diodes, which is a time consuming task for nitride heterostructures contrary to arsenides. A way to overcome this problem is the use of electrochemical CV (ECV), where the Schottky contact is formed by an electrolyte/semiconductor interface. A suitable electrolyte for nitrides is H3PO4. For a given reverse bias point, the capacitance can then be probed by applying a small AC voltage. The advantage of ECV is now that the frequency of the AC voltage is a few kHz whereas in conventional CV the frequency is in the MHz regime. The former is clearly an advantage since large frequencies together with additional diode resistances can distort seriously measured CV curves [Reference Blood16, Reference Schroder17].
If a voltage is applied to the electrolyte the current flow induces an oxidation of the AlInN surface with a thickness of ~1 nm. The capacitance for an oxide dielectric layer is given as

Assuming that AlInN is transformed into Al2O3 with ɛ ~ 12 then C is ~0.1 F/m2. The total measured capacitance is then simply the capacitance of two capacitors in series according to

where C is the true capacitance of the semiconductor heterostructure. In Fig. 3(a) the CV curves for Al0.85In0.15N/AlN/GaN heterostructures are reported. Black lines indicate the as measured curves whereas gray curves indicate the corrected curves assuming 1 nm oxide layer. Thus the thin oxide layer leads therefore to a slight underestimation of the true 2DEG density, as can be seen from Fig. 3(a). On the other hand, the depletion voltage is not significantly shifted. Since the capacitance is defined as C(V applied) = edQ/dV the 2DEG densities n 2d can simply be obtained by integrating the corrected CV curves. By adding a term V applied to the balance equation (2) and fixing all other parameters except n 2d, solving for n 2d(V applied) and taking the derivative of this expression one can also calculate the CV curves for a specific barrier thickness.
(a) Electrochemical CV of an Al0.85In0.15N/AlN/GaN heterostructure. The AlN interlayer thickness is 1.1 nm for all subfigures. During the measurement a ~1 nm thin layer at the AlInN surface is transformed into an oxide. Black curves are as measured and gray ones true CV considering the oxide. (b) Depletion voltages V depl as a function of AlInN thickness. Slope and offset are indicated. (c) 2DEG density as a function of the total barrier thickness d AlInN + d AlN : obtained by RT Hall measurement (R H) and integrated from the CV-curves in subfigure (a). The full line corresponds to equation (2) solved for n 2d(d AlInN) together with the set of parameters (9) and (10).

A) Extraction of electrostatic parameters for LM Al0.83In0.17N/AlN(1 nm)/GaN heterostructure
In Fig. 3(b) the depletion voltage versus AlInN barrier thickness is shown and gives, as can be expected from equation (5), a linear behavior. The slope dV depl/dd AlInN = σ AlInN/GaN(In = 0.15)/ɛ 0ɛ AlInN(In = 0.15) is ~6 × 10⁸ V/m, or expressed in terms of σ AlInN/GaN(In = 0.15)/ɛ AlInN(In = 0.15) ~ 0.332 × 10¹⁷ m−2. The offset at d AlInN = 0 is ~−1.05 V. However, as it can be seen from equation (6) this value is non-zero and determined by the other four non-vanishing expressions in equation (6). Figure 3(c) shows the integrated 2DEG densities from the uncorrected CV curves together with the Hall coefficients R H at RT. Not considering the oxide films in CV analysis leads therefore to an underestimate of the correct 2DEG density. Note that R H and CV results are in a very good agreement if the 1 nm oxide layer is considered.
We can now benefit from the information σ AlInN/GaN(In = 0.15)/ɛ 0ɛ AlInN(In = 0.15) = 6 × 10⁸ V/m and solve it for the unknown dielectric constant of the AlInN and plug the result back in equation (2). Now there are four unknown parameters namely the surface potential e Φ S(x), polarization charge across the AlInN/AlN interface σ AlInN/AlN(x), the dielectric constant of the alloy ɛ AlInN(x), and the critical thickness t cr. For the other parameters it is assumed

Then the unknown parameters can be extracted by fitting data in Fig. 3(c) with equation (2) solved for n 2d(d AlInN) yielding

With the parameters we deduced the model well reproduces the experimental data in the whole thickness range. Note that equation (2) has an analytic solution which is unfortunately rather complex.
Note that these parameters are in excellent agreement with experimental results from the so-called electron holography method [Reference Zhou18]. Indeed a voltage drop of ~2.5 eV across the LM 13 nm thick AlInN barrier was measured in good agreement with the electric field which can be calculated from the above parameters (10), which is discussed at the end of Section IV.C).
B) Variation of AlN interlayer thickness for LM Al0.83In0.17N(13 nm)/AlN/GaN heterostructure
Figure 4 displays the CV curves for an Al0.85In0.15N/AlN/GaN heterostructure with a fixed AlInN thickness of ~12.5 nm and various AlN interlayer thicknesses from 0.6 to 2.1 nm. The inset shows the depletion voltage for different interlayer thicknesses. The behavior is not linear as in Fig. 3(b) and predicted by equation (5). The local slope for the thicker interlayers 1.7–2.1 nm gives approximately the value expected for an AlN layer, namely dV depl/dd AlN = eσAlN/GaN/ɛ0ɛAlN is ~11 × 108 V/m, or expressed in terms of σAlN/GaN/ɛAlN ~ 0.609 × 10¹⁷ m−2. In addition for a vanishing interlayer d AlN = 0 one should make the transition from three-layer model equation (2) to the two-layer model by setting d AlN = 0. A fit of depletion voltages for simple AlInN/GaN heterostructures (not shown here) yields again a slope dV depl/dd AlInN = eσAlInN/GaN(In = 0.15)/ɛ 0ɛ AlInN(In = 0.15) is ~6 × 10⁸ V/m but with a slightly different offset of ~−0.85 V. Assuming a conduction band offset at the single Al0.85In0.15N/GaN heterojunction of ~0.5 eV then the surface potential eΦs is according to V depl|dAlInN=0 = eΦs − ΔE C(x) approximately 1.35 eV, i.e. is only half the value found in heterostructures with thicker interlayers. This implicit dependence of the surface potential and conduction band offset is not considered in equation (2).
CV curves for an Al0.85In0.15N/AlN/GaN heterostructure with a fixed AlInN thickness of ~12.5 nm and various AlN interlayer thicknesses. Inset shows the depletion voltage for the respective interlayer thicknesses. The behavior is not linear as in Fig. 3(b). This is caused by thickness dependence of the surface potential and possibly due to a change in the static dielectric constant for these ultrathin layers. Local slope for thicker interlayers gives approximately the value expected for an AlN layer.

C) Extraction of electrostatic parameters for non-LM Al1−xInxN/AlN/GaN heterostructures (0.07 ≤ x ≤ 0.21)
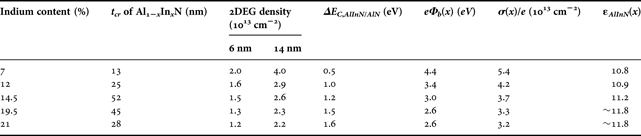
Now we apply this procedure to obtain the electrostatic parameters for heterostructures with indium composition in the range 0.07 ≤ x ≤ 0.21. In Fig. 5, the depletion voltages V depl for 6 and 14 nm thick barriers as a function of Al1−xInxN thickness for several compositions are shown. Black lines and gray lines indicate tensile and compressive regime, respectively. In Fig. 5(b) the 2DEG densities (integrated from CV curve) at RT for 6, 9, 14, and 33 nm thick Al1−xInxN barriers on GaN epilayers (black squares) are depicted. Blue lines correspond to a fit using equation (2). A full line turning into a dashed line indicates that the critical thickness t cr, beyond which pseudomorphic AlInN layers are expected to relax, is reached for the respective composition. Especially, the 14 nm barriers in the compressive regime exhibit similar 2DEG densities as the LM heterostructures causing similar depletion voltages. The electrostatic parameters are summarized in Table 1.
(a) Depletion voltages V depl for 6 and 14 nm thick barriers as a function of the Al1−xInxN thickness for several compositions. Black and gray lines stand for the tensile and compressive regime, respectively. (b) 2DEG density (integrated from CV curve) at RT for 6, 9, 14, and 33 nm thick Al1−xInxN barriers on GaN epilayers (black squares). Blue lines correspond to fits using equation (2). A full line turning into a dashed line indicates that the critical thickness t cr, beyond which pseudomorphic AlInN layers are expected to relax, is reached for the respective composition.

Critical thickness t cr for plastic relaxation, 2DEG densities deduced from C–V measurements for 6 and 14 nm thick barriers, band offset at the AlInN/AlN interface, surface potential, and bound interface sheet density for five different compositions in the nearly LM regime between 7 and 21%.

Since band offset in nitride heterostructures can only be hardly measured we make the following assumption for the AlInN/AlN interface: it has been demonstrated that the valence band offset of coherently strained InN(2 nm)/AlN (0001) is ΔE V,InN/AlN ~ 3.1 eV [Reference Wu, Shen and Gwo19]. Furthermore, it has been shown that the valence band offset of Al1−xInxN/GaN heterostructures scales linearly between the binary compositions [Reference King20]. Therefore, the band offset is estimated as ΔE C,AlInN/AlN = E g,AlN − E g,AlInN(x) − xΔE V,InN/AlN, where the bandgap dependence of the AlInN alloy is taken from ref. [Reference Iliopoulos21]. Note that even in the case that the band offset of Al0.0In1.0N/AlN(1 nm)/GaN behaves more as the band alignment of an InN/GaN heterostructure [Reference King22], i.e. negligible influence of the 1 nm AlN interlayer, the error in the low indium regime of the alloy on the band offset is minor since ΔE V,AlN/GaN + ΔE V,InN/GaN ~ 1.5 eV.
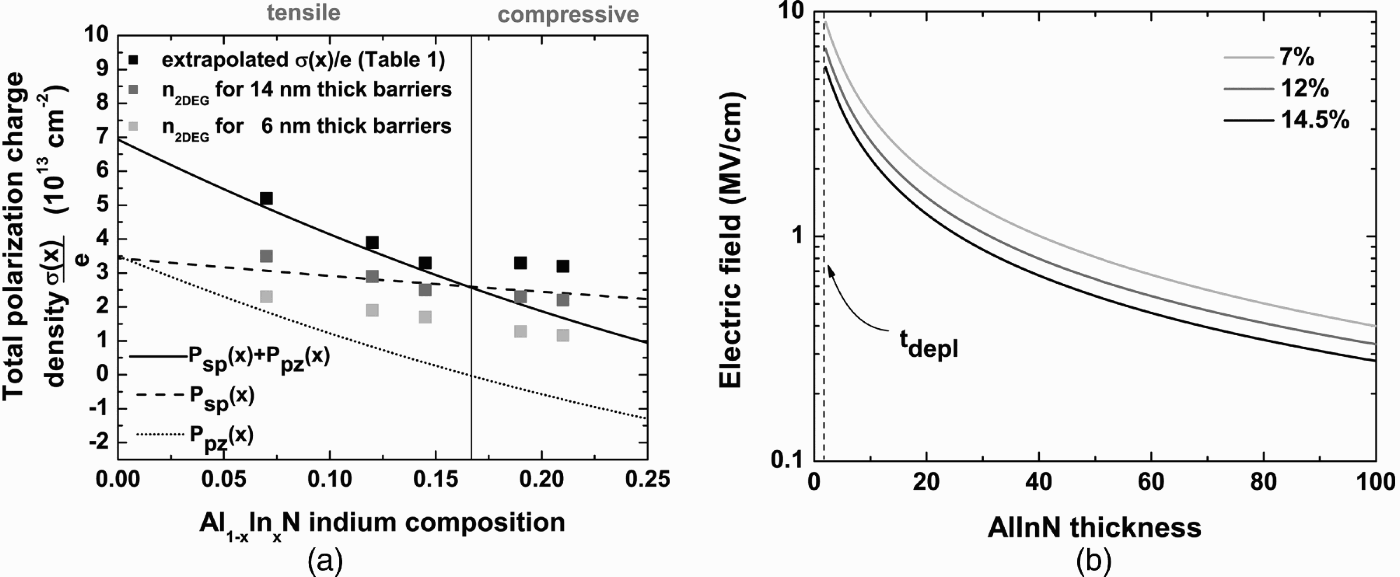
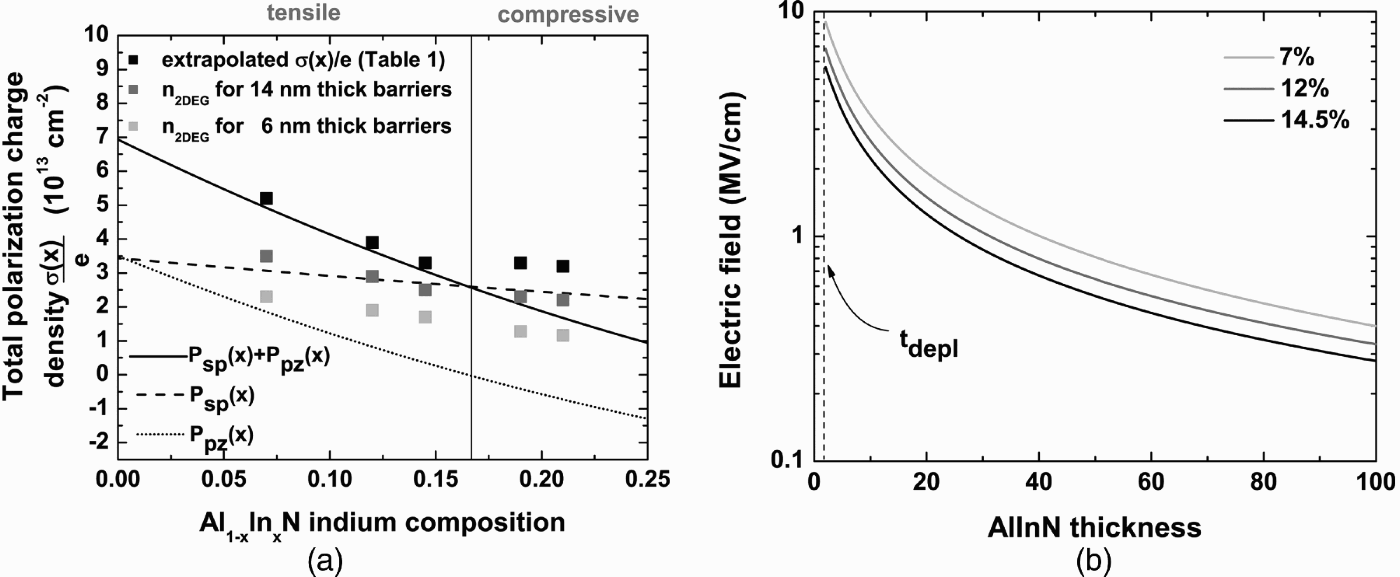
Figure 6(a) shows the 2DEG densities versus indium composition for 6 and 14 nm thick AlInN barriers and the extrapolated total bound sheet density σ(x)/e obtained using equation (2). Additionally, the spontaneous P sp(x) and the piezoelectric P pz(x) polarizations and their sum is shown based on the calculations of the macroscopic polarization for the AlInN random alloy as given by Bernardini and Fiorentini [Reference Bernardini and Fiorentini23]. Indeed, these authors pointed out a strong nonlinear behavior for P sp(x) and P pz(x) depending on the atomic structure. Calculations were performed for a random alloy, i.e. a random distribution of group-III elements on the wurtzite cation sites, whereas anion sites are occupied by nitrogen leading to a P sp bowing parameter b random ~ −0.065 C/m2 (black lines in Fig. 6(a)). For the tensile strain regime, extrapolated σ(x)/e values agree fairly well with the trend expected for pseudomorphic layers, i.e. a contribution from P pz(x) is present. In the compressive regime (samples 19.5 and 21%), the σ(x)/e values are much higher than expected for a pseudomorphic random alloy. Even the 2DEG densities for the 14 nm thick AlInN barriers exceed the polarization limit given by the black full line. This behavior might be caused by the following mechanism: it has been demonstrated that compressive AlInN relaxes favorably by building up a composition gradient by ending up with LM AlInN at the layer surface while keeping always the same in-plane lattice parameter [Reference Lorenz24]. Consequently, the compositional gradient in the AlInN causes a 3D “background” polarization with a positive sign throughout the barrier as demonstrated for graded AlGaN [Reference Jena15]. This “background” polarization can significantly increase the total polarization and consequently the amount of attracted electrons is increased.
(a) Lines correspond to spontaneous (—) and piezoelectric (…) polarization charges and the sum of both (——) at RT for an AlInN random alloy. 2DEG densities for 6 nm thick (gray squares), 14 nm thick (dark gray squares) AlInN barriers, and the extrapolated total bound. (b) Electric field across the AlInN barrier for 7, 12, and 14.5% indium calculated from equation (2) using the parameters from Table 1.
From the last column in Table 1, namely the extracted dielectric constant of the AlInN alloy the behavior seems to be non-linear. This is consistent with the findings for bowing parameters of longitudinal optical phonon frequencies [Reference Darakchieva25] and of refractive indices [Reference Jiang, Shen and Guo26].
If the dependence of the 2DEG density on barrier thickness and polarization charge is known for a specific composition, the electric field across the AlInN barrier as a function of the barrier thickness can easily be calculated using the relation E C,AlInN = e(σAlInN/AlN(x) + σAlN/GaN − n 2d(d AlInN))/(ɛ0ɛAlInN(x)), where n 2d(d AlInN) is obtained from equation (2) and the parameters from Table 1 for the respective composition. The resulting field dependence is displayed in Fig. 6(b). Especially the optical properties depend sensitively on this electric field. Note that only for thicknesses below t depl, i.e. for fully depleted 2DEG, the field is given exactly by eσAlInN/GaN(x)/ɛ 0ɛ AlInN(x).
V. CONCLUSIONS
A detailed charge balance equation was set up for Al1−xInxN/AlN/GaN heterostructures in order to extract important physical parameters around LM AlInN condition, i.e. 0.07 ≤ x ≤ 0.21. These parameters can be extracted using the 2DEG density and the depletion voltage obtained from CV measurements for different barrier thicknesses. For nearly LM Al0.85In0.15N these parameters amounts to σAl0.85In0.15N/GaN ~ 3.7 × 10¹⁷ m−2 for the polarization charge, eΦS ~ 3 eV for the surface potential and ɛAl0.85In0.15N ~ 11.2 for the static dielectric constant. The voltage drop across the barrier for 13 nm thick Al0.85In0.15N amounts to ~2.5 eV which is in excellent agreement with the experimental value obtained from the electron holography method [Reference Zhou18]. Especially the Al1−xInxN static dielectric constant indicates a non-linear behavior between binaries with a bowing parameter b of ~2–3 at x = 0.15.
ACKNOWLEDGEMENTS
This work was carried out under the UltraGaN European Project and was supported by the Swiss National Science Foundation (Contract No. 200021-107642/1).
 Marcus Gonschorek was born in Germany, in 1979. He received an M.S. degree in physics from the University of Leipzig, Germany, in 2005. His diploma work concerned arsenide-based quantum dot systems for non-volatile memory applications. He received his Ph.D. degree in physics from the Ecole polytechnique fédérale de Lausanne (EPFL), Switzerland, in 2009. The work concerned AlInN/AlN/GaN heterostructure and their application for high power electronic devices. His main research interests are fundamental properties of III–V semiconductor hetero- and quantum structures, carrier transport, and optoelectronic properties.
 Jean-Francois Carlin was born in Nice, France, in 1962. He was graduated from the Ecole Centrale de Lyon in 1986 and made his doctoral research on the growth of GaInAsP compounds by chemical beam epitaxy at the Institute of Micro and Optoelectronics of the EPF-Lausanne, where he obtained the doctoral degree in 1993. He has been working on the growth and characterization of long wavelength vertical cavity lasers, microcavity light emitting diodes, and dual-wavelength coupled-cavity surface-emitting laser. He joined the field of III-nitride semiconductors in 2002, where he developed AlInN materials for optoelectronics and electronics. He is presently leading research effort on the growth of these wide bandgap nitride semiconductors in LASPE laboratory, at EPF-Lausanne.
 Eric Feltin obtained his Ph.D. in physics from the University of Nice-Sophia Antipolis in 2003. His doctoral research at CNRS-CRHEA allowed new development in the growth of GaN on silicon substrates by MOVPE for the realization of light emitting diodes. He developed a new method for producing high-quality free-standing GaN substrates still used in the industry. He joined the Laboratory of Advanced Semiconductors for Photonics and Electronics at EPFL in 2004 where he worked on growth and technology of wide-bandgap semiconductors (GaN and its alloys) with particular emphasis on microcavities, VCSELs, and high electron mobility transistors. In 2009 he founded NOVAGAN, a company manufacturing III-nitride epitaxial wafers designed for UV-blue laser diodes and high frequency/power electronics. He is the author or coauthor of more than 80 publications in peer-reviewed international journals and holds one patent.
 Marcel Py was born in Switzerland in 1950. He received the Ph.D. degree in physics at EPFL for an infrared and Raman study of the lattice vibrations in the MoO3 layered compound. From 1980 to 1984, he was a post-doctoral fellow/research associate at the University of British Columbia, Vancouver, Canada, working on lithium intercalated layered compounds for high-energy storage. Since 1984, he is a scientific collaborator in the Institute of Quantum Electronics and Photonics at EPFL. He first worked on the MBE growth by solid sources of III-arsenide compounds and 2D electron gas heterostructures for HEMT applications. He then focused on the electrical characterization of such systems, by Hall effect for their transport properties, by deep level transient spectroscopy and low frequency noise (LFN) measurements.
 Nicolas Grandjean was born in France and received his Ph.D. degree in physics from the University of Nice-Sophia Antipolis, in 1994. He was working during his Ph.D. thesis on III–V semiconductor based heterostructures. From 1994 to 2003, he was a member of the permanent staff at CNRS-France. His research activities were focused on the physical properties of nitride-based nanostructures, as well as on the realization of short-wavelength light emitters and UV detectors. In 2004, he has been appointed “Tenure-Track” Assistant Professor at Ecole Polytechnique Fédérale de Lausanne (EPFL)-Switzerland in the Institute of Quantum Photonics and Electronics. He was promoted full professor in 2009. He has been awarded the Sandoz Family Foundation grant for Academic Promotion. He is author or co-author of more than 300 publications in peer-reviewed international journals, five book chapters and holds four patents. His current research activities are centered on the growth, physics, and technology of wide-bandgap semiconductors (GaN and its alloys), and in particular on microcavities, quantum dots, intersubband transitions, and 2D electron gas heterostructures.