
I. INTRODUCTION
Machining is a metal removal process in which excess material is removed in the form of chips to obtain a product. Large plastic strains in the range of 1–20 and strain rates of about 106/s make machining a severe plastic deformation (SPD) process producing nanocrystalline and ultra-fine-grained (UFG) chips or shavings. Reference Swaminathan, Shankar, Lee, Hwang, King, Kezar, Rao, Brown, Chandrasekar, Compton and Trumble1 Typically, the microstructure of the machined chips is composed of flow lines which are characteristic of the large strain deformation. Reference Swaminathan, Shankar, Lee, Hwang, King, Kezar, Rao, Brown, Chandrasekar, Compton and Trumble1 These polycrystalline shavings are homogenous and possess either an equiaxed or elongated microstructure depending upon the plastic strain imposed on the bulk material. However, the chip formed during machining is typically of little interest due to the lack of geometric control in unconstrained cutting. Large strain extrusion-machining (LSEM) is a SPD process that employs a suitable constraint at the location of chip formation so that the machining and extrusion occur together to control the chip geometry. The ensuing deformation prevailing in the narrow shear zone facilitates the production of chips in the form of foils possessing a nanocrystalline or an ultra-fine-grained microstructure. Reference Brown, Swaminathan, Chandrasekar, Compton, King and Trumble2 Nanocrystalline (grain size <100 nm) and UFG (grain size between 100 and 1000 nm) materials possess superior mechanical properties vis-à-vis their conventional counterparts. Reference Farrokh and Khan3 The resulting enhancement could be observed in the following properties: hardness, strength, ductility, fracture toughness, fatigue life, and wear resistance. Reference Valiev4
The present effort focuses on the SPD of one of the widely used alloys of Titanium, Ti–6Al–4V, which contains both α and β phases at room temperature. α transforms to β above the transus-temperature of 995 °C. Reference Lütjering and Williams5 Ti–6Al–4V has widespread applications due to its appealing mechanical properties, such as high specific strength, high fracture resistance, and exceptional corrosion resistance. Ko et al. Reference Ko, Jung, Shin and Lee6 observed fine grained (0.2–0.3 µm) and equiaxed α grains during the equal channel angular pressing/extrusion (ECAP/E) of Ti–6Al–4V at 600 °C (to achieve thermal softening) over a total of 4 passes. Wang and Langdon Reference Wang and Langdon7 used high pressure torsion to produce a nanocrystalline microstructure (grain size of 70 nm) in Ti–6Al–4V with a 32% improvement in hardness. However, production of the Ti–6Al–4V alloy in bulk forms such as foils and sheets is quite expensive and challenging due to their poor formability. LSEM has the potential to be a low-cost alternative for the production of microscale foils from Ti–6Al–4V that could be utilized in the fabrication of micro/mesoscale components, repair of skull defects, Reference Blair, Fannin and Gordon8 micro-electro-mechanical system, Reference Saldana, Yang, Mann, Moscoso, Gill, Chandrasekar and Trumble9 and composites with high strength reinforcements.
A difficulty encountered during machining and also LSEM of Ti–6Al–4V is the formation of shear localized chips at all cutting speeds due to poor thermo-mechanical properties, Reference Zhen-Bin and Komanduri10 including thermal conductivity, specific heat, elastic modulus, and chemical reactivity with tool materials. According to Recht, Reference Recht11 shear localization occurs when the rate of decrease in strength due to thermal softening exceeds the rate of increase in strength due to strain hardening. There are two mechanisms that explain the formation of shear localized chips during the machining of Ti–6Al–4V: (i) adiabatic-shear-band-formation and (ii) periodic crack initiation and propagation within the primary shear zone. Komanduri Reference Komanduri12 suggested that the adiabatic shear bands form across the chips of Ti–6Al–4V in two stages. The first stage involves the upsetting of the work material ahead of the tool, forming a chip segment with negligible deformation. It is followed by the formation of adiabatic shear bands within the shear zone that originates from the tool tip until it meets a free surface. Alternately, Vyas and Shaw Reference Vyas and Shaw13 adopted the cyclic cracking theory from Nakayama’s Reference Nakayama14 effort, which reports machining experiments on cold-worked brass at very low cutting speeds. The crack initiation occurs from the free surface and proceeds down the shear plane until it meets the tool tip, where the crack arresting normal stress prevails.
Roy et al. Reference Roy, Suwas, Tamiriskandala, Srinivasan and Miracle15 observed that the occurrence of shear localization at a critical strain is a strong function of the initial texture. The crystallographic textures in Ti–6Al–4V generally depend on the mode and the temperature of deformation. Reference Lütjering and Williams5 Peters et al. Reference Peters, Gysler and Lütjering16 have established three different types of crystallographic textures during the hot rolling of Ti–6Al–4V at different temperatures. The basal (B) texture with the (0002) poles parallel to the normal direction (ND) resulted from cross rolling at 800 °C. The unidirectional rolling led to a basal-transverse (B/T) texture when deformed at 800 °C and a transverse (T) texture at 960 °C.
Studies on Ti–6Al–4V have focused so far either on its SPD or texture evolution with its impact on mechanical properties, such as tensile behavior, fatigue strength, and fatigue crack propagation. Reference Peters, Gysler and Lütjering16–Reference Mehdi, Azzeddine, Badji, Ji, Alili and Bradai18 However, the influence of preferred texture on extrusion-machining has not been reported. This article investigates the modification of the crystallographic texture prior to unconstrained cutting for controlling the shear localization in extrusion-machining. Furthermore, the restricted-contact cutting tool has been used to reduce the hindrance to chip flow due to friction. The present work, therefore, attempts to create fine-grained foils from suitably textured Ti–6Al–4V by large strain extrusion-machining using a restricted-contact cutting tool.
II. PRELIMINARY MACHINING TESTS
Before considering LSEM, efforts were made to suppress shear localization in machining without constraints, the details of which are discussed in this section. Based on the work reported by Sun et al., Reference Sun, Brandt and Dargusch19 turning tests were conducted on solution-treated bars of Ti–6Al–4V at a cutting speed of 16 m/min, feed of 0.285 mm/rev, and a depth of cut of 1.5 mm. However, these tests yielded serrated chips showing intense shear localization rather than chips possessing a mixture of continuous and segmented features as reported by Sun et al. Reference Sun, Brandt and Dargusch19 for the same cutting parameters. Their optical micrographs showed the presence of shear bands due to the heavy cold work in the Ti–6Al–4V workpieces prior to turning. Therefore, the heavy cold work imparted to the workpiece must have resulted in a favorable orientation for suppressing shear bands, thereby leading to the chip reported by Sun et al., Reference Sun, Brandt and Dargusch19 which is not explicitly mentioned in their work. Consequently, it was decided to impart cold work on the material to obtain a desirable crystallographic orientation before using it for machining. This can be achieved by cold-rolling, which is easy to do on flat plates than on cylindrical bars. Accordingly, in the current effort, Ti–6Al–4V plates were used due to the ease of control afforded in obtaining a suitable crystallographic texture from the rolling operation. The next section elucidates on the cold-rolling of Ti–6Al–4V plates for obtaining textured specimens that were used subsequently for LSEM. LSEM was used instead of machining without constraints since the chip thickness could be controlled prior to the process.
III. EXPERIMENTAL PROCEDURE FOR LSEM
The primary effort of the current work was to generate continuous fine-grained foils from Ti–6Al–4V, while suppressing the shear localization occurring during the unconstrained cutting portion of LSEM. This was achieved by imparting an apt texture to the LSEM feed material through cold-rolling. This section details the experimental procedure for cold-rolling, design of an LSEM fixture, and subsequent extrusion-machining of the textured workpiece to obtain a continuous fine-grained foil.
A. Rolling of Ti–6Al–4V plates
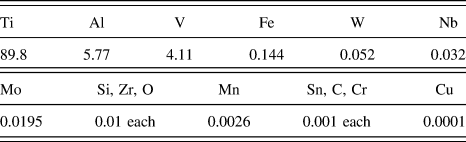
The chemical composition of Ti–6Al–4V plates used in the present study was measured using an optical emission spectrometer (Table I). All the specimens were cut from a single plate and subsequently cold rolled to different thickness reductions. Some of the samples were cold rolled in the as-received condition, while the others were annealed before cold-rolling. Rectangular plates measuring 50 × 40 × 6.5 mm were annealed under Argon atmosphere at 925 °C for 4 h. Subsequently, it was furnace cooled to 760 °C at a cooling rate of 50 °C/h and later air cooled to room temperature. 20 These plates were cold rolled in a four-roll mill with a roll diameter of 100 mm each, at a rolling depth of 0.1 mm per pass. The annealed plates were cold rolled to 30, 40, and 45% thickness reductions to study their effect on shear localization in machined chips. The final thickness of the 30 and 40% cold-rolled plates was about 3 mm, and the thickness of the 45% cold-rolled plate was about 2.6 mm. The as-received plates were also cold rolled to a thickness of about 3.4 mm, resulting in a thickness reduction of 47%. Edge cracks started to appear on the plates when the cold working was beyond 47 and 45% for the as-received and annealed plates, respectively.
Ti–6Al–4V alloy chemical composition (wt% of different elements) for the as-received sample.

B. Large strain extrusion-machining
LSEM is a single-step plane-strain deformation process that combines large plastic strains of machining with the dimensional control of the chip due to extrusion. A schematic sketch of LSEM process can be found in Guo et al. Reference Guo, Saldana, Compton and Chandrasekar21 A wedge-shaped cutting tool is fed orthogonally against a stationary workpiece at a cutting velocity (V o) that removes the preset depth (t o) and the width (b) of the material in the form of a chip or shaving due to the simple shear in the narrow primary shear zone. Moreover, the primary shear zone is idealized as a shear plane, where a significant amount of plastic deformation is imparted to the workpiece for creating a chip. A very low cutting speed is preferred to limit heat dissipated during plastic deformation, which can lead to recrystallization in the chip material. The chip is simultaneously forced to flow through the gap between the constraining edge and the rake surface of the cutting tool, thereby affecting the chip geometry to form a foil. In contrast to unconstrained cutting, LSEM facilitates in controlling the chip geometry prior to the initiation of cutting at the location of the primary shear zone. As a result, complete control of the deformation parameters such as strain, strain rate, and the temperature is possible by this combination of extrusion and machining processes. The shear localization encountered during unconstrained cutting of certain metals, e.g., Mg AZ31B—a magnesium alloy, can also be suppressed due to the action of hydrostatic pressure, thereby enhancing the workability of the material. Such hydrostatic pressure conditions exist in the deformation zone of a typical LSEM process. An instance of this is seen in the article by Efe et al. Reference Efe, Moscoso, Trumble, Compton and Chandrasekar22 that used a chip compression ratio (λ = t c/t o) of 0.7 to suppress the shear bands formed at the shear plane by a suitable constraint. An LSEM process employing a higher chip compression ratio is desirable because it involves lesser dissipation of energy in the form of heat during deformation.
The total shear strain (γ), coming from machining and extrusion, imposed to get the chip/foil is determined by the chip compression ratio and rake angle (α), as given by Reference Brown, Saldana, Murthy, Mann, Guo, Allard, King, Compton, Trumble and Chandrasekar23,Reference Moscoso, Shankar, Mann, Compton and Chandrasekar24
 $$\gamma = {\lambda \over {\cos \alpha }} + {1 \over {\lambda \cos \alpha }} - 2\tan \alpha \quad .$$
For a given α, γ has the minimum value at λ = 1. The chip thickness from the unconstrained cutting has a significant bearing on the selection of a suitable chip compression ratio set during extrusion-machining. Reference Efe, Moscoso, Trumble, Compton and Chandrasekar22 The large strain extrusion-machining process is capable of imposing a wide range of strains (1–10) in the foil by just varying the rake angle, α, and the compression ratio, λ. Reference Saldana, Yang, Mann, Moscoso, Gill, Chandrasekar and Trumble9 Moreover, nanocrystalline and UFG materials can be produced for high-strength alloys during the large strain extrusion-machining process since the strain rate can be effectively controlled as it is a function of the cutting velocity.
C. Extrusion-machining fixture
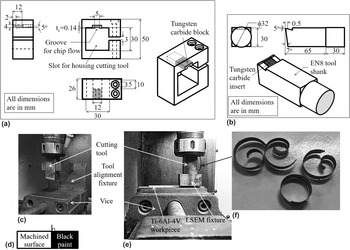
The LSEM process was carried out by retrofitting an unconstrained cutting tool with a suitable fixture that provides a constraint for extrusion. As illustrated in Fig. 1(a), the fixture was made from an EN8 block with a slot having dimensions of 30 × 30 × 26 mm cut using electrical discharge machining. The slot in the fixture was provided to support the cutting tool which is also rigidly held by means of Allen screws to avoid relative motion during extrusion-machining. A tungsten carbide (WC–Co) block of dimensions 12 × 12 × 4 mm was brazed to the EN8 block as shown in Fig. 1(a). The tungsten carbide material has a higher hardness than EN8 as well as the chip formed during machining and hence prevents damage to the surface of the block while it is in contact with the chip. In this block, a wedge-shaped groove of dimensions 5 × 12 × 0.14 mm with a land length of 2 mm was cut using EDM. The chip flows through this groove leading to constrained/extrusion-machining. In the current study, the chip compression ratio has been chosen to be a higher value of 1.4 to reduce energy dissipation and hence limit the thermal effect on the microstructure of the resulting foil, while improving energy efficiency. Consequently, the groove depth has been chosen to be 0.14 mm commensurate with a chip compression ratio of 1.4 on a depth cut of 0.1 mm.
(a) Fixture for implementing large strain extrusion-machining, (b) schematic of the single-edge restricted-contact cutting tool. (c) HAAS milling machine setup with tool alignment fixture. (d) Verification of tool alignment using a quick stop method with the painted unmachined surface. (e) The HAAS milling machine setup with LSEM fixture and the Ti–6Al–4V workpiece. (f) Raw extruded foils from extrusion-machining process.

D. Extrusion-machining process
The as-received, annealed, and cold-rolled Ti–6Al–4V plates were subjected to LSEM at a cutting speed of 0.8 m/min to produce foils. The linear cutting tests were performed on a 5.6 kW HAAS CNC mini mill by restricting the rotary motion of the cutting tool. The schematic of the restricted-contact single-edge cutting tool is depicted in Fig. 1(b). The circular shank of the cutting tool was adapted into the spindle of the CNC milling machine using a collet. The single-edge cutting tool is made of the EN8 material to which an uncoated tungsten carbide (WC–Co) insert was brazed. In machining, typically there is a large friction between the tool rake face and the back surface of the chip. To reduce this friction and the consequent dissipation of energy, a restricted-contact length of 0.5 mm was provided in the tungsten carbide insert of the tool during extrusion-machining. A rake angle of 5° and a clearance angle of 7° were provided to the cutting tool.
A tool alignment fixture was used to align the edge of the cutting tool perpendicular to the cutting velocity, thereby ensuring orthogonal cutting conditions. The tool alignment fixture was held using a vice, and the square shank of the cutting tool is inserted into the slot provided in the fixture as shown in Fig. 1(c). The alignment of the cutting edge was verified by smearing a paint of black color on the uncut workpiece surface prior to machining. The machining process was abruptly stopped, and the image of the workpiece [Fig. 1(d)] was taken. The angle between the workpiece edge and the demarcation between the painted and unpainted regions were measured using GIMP (image analysis software) and were found to be 89.5° ± 0.6°, which confirms the orthogonality required in this process.
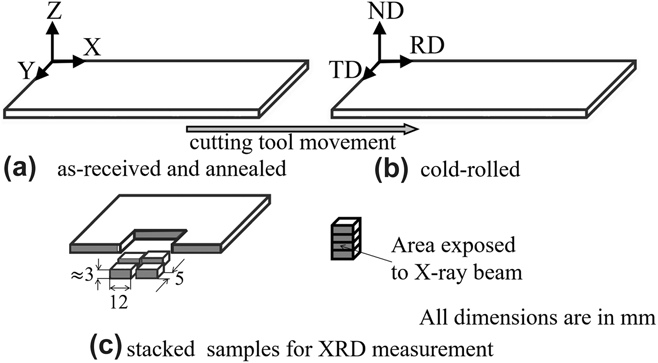
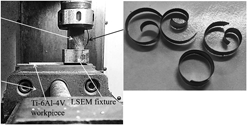
Figures 2(a) and 2(b) show the reference frame for the as-received, annealed, and cold-rolled plates. The dimensions of the as-received and annealed plates were 100 × 40 × 3 mm. Extrusion-machining was performed in the X–Z plane with the cutting velocity of the tool directed along the X direction on the as-received and annealed plates without cold-rolling. For cold-rolled plates, cutting tests were performed in the [normal direction–rolling direction (ND–RD)] plane with the cutting velocity of the tool directed along the rolling direction. The depth of cut has been chosen to be 100 µm for achieving a state of plane strain, which requires the depth of the cut to be less than or equal to 1/10th of the width of the workpiece. Reference Swaminathan, Shankar, Lee, Hwang, King, Kezar, Rao, Brown, Chandrasekar, Compton and Trumble1 The chip coming from the unconstrained cutting is extruded through the groove provided in the fixture for generating the fine-grained foil during the extrusion-machining process as shown in Fig. 1(e). Some of the raw extruded foils obtained from the extrusion-machining process are shown in Fig. 1(f). The cutting conditions were maintained the same for all cases. There were 6 different feed materials: as-received without cold-rolling, as-received with 47% cold-rolling, annealed without cold-rolling, annealed with 30, 40, and 45% cold-rolling. For each of these feed materials, the LSEM experiments were repeated five times. The foils were subjected to microstructural characterization and hardness measurement tests. The strain imposed on the foils was estimated as 1.9 for a chip thickness of 140 µm using Eq. (1).
(a, b) Schematic showing the sample reference frame and direction of the cutting tool movement (rolling direction, normal direction, transverse direction), and (c) Samples cut from Ti–6Al–4V plates and stacked for the XRD measurement.

IV. MATERIAL CHARACTERIZATION
The bulk material was characterized using X-ray diffraction and the pole figure measurements to investigate the evolution of the texture with coldrolling. Bulk, as well as machined chip samples, were polished, and the microstructure was studied under an optical microscope to study the effect of extrusion-machining on samples with different initial conditions. The polished samples were also used to measure the hardness. The chip samples were characterized for the grain size using transmission electron microscopy (TEM) to ascertain that they are fine grained. The experimental procedure for these material characterization tests is detailed below.
A. X-ray diffraction
The X-ray diffraction patterns were obtained using a ‘BRUKER D8’ X-ray diffractometer (Bruker Corperation, Billerica, Masachusetts) using the Cu Kα radiation. The X-ray beam from the diffractometer is emitted through a slit of area 15 × 20 mm. Since it is incident on a small sample area of about 3 × 12 mm in the X–Z/ND–RD plane (area subject to machining), only a few diffracted beams can reach the detector. Therefore, four samples, each measuring nearly 3 × 12 × 5 mm, were cut from the Ti–6Al–4V plates followed by stacking to increase the sample surface area as shown in Fig. 2(c). Samples were stacked such that the X-ray beam is incident on the X–Z plane in the as-received and the annealed plates without cold-rolling and ND–RD plane for the plates subjected to cold-rolling.
B. Pole figure measurement
The measurement of pole figures was carried out using a X’Pert Pro PANalytical X-ray diffractometer (PANalytical, Almelo, the Netherlands) with the Cu Kα radiation in the Schulz reflection geometry. The scan measurement direction was defined by the rotation angle φ (0° to 360°) about an axis normal to the sample and this was repeated for different sample tilt angles ψ (0° to 85°). Both φ and ψ were measured with a step size of 5°. Stacking of the samples was not necessary since the X-ray beam was focused on a small 2 mm2 area of the sample. The pole figure measurement is limited to the α phase because at room temperature, the majority of the plastic strain is accommodated by this phase with the texture evolution being unaffected by the β phase.
Reference Prakash, Ding, Moat, Jones, Withers, da Fonseca and Preuss25
A set of four incomplete pole figures
 $\left\{ {10\bar{1}0} \right\}$
, (0002),
 $\left\{ {10\bar{1}1} \right\}$
, and
 $\left\{ {10\bar{1}2} \right\}$
were experimentally determined and were used to calculate the orientation distribution function (ODF) using MATLAB toolbox MTEX software (MathWorks, Natick, Massachusetts).
Reference Bachmann, Hielscher and Schaeben26
Subsequently, pole figures were recalculated from the estimated ODF, and the background and defocussing corrections for these figures were performed using pure titanium powder with a random texture.
C. Optical microscopy and hardness tests
Bulk and machined chip samples were mounted in epoxy and polished successively using silicon carbide (SiC)-impregnated emery papers of different grit sizes. Copious amounts of water were used during the process to remove the heat and debris. Fine polishing was done using alumina powder with a grit size of 1500 followed by 0.08 µm colloidal silica, both suspended in water. The microstructure from the as-received and annealed bulk specimens was studied using optical microscopy in the X–Z plane for specimens without cold-rolling and in the ND–RD plane for the rolled specimens at different thickness reductions (47% for as-received and 30%, 40%, and 45% for annealed). The foil morphology was observed in the longitudinal cross sections of the foil obtained from extrusion-machining. For every feed material, three foils were randomly chosen from each of the five specimens for microstructural characterization. These foils indicated a similar morphology, thus indicating repeatability and confidence in the present method of generating foils with a refined microstructure. The typical microstructure seen in the three specimens for each feed material has been depicted later in this work. Hardness measurements were carried out on all the polished samples using the Vickers indentation technique with twenty indentations on each sample.
D. Transmission electron microscopy
Disks of 3 mm diameter were punched out from the foils and then thinned to about 70 µm thickness using silicon carbide (SiC)-impregnated emery papers. The disks were thinned to below 100 µm thickness to reduce the curvature of the foils obtained from LSEM to facilitate electrolytic polishing. The disk specimens were made electron transparent by electrolytic twin-jet polishing on a Struers Tenupol polishing system using a solution of 94% methanol and 6% sulfuric acid at 20 V. The electron transparent specimen was then studied using a ‘TECNAI T20 TEM’ instrument operating at 200 kV (FEI Company, Hillsboro, Oregon).
V. RESULTS AND DISCUSSION
A. X-ray diffraction of Ti–6Al–4V
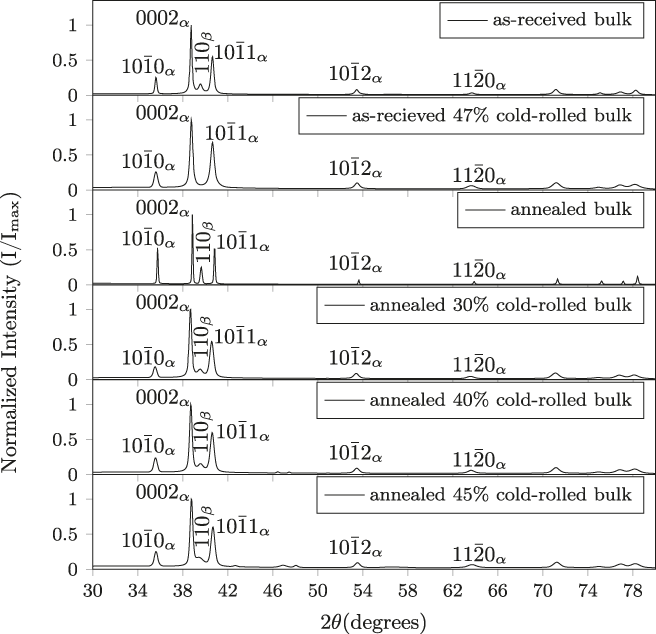
The diffraction profiles were obtained by varying 2θ from 30° to 80° with a step size of 0.05° for 2 s, and the peaks were indexed
Reference da Silva, Kerber, Amaral and dos Santos27
as shown in Fig. 3. The fraction of the (110) peak of the β phase in the annealed bulk material reduces during the cold-rolling process. In the as-received 47% cold-rolled specimen, the fraction of the (110) peak of the β phase completely vanishes, while it exists in the as-received material without cold-rolling. The intensity ratios of the diffraction peaks are a qualitative indication of the crystallographic texture in the material.
Reference Suwas and Gurao28
The intensity ratio of pyramidal to basal planes,
 $\left( {{I_{10\bar{1}1}}/{I_{0002}}} \right)$
in the annealed-rolled specimens with thickness reductions of 30, 40, and 45% is seen to increase progressively. Similarly, the intensity ratio of pyramidal to basal planes,
 $\left( {{I_{10\bar{1}1}}/{I_{0002}}} \right)$
, in the as-received 47% cold rolled specimen increases vis-à-vis the as-received specimen. This indicates that the rolled specimens have textures that are preferentially oriented as compared to their annealed and as-received counterparts. A macrotexture characterization was carried out from the pole figure measurements to determine the orientation of grains with respect to the sample frame of reference, results of which are given below.
X-ray diffraction profiles of as-received, as-received 47% cold-rolled, annealed, annealed 30% cold-rolled, annealed 40% cold-rolled, and annealed 45% cold-rolled bulk specimens.

B. Evolution of texture in bulk Ti–6Al–4V
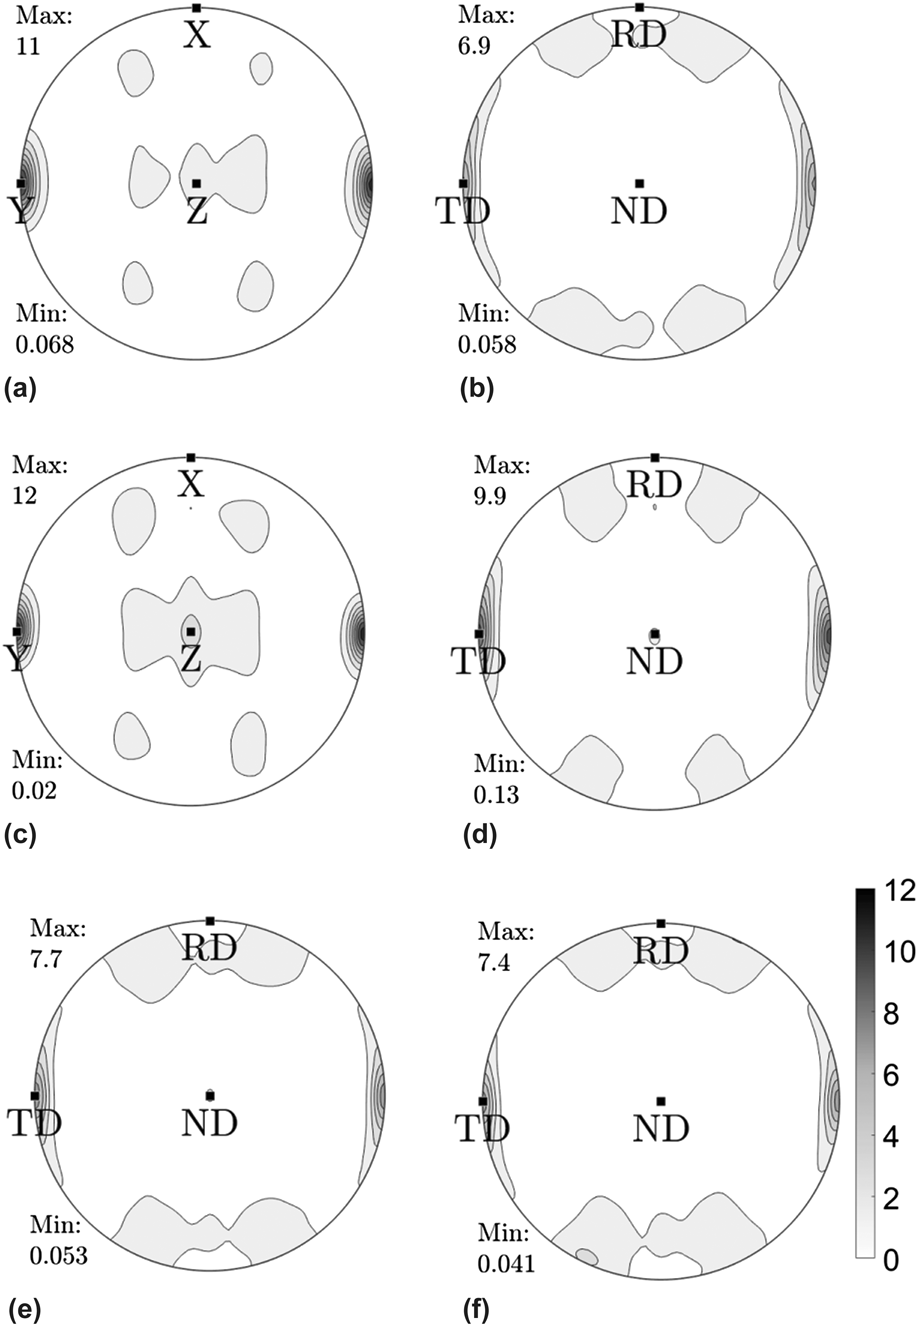
Figure 4 shows the recalculated (0002) pole figures from the as-received, annealed, and cold-rolled bulk samples. These pole figures were rotated by 90° along the X/RD axis. Figure 4(a) clearly displays a strong transverse (T) texture in the as-received material with the majority of grains having their 〈c〉 axes in the transverse direction (Y axis). This is typical of Ti–6Al–4V which is hot rolled at 960 °C below the β transus-temperature, Reference Peters, Gysler and Lütjering16 the thermo-mechanical process that the as-received material should have been subjected to. The texture of the annealed bulk shown in Fig. 4(c) was similar to that of the as-received material, which is consistent with the similar data reported in the literature. Reference Morii, Mecking, Lütjering and Nakayama29 The orientation of the 〈c〉 axis in the transverse direction progressively reduces during cold-rolling, Reference Philippe, Bouzy and Fundenberger30 as is evident in Figs. 4(d)–4(f). A similar trend is also observed when the as-received material is cold rolled to a thickness reduction of 47%, as is evident from Fig. 4(b).
Recalculated (0002) pole figures of (a) as-received, (b) as-received 47% cold-rolled, (c) annealed, (d) annealed 30% cold-rolled, (e) annealed 40% cold-rolled, and (f) annealed 45% cold-rolled bulk samples.

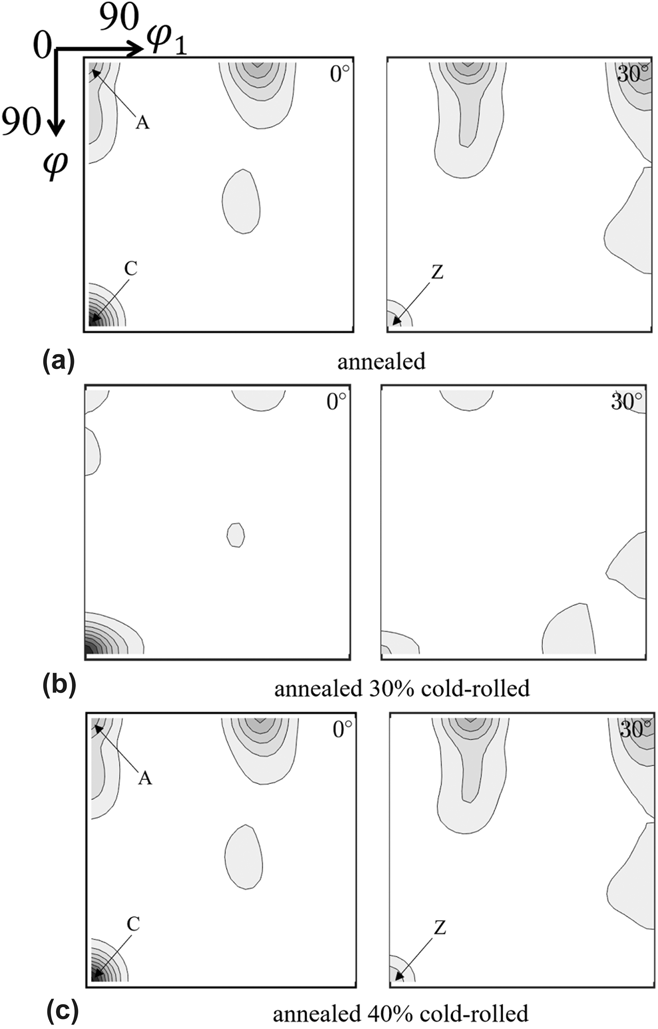
Figure 5 illustrates major texture components of the annealed and cold-rolled samples as contained in the ODF sections at φ2 = 0° and φ2 = 30°. The annealed samples revealed the presence of strong A and C texture components that progressively weakened upon cold-rolling (Table II). In addition, there is a Z texture component seen in the φ2 section of the annealed bulk sample that gradually reduces during cold-rolling. The texture evolution in the cold-rolling of Ti–6Al–4V is a strong function of the initial texture. The initial texture also influences the formation of continuous foils during the LSEM process. In this case, the hot-rolled Ti–6Al–4V as-received has this initial desirable texture.
ODF of φ2 sections of (a) annealed, (b) annealed 30% cold-rolled, and (c) annealed 40% cold-rolled bulk samples.

Texture components of annealed, annealed 30% cold-rolled and annealed 40% cold-rolled bulk samples.

C. Microstructural characterization
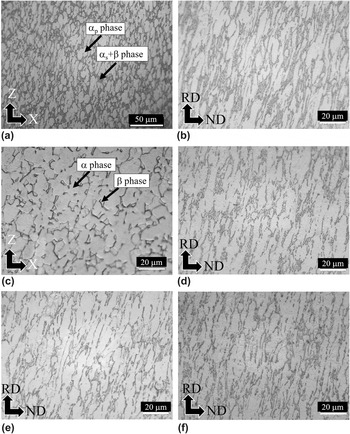
Polished bulk and chip specimens were etched with Kroll’s reagent 32 to reveal their microstructure. The reagent is a mixture of 85 mL water, 5 mL HNO3, and 10 mL HF. Figure 6 shows the microstructure of Ti–6Al–4V under different conditions. The microstructure of the as-received sample [Fig. 6(a)] comprises the primary αp and the secondary αs phases in the form of fine lamellae in the prior β phase. The area phase fraction of primary αp, estimated using LEICA phase expert software, was 61% with the remaining 39% consisting of αs and β phases. The area fraction of the β phase is less than the combination of αp and αs phases, which is also evident from Fig. 3 that shows only a small fraction of the (110) peak. The microstructure of the as-received sample comprises both elongated primary αp and equiaxed αp grains, which was due to hot rolling as evident from the (0002) pole figure [Fig. 4(a)]. When the as-received material was 47% cold rolled, the sample shows that the primary αp and the prior β grains are elongated along the rolling direction during the rolling process [Fig. 6(b)].
Optical micrographs of the Ti–6Al–4V alloy samples from: (a) the as-received bulk, (b) the as-received 47% cold-rolled bulk, (c) the annealed bulk, (d) the annealed 30% cold-rolled bulk, (e) the annealed 40% cold-rolled bulk, and (f) the annealed 45% cold-rolled bulk.

The as-received plates were annealed and subsequently cold rolled. The annealed microstructure shown in Fig. 6(c) has an equiaxed α phase and an intergranular β phase. The annealing and recrystallization stages remove dislocations due to cold work, thereby resulting in equiaxed α grains. The area phase fractions of the primary α phase and β phase were 71% and 29%, respectively, which is also evident from the XRD pattern showing a significant fraction of the (110) peak (Fig. 3). The annealed plates were then used as the starting microstructure for cold-rolling to different thickness reductions. Figures 6(d)–6(f) show micrographs of cold-rolled bulk samples obtained from annealed plates at different thickness reductions of 30%, 40%, and 45%. The α and β grains are elongated along the rolling direction during the rolling process.
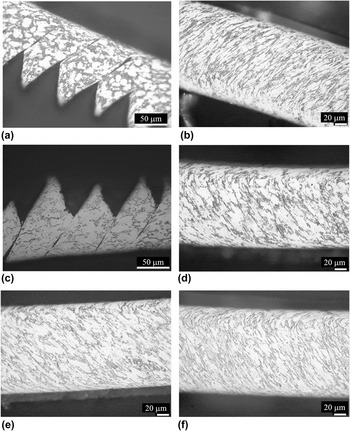
Figures 7(a) and 7(c) depict the microstructure of the chips resulting from the extrusion-machining process at a compression ratio of 1.4 from the as-received bulk and annealed bulk plates. These chips show fracture rather than intense shear in the shear bands Reference Efe, Moscoso, Trumble, Compton and Chandrasekar22 because the machining was carried out at a low cutting speed of 0.8 m/min which limits the adiabatic-band-formation due to thermal effects. The evident shear localization is due to the lack of a preferred orientation of grains in the bulk. The primary α grains in the shear localized chips were equiaxed due to the heterogeneous deformation during extrusion-machining. Moreover, λ = 1.4 may not be sufficient to arrest the free surface cracks in the primary shear zone during machining. This is consistent with Sagapuram et al. Reference Sagapuram, Yeung, Guo, Mahato, M’Saoubi, Compton, Trumble and Chandrasekar33 who have provided evidence showing that free surface cracks in Ti–6Al–4V can only be triggered by a sufficiently small λ of 0.6.
Optical micrographs of chips/foils at a compression ratio of 1.4 from: (a) the as-received bulk, (b) the as-received 47% cold-rolled bulk, (c) the annealed bulk, (d) the annealed 30% cold-rolled bulk, (e) the annealed 40% cold-rolled bulk, and (f) the annealed 45% cold-rolled bulk.

Figures 7(b), 7(d), 7(e), and 7(f) show the microstructure of the continuous foils obtained from the plates that were cold rolled to introduce the desired texture. The suppression of shear localization in the continuous foils produced from the bulk material with thickness reductions of more than 40% by cold-rolling is influenced by the preferential orientation of grains in the feed material. Additional imposition of strain through extrusion, after unconstrained machining, refines the microstructure of the continuous foils. An exception is the suppression of shear localization in the foils produced from the 30% rolled plate [Fig. 7(d)]. Here, the suppression was observed to be triggered only during the extrusion-machining process as the chips from the unconstrained machining process were shear localized. The above results show that the higher compression ratio set at 1.4 is sufficient to suppress the shear localization during the LSEM process even when the texture in the plate was inadequate (as in case of 30%). This is in contrast to the work reported by Sagapuram et al. Reference Sagapuram, Yeung, Guo, Mahato, M’Saoubi, Compton, Trumble and Chandrasekar33,Reference Sagapuram, Viswanathan, Mahato, Sundaram, M’Saoubi, Trumble and Chandrasekar34 where the suppression of shear localization during extrusion-machining of Ti–6Al–4V (without texture) could only be triggered by a smaller chip compression ratio of 0.6. This shows that the texture plays an important role in shear localization. The continuous foils possess α and β grains elongated in one direction, which is a manifestation of severe plastic flow during the deformation process. Since the as-received material was in a hot-rolled state prior to the rolling process, the microstructure and hardness values of the foils from this plate must not be compared with the foils produced from the plates that were cold rolled from the annealed material.
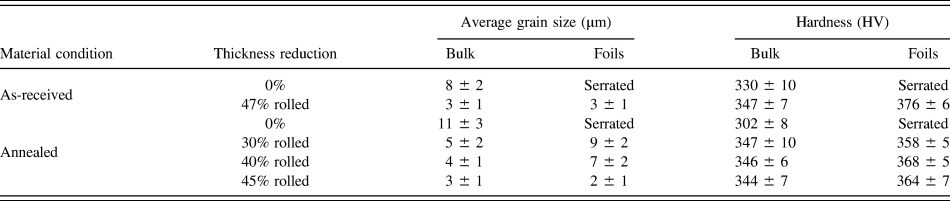
The aspect ratio of a grain is defined as the ratio of the largest dimension to the shortest dimension of the grain. If it is greater than 2, it is considered in this effort as elongated with values less than 2 representing the equiaxed grains. The equiaxed grains of the primary αp phase in the as-received bulk have an average grain size of 8 ± 2 µm. The grains in the α phase of the annealed bulk were equiaxed with an average grain size of 11 ± 3 µm. This increase in the average grain size was due to the recrystallization occurring in the annealed bulk. Grains in the rolled bulk samples, as well as foils, are elongated, and the shortest dimension of the grains is reported as the grain size. The average grain size of the cold-rolled bulk at different thickness reductions as well as foils is listed in Table III. There is a progressive refinement in the microstructure of the foils with increasing thickness reductions of the rolled bulk, which is evident in Figs. 7(d)–7(f). Since we are imposing the same shear strain on these foils during the LSEM process, the microstructure refinement in the foils can be attributed to the evolution of texture during cold-rolling.
Average grain sizes and Vickers hardness values for the as-received and annealed bulk at different thickness reductions (by cold-rolling) and their foils obtained during the LSEM process. Average values are reported along with the standard deviation. Results for foils without cold-rolling are not reported since the foils were serrated due to shear localization and hence are undesirable.

D. Hardness
The Vickers hardness values of Ti–6Al–4V subjected to different thermo-mechanical processes are shown in Table III. The Vickers hardness of the annealed sample was lesser (302 ± 8 HV) since the microstructure was equiaxed. In the as-received material, the microstructure was a mixture of equiaxed and elongated grains and hence the hardness value is 11% higher than that of the annealed material (334 ± 10 HV). The cold-rolled material was about 15% harder than the annealed material due to the imposition of cold work. The Vickers hardness of the as-received as well as the annealed bulk specimens cold rolled to different thickness reductions was nearly the same (about 346 HV). This lack of difference may be due to a higher stacking fault energy for the basal plane vis-à-vis that for the prismatic plane, which induces a cross-slip thereby enhancing dynamic recovery during cold-rolling. Reference Huang, Suzuki, Yuasa and Chino35 This is evident in Fig. 3 in the increase of the peak intensity for the basal plane (0002) of the cold-rolled specimens.
The microstructure of the foils from the as-received and annealed material cold rolled to 40% thickness reduction or more is fine grained and their hardness values were found to be nearly 20% more than those of the annealed bulk material. Consequently, foils from annealed 45% cold-rolled plates were selected for the TEM analysis, reported in the Sec. V.E.
E. TEM analysis
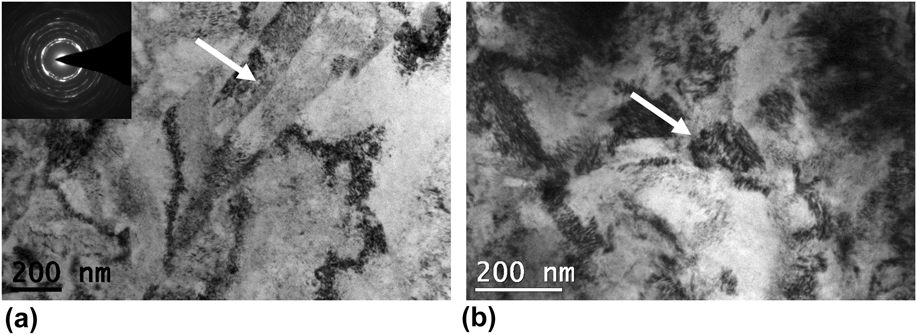
Typical TEM micrograph of a foil created [shown in Figs. 8(a) and 8(b)] from large strain extrusion-machining shows the presence of both equiaxed and elongated subgrain structures (highlighted by arrows). This is due to the significant microstructure refinement during extrusion-machining. The equiaxed grains were very few in number for the area of the sample analyzed under TEM and hence elongated grains were considered for measuring the grain size. The measurements indicated that there is a mixture of different sizes of elongated grains. In addition to micron level grain sizes, elongated grains of about 120 ± 40 nm were also observed in certain regions.
TEM micrographs of foil from LSEM of annealed 45% cold-rolled Ti–6Al–4V plate. The arrows indicate elongated and equiaxed grains in (a) and (b), respectively.

F. Role of texture and extrusion-constraint in suppressing shear localization
The chips generated by the unconstrained machining of annealed Ti–6Al–4V plates tend to segment primarily because of the lack of a suitable texture in the workpiece. The LSEM of annealed plates with a λ of 1.4 by itself was not sufficient to eliminate the chip segmentation as shown in Fig. 7(c). It has been shown in this work that the segmentation of the chip could be suppressed even during unconstrained machining by texturing the plates using cold-rolling beyond 40% thickness reduction. In these cases, the LSEM fixture just imparts additional strain and hence additional microstructure refinement to the outgoing foils. Furthermore, texture modification has facilitated the suppression of shear localization when the foils were generated using dies possessing a sufficiently high chip compression ratio of 1.4 vis-à-vis a ratio of 0.6, as reported by Sagapuram et al. Reference Sagapuram, Yeung, Guo, Mahato, M’Saoubi, Compton, Trumble and Chandrasekar33 This seems to imply that texture plays the dominant role, and a sufficient texture could adequately address shear suppression. When the material was cold rolled to only 30% thickness reduction, the texture was not adequate to avoid shear localization in the unconstrained machining. In this case, suppression of shear localization could be achieved only with the aid of LSEM [λ = 1.4, Fig. 7(d)] in addition to prior texturing. Thus, the texture formed in the 40% annealed cold-rolled bulk can be considered as a threshold for the suppression of shear localization independently, thereby generating continuous foils of Ti–6Al–4V. However, at a slightly lower thickness reduction (30%), the texture as well as constrained machining is required to generate continuous foils. In either case, extrusion also leads to a larger refinement in the grain microstructure and a consequent increase in hardness.
VI. CONCLUSIONS
The large strain extrusion-machining process involving severe plastic deformation has been used to produce continuous foils from the Ti–6Al–4V alloy. A large strain extrusion-machining fixture was designed to implement the extrusion-machining process for controlling the geometry of the chip, thereby producing continuous foils of desired thickness from the textured Ti–6Al–4V. A restricted-contact cutting tool was used to reduce the friction between the chip and the rake face of the tool, thereby reducing the hindrance to the chip flow. The suppression of shear localization in Ti–6Al–4V chips, a major challenge during the machining of this alloy, was achieved by a suitable modification of the texture of the workpiece prior to extrusion-machining. The texture modification was enabled by cold-rolling of Ti–6Al–4V plates to different thickness reductions. Even for a compression ratio at the deformation zone that is sufficiently high, continuous foils could be produced, provided the workpiece is textured. The texture formed in the plates rolled to more than 40% thickness reduction suppresses shear localization even during the unconstrained machining process, thereby producing continuous foils. Additional imposition of strains through extrusion-machining refines the microstructure. With this combination of machining and extrusion, continuous foils with hardness up to 20% more than that of annealed Ti–6Al–4V could be obtained due to microstructure refinement. Therefore, it is desirable to have at least 40% thickness reduction during cold-rolling to produce a texture that will suppress the shear localization even during unconstrained machining. For a slightly lower thickness reduction (as in case of 30%), extrusion is required in addition to texturing to suppress shear localization.
ACKNOWLEDGMENTS
The authors acknowledge Professors N.V. Ravi Kumar and V. Subramanya Sarma in the Department of Metallurgical and Materials Engineering at IIT Madras for their useful suggestions. Support rendered by the staff at the workshop in the Department of Engineering Design; the Physical Metallurgy Laboratory; and the Metal Forming Laboratory and Mechatronics Laboratory, IIT Madras are all gratefully acknowledged. The authors also acknowledge XRD facilities offered by the Department of Metallurgical and Materials Engineering at IIT Bombay to conduct bulk texture measurements. We are also thankful to the materials and manufacturing panel of the Aeronautics Research & Development Board (ARDB) for their support.