Introduction
Supercapacitors as ideal energy storage devices have attracted increasing interest in the past few years owing to their high power density, good cycling stability, quick charging–discharging, high energy efficiency, and high safety [Reference Chen, Zhang, Liang, Kong, Guan, Chen, Wu and Yu1, Reference Lee, Kim, Yun, Yoon, Mathur, Shin and Kim2, Reference Kim, Jung, Yoo, Suh and Ruoff3, Reference Yan, Kim, Xing, Donavan, Ayvazian and Penner4, Reference Fu, Cai, Wu, Lv, Hou, Peng, Yu and Zou5, Reference Meng, Liu, Chen, Hu and Fan6, Reference Zhong, Deng, Hu, Qiao, Zhang and Zhang7, Reference González, Goikolea, Andoni and Mysyk8]. Based on the charge storage mechanism, supercapacitors are generally divided into either electrical double layer capacitors or pseudocapacitors. Pseudocapacitors exhibit a significantly enhanced capacitance compared with double-layer capacitor [Reference Conway9], which has drawn wide attention. The amount of pseudocapacitance depends on the surface area, material, and structure of the electrodes [Reference Jing, Liu, Liu, Jiang, Dong, Dong, Wang, Li, Lan and Zhang10]. Many oxides of transition metals, like ruthenium (RuO2) [Reference Hu, Chang, Lin and Wu11, Reference Jiang, Kurra, Alhabeb, Gogotsi and Alshareef12], iridium (IrO2) [Reference Chen, Cai, Huang, Lee and Tsai13, Reference Korkmaz, Tezel and Kariper14], iron (Fe3O4) [Reference Fan, Niu, Duan, Liu and Shen15, Reference Long, Wei, Yan, Jiang and Fan16], and manganese (MnO2) [Reference Zhu, Li, Liu, Wang, Wang, Zhang, Zhang, Ruoff and Dong17, Reference Huang, Zhao, Li, Zhang and Zhang18, Reference Lin, Wei, Chien and Lu19, Reference Rao, Kumar, Naik and Naik20], have been used as electrode materials of pseudocapacitors. It is difficult to improve the energy density on the premise of maintaining the high power density when these metal oxides were used as electrode materials of supercapacitors. At present, the research focus of supercapacitors is still to look for a more ideal electrode system and to optimize the microstructure of electrode materials through the development of new and inexpensive oxide materials [Reference Li, Teng, Chen, Li, Hua, Wang and Li21, Reference Wu, Han, Zheng, Yao, Yang and Zhai22, Reference Wu and Yao23].
It is worth highlighting that the major drawback associated with pseudocapacitance as supercapacitors is that their voltage often significantly decreases once they begin to discharge as power sources [Reference Wang, Wang, Yue, Shi, Shang, Zhang, Lv and Ao24, Reference Xing, Dong, Hu, Wu and Umar25]. As a result, this greatly affects the smooth operation of the electronic/optoelectronics devices [Reference Liu, Liu, Wang, Wu, Zhao, Xu, Chen and Shen26]. To address this issue, a voltage-stabilizing unit has been introduced into supercapacitors. Up to date, the existing voltage-stabilizing units are still far from satisfactory, including redundant circuits and complicated and high cost procedures, leading to great challenges in integrating with supercapacitor to fulfill multifunctional demands at minimized scales [Reference Zheng, Yang, Chen and Yuan27].
Resistive switching (RS), which plays an important role in operating resistive random access memory devices, has been extensively studied [Reference Beck, Bednorz, Gerber, Rossel and Widmer28, Reference Yoon, Kim, Song, Seok, Yoon, Kwon, Park, Kwon, Shao and Hwang29]. The typical RS was prepared in a format of sandwich structure, with the RS material in the middle and the metal electrode at both ends. It can be easily integrated into micro/nano-structured devices. By applying a bias voltage in excess of given threshold values, the resistivity can be changed from a low resistivity state (LRS) to a high resistivity state (HRS) and then return to its original state. This feature could be used to stabilize the discharging process of supercapacitors. In the previous work, Liu et al. [Reference Liu, Liu, Wang, Wu, Zhao, Xu, Chen and Shen26] improved the voltage stability by connecting a memristor in parallel with the supercapacitor. However, the external memristor of this method needs to be fabricated separately, and the difficulty of the preparation process is increased. At the same time, the integration of the two devices will also affect the performance of the supercapacitor and greatly increase the cost.
Indium tin oxide (ITO) is widely used as a transparent conducting oxide material in the fabrication of optoelectronic devices, such as light emitting diodes (LEDs), solar cells, flat panel displays, and sensors [Reference Wan, Dattoli, Fung, Guo, Chen, Pan and Lu30, Reference Hill, Banks, Haller, Orazem and Ziegler31, Reference Noh, Han, Lee, Kim, Hong, Han, Shin and Jung32, Reference Qin, Tong, Luo, Jiang, Liu, Jiang, Xu, Mao, Meng, Xiong, Li, Li and Zhou33, Reference Cairns, Witte, Sparacin, Sachsman, Paine, Crawford and Newton34]. ITO nanowires (ITO-NWs) have good single crystal structure, which not only keep the characteristics of the ITO film but also have high surface–volume ratio and excellent photoelectric properties [Reference Li, Feng, Wang, Li and Yun35, Reference Li, Zhang, Feng, Wang, Wang and Yun36]. In our previous study, the bipolar RS behavior of ITO-NW networks on aluminum (Al) film was observed [Reference Li, Gong, Wang, Zhang and Yun37].
In this paper, ITO-NWs were prepared on nickel (Ni) foam by means of magnetron sputtering technique, acting as an electrode of pseudocapacitor. This structure not only has high performance of supercapacitor but also has the characteristics of resistance switching (RS). The device show a high specific capacitance of 956 F/g at the scanning rate of 10 mV/s, while the window (HRS/LRS ratio) as a bipolar resistance switch exhibits as high as 102. By taking these properties together, a kind of supercapacitor electrode featured with self-stabilizing capability has been designed and then fabricated, demonstrating significantly enhanced voltage stabilizing effect in the discharge process.
Results and discussion
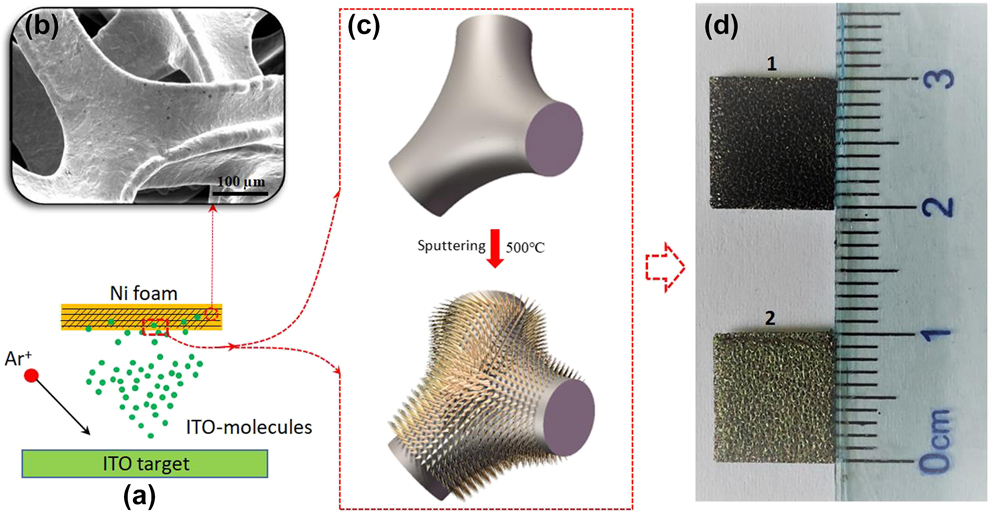
Figure 1(a) schematically illustrates a process of ITO nanostructures prepared on Ni foam by sputtering technique. The ITO target was bombarded by Ar ions, where the mixing ITO ions (In3+, Sn4+, O2−) entered the void of Ni foam and attached to the framework. The ITO nanostructures began to grow with forming In–Sn alloy particles as nucleation sites by controlling the oxygen flow rate and chamber temperature. Figure 1(b) is a typical scanning electron microscope (SEM) image of the Ni foam frame used. Figure 1(c) shows a schematic diagram of ITO-NWs grown on Ni foam frame by sputtering without oxygen at 500 °C. The samples were prepared under aerobic and anaerobic conditions. Two samples with a same size are shown in Fig. 1(d). Sample 1 was fabricated without oxygen, and sample 2 was fabricated with an oxygen flow rate of 0.2 sccm. The color of the two samples is obviously different, and the color of the sample is black under the anaerobic condition.
(a) The fabrication process of samples by sputtering; (b) the SEM image of Ni foam frame; (c) schematic diagram of ITO-NWs grown on Ni foam frame; and (d) photography of two samples prepared under different oxygen rates: sample 1 without oxygen and sample 2 with 0.2 sccm.
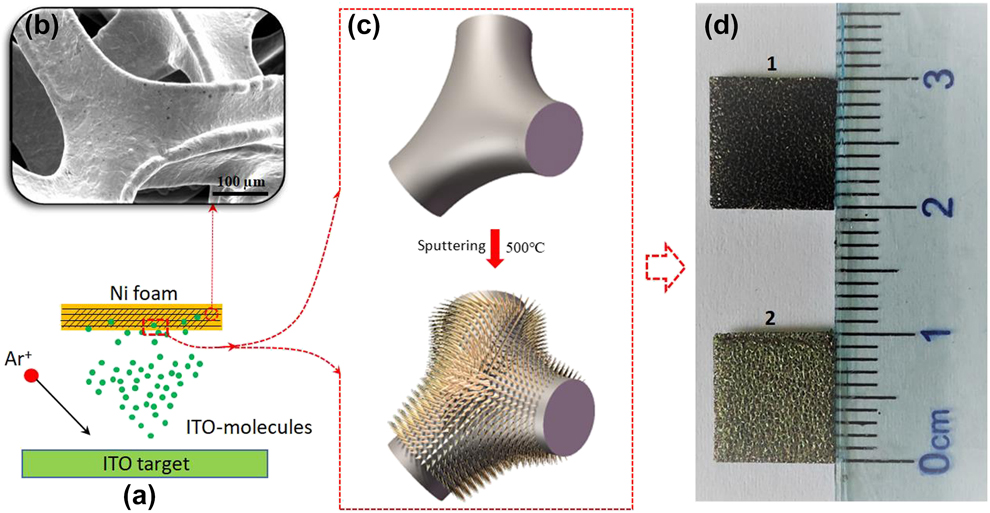
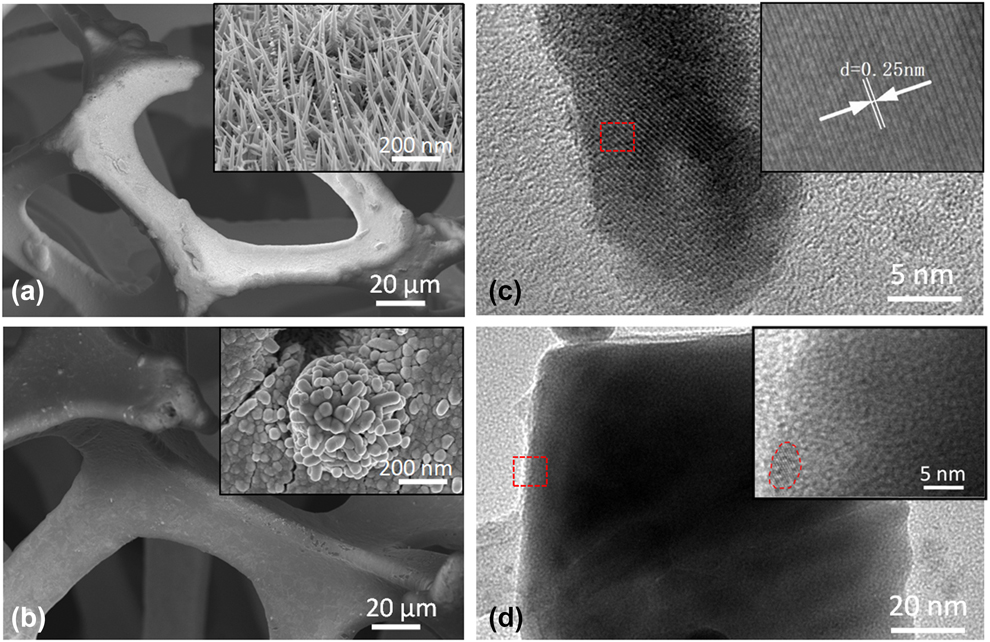
Figure 2(a) shows the SEM images of ITO-NWs on Ni foam from sample 1. It can be seen that numerous needle-like ITO-NWs were vertically grown on the surface of the Ni foam framework, leading to a stable and porous three-dimensional (3D) network with a large surface area and appropriate space. Obviously, the nanowires increase the surface area of the electrode and provide more active sites for the redox reactions. Figure 2(b) shows SEM images of ITO nanorods (ITO-NRs) on Ni foam from sample 2. The diameter of the nanorod is larger than that of nanowire and the length is short.
The SEM images of (a) ITO-NWs and (b) ITO-NRs on Ni foam. The HRTEM images of (c) nanowire and (d) nanorod.
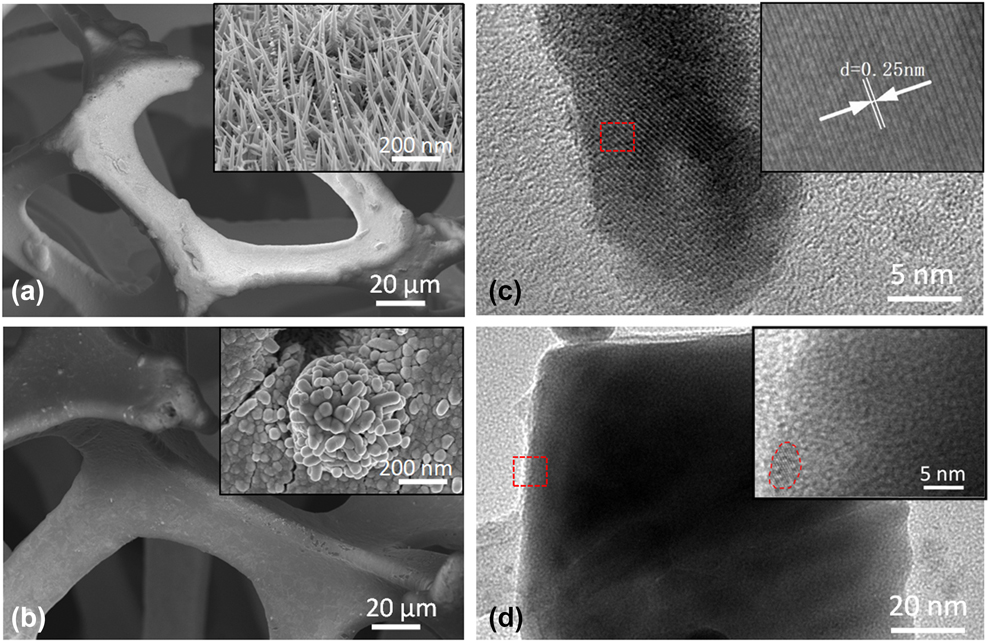
The high-resolution transmission electron microscopy (HRTEM) was conducted to further detail the microstructures of the samples. Figure 2(c) is the image of the nanowire. It demonstrates that the spacing of the lattice plane is about 0.25 nm, which was coincided with the “d” spacing of the (400) plane of the cubic phase of In2O3 [Reference Fung, Sun, Ng, Ng, Djurišić, Chan and Chan38, Reference Li, Chen, Kim, Xu, Zhao and Ziegler39]. Figure 2(d) is the HRTEM image of nanorod, and the inset is an enlargement of the selected area. It can be seen that nanorod has no crystal orientation in the mass, indicating it is not a single crystal structure. The selected area electron diffraction (SAED) images of nanowire and nanorod are shown in Supplementary material I (Fig. S1).
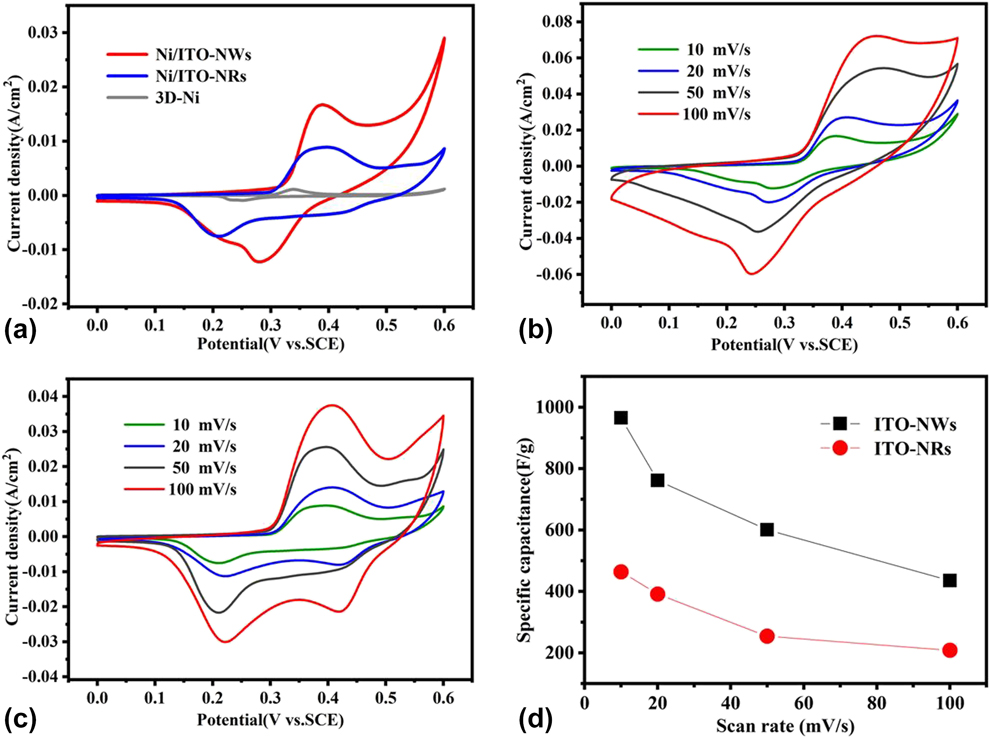
Three-electrode measurements were conducted to investigate the electrochemical performance of electrodes. Figure 3(a) shows a comparison of cyclic voltammetry (CV) curves of the prepared electrodes within the potential window of 0–0.6 V at the same scan rate of 10 mV/s. The size of all samples for testing is 2 cm × 3 cm. The areal capacitance of pure 3D-Ni foam as electrode is 21 mF/cm2, which should be a small amount of NiO remaining on the surface of Ni foam framework. The CV curves of ITO nanostructures have obvious redox peaks, revealing the faradaic nature of the battery-type electrodes. The areal capacitance value of ITO-NRs prepared on the Ni foam as an electrode was 155 mF/cm2, illustrating that the capacitance characteristics have been enhanced. When ITO-NWs were prepared on Ni foam, the capacitance value changed to 322 mF/cm2, which showed a supercapacitive property. The pair of strong redox peaks are attributed to the faradaic redox reactions assigned to the ITO nanostructure redox couple prior to the generation of oxygen vacancies. The CV curve of the ITO-NWs electrode with stronger redox peaks indicates that ITO-NWs have more oxygen vacancy. The redox reactions in the alkaline electrolyte for the ITO nanostructure/Ni foam can be described as the following equations:
 $${\rm{I}}{{\rm{n}}_2}{{\rm{O}}_3}{\rm{\ }} + {\rm{\ }}3{{\rm{H}}_{\rm{2}}}{\rm{O}} \leftrightarrow 2{\rm{In}}{\left( {{\rm{OH}}} \right)_3}\quad ,$$
 $${\rm{In}}{\left( {{\rm{OH}}} \right)_3} + 4{\rm{O}}{{\rm{H}}^ - } \leftrightarrow {\rm{InO}}\left( {{\rm{OH}}} \right) + 3{{\rm{H}}_{\rm{2}}}{\rm{O}} + 2{{\rm{O}}^{2 - }}\quad .$$
Performance characterizations of supercapacitor. (a) Typical CV curves of Ni foam, Ni foam with nanorods, and Ni foam with nanowires between 0 and 0.6 V. (b, c) The CV curves of Ni foam with nanowires and nanorods at various scan rates. (d) The corresponding rate capability.
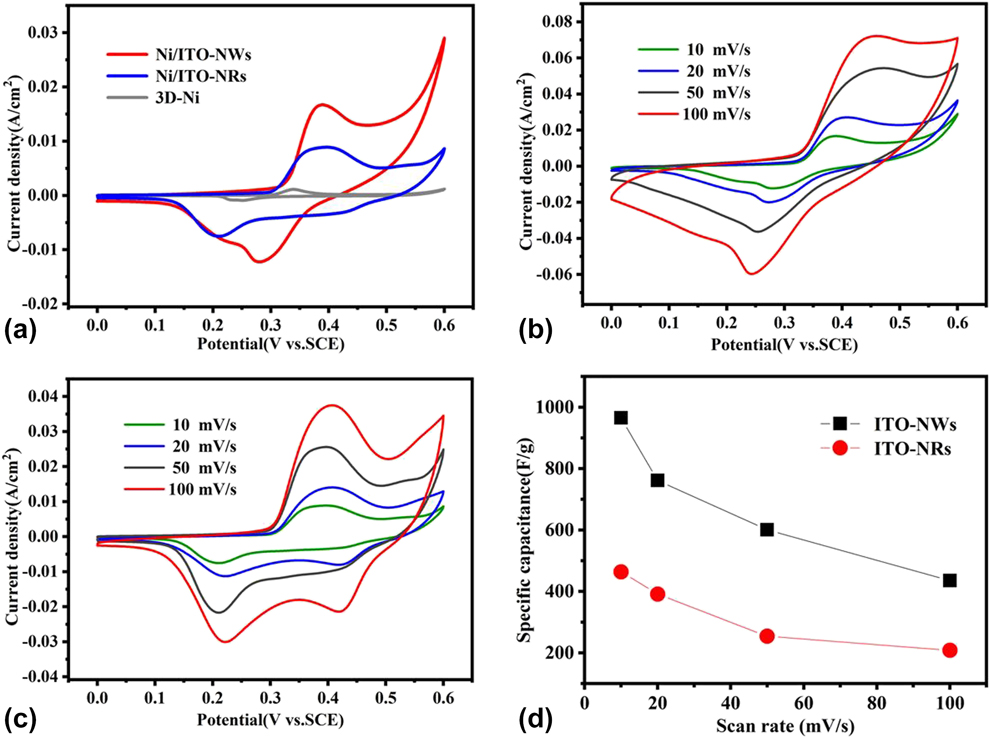
The combined electrode shows a significantly larger integrated CV area, which implies its higher capacity. The integrated area of the cleaned Ni foam is limited when compared with that of the combined electrode, suggesting that the capacity contribution from the cleaned Ni foam is negligible [Fig. 3(a)]. Moreover, the CV curves of the ITO-NWs and ITO-NRs electrode at the scan rates of 10–100 mV/s are shown in Figs. 3(b) and 3(c). With increasing scan rate, the position of the cathodic peak gradually shifts toward a more cathodic position and the anode peak toward a more anodic direction, implying a good rate capability of the combined electrode [Reference Fu, Wang, Han, Zhang, Zha and Xie40]. There is another cathodic peak between 0.4 and 0.5 V in the CV curves of ITO-NRs [Fig. 3(c)]. In the preparation of nanorods, oxygen was introduced into the sputter chamber and the oxygen flow rate was 0.2 sccm. A small amount of oxygen reacted with Ni to form NiO in the chamber at 500 °C. The peak appeared between 0.4 and 0.5 V in the CV curves of ITO-NRs when NiO participated in redox reaction. The nanowires were prepared under anaerobic conditions, so this peak was not appeared [Fig. 3(b)].
The corresponding calculated specific capacitances of ITO-NWs are 956.0, 761.3, 600.8, and 435.4 F/g at the scanning rate of 10, 20, 50, and 100 mV/s. And, at the same scanning rates, the specific capacitances of the ITO-NRs are 463.8, 391.3, 254.0, and 208.5 F/g, respectively. All the results are summarized in Fig. 3(d), which indicated that the capacitance characteristics of nanowires on Ni foam as electrode are much better than those of nanorods with Ni foam.
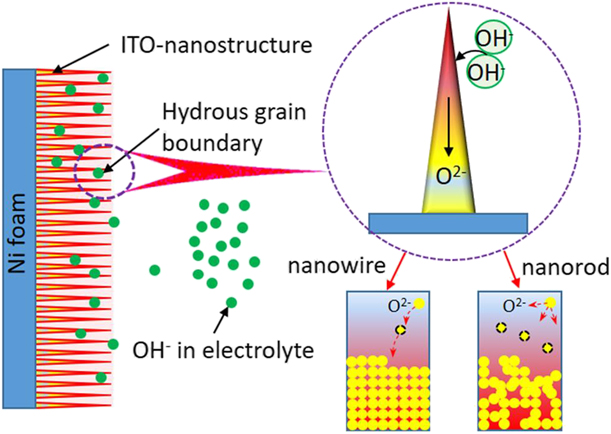
The capacitive properties of nanowires are superior to those of nanorods, except that nanowires have larger specific surface area than nanorods. Another reason is that the ability of nanowires to store oxygen vacancies is stronger than that of nanorod [Reference Li, Gong, Wang, Zhang and Yun37]. (The X-ray photoelectron spectroscopy (XPS) results of binding energy analysis of O 1s in nanowires and nanorods are shown in Supplementary material II, Fig. S2.) As shown in Fig. 4, the growth of ITO nanostructures on the surface of Ni foam greatly expands the contact area between the electrode and the reaction solution. When In2O3 (the main component of ITO) and KOH solution occur redox reaction, the oxygen vacancies generated in ITO-nanostructures carry charges for energy storage. According to the transmission electron microscopy (TEM) results in Fig. 2, the nanowires have a good single crystal structure and the material is arranged in the crystal direction, while the nanorods have no obvious crystal direction. This creates the difference in the way that oxygen vacancies are stored in two kinds of materials. The storage of oxygen vacancies in nanowires presents a regular array arrangement, whereas in nanorods it is randomly disordered. In this way, the charge storage capacity of nanowires is much larger than that of nanorods, which results in the capacitance characteristics of nanowires much higher than that of nanorods.
ITO nanostructure grown on Ni foam as supercapacitor electrode.

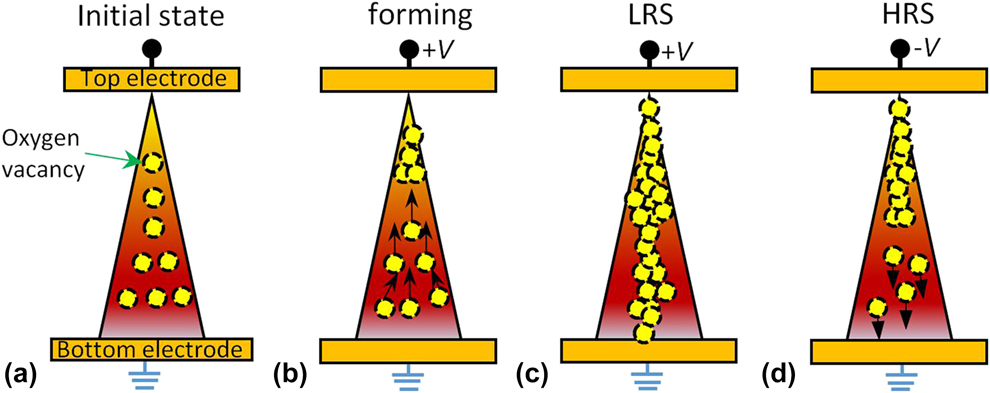
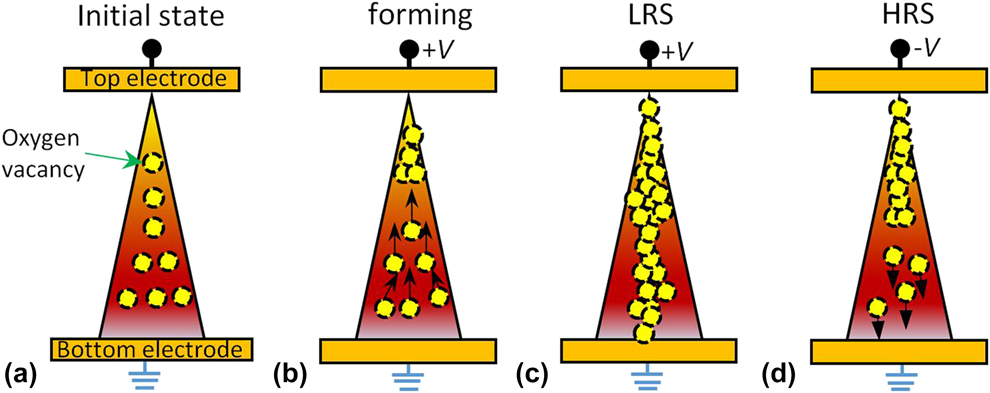
Because ITO-NWs grow on the framework of Ni foam, metal Ni can be used as the bottom electrode. When the other electrode was fabricated on the top of nanowire, a classical sandwich resistance switch was formed (metal/oxide material/metal). Figure 5 shows the operational principle of ITO-NW as RS material. Because ITO-NWs are prepared under anaerobic conditions, there are more oxygen vacancies in the nanowires. In the initial state, no voltage was applied to the electrodes and the oxygen vacancies exhibited a random distribution [Fig. 5(a)]. The nanowires present an obvious tip discharge effect because of their needle-shaped morphology. When voltage is applied at both ends of the nanowire, the oxygen vacancies in nanowire begin to accumulate toward the tip [Fig. 5(b)]. With the accumulation of oxygen vacancies, a conducting pathway will be formed to connect the top and bottom electrodes. The LRS of the resistance switch was obtained [Fig. 5(c)]. When a reverse voltage was applied to the structure, the oxygen vacancies were moved to opposite direction, resulting in a breakdown of the channel. And then, the resistance switch is restored to HRS [Fig. 5(d)].
Schematic of anion migration–dominated (oxygen vacancy) switching kinetics in ITO-NW. (a) The initial state with randomly distributed oxygen vacancy; (b) oxygen vacancies gather toward the tip of ITO-NW during forming process; (c) oxygen vacancies form conductive pathways to achieve LRS; and (d) reverse voltage is applied to restore HRS.
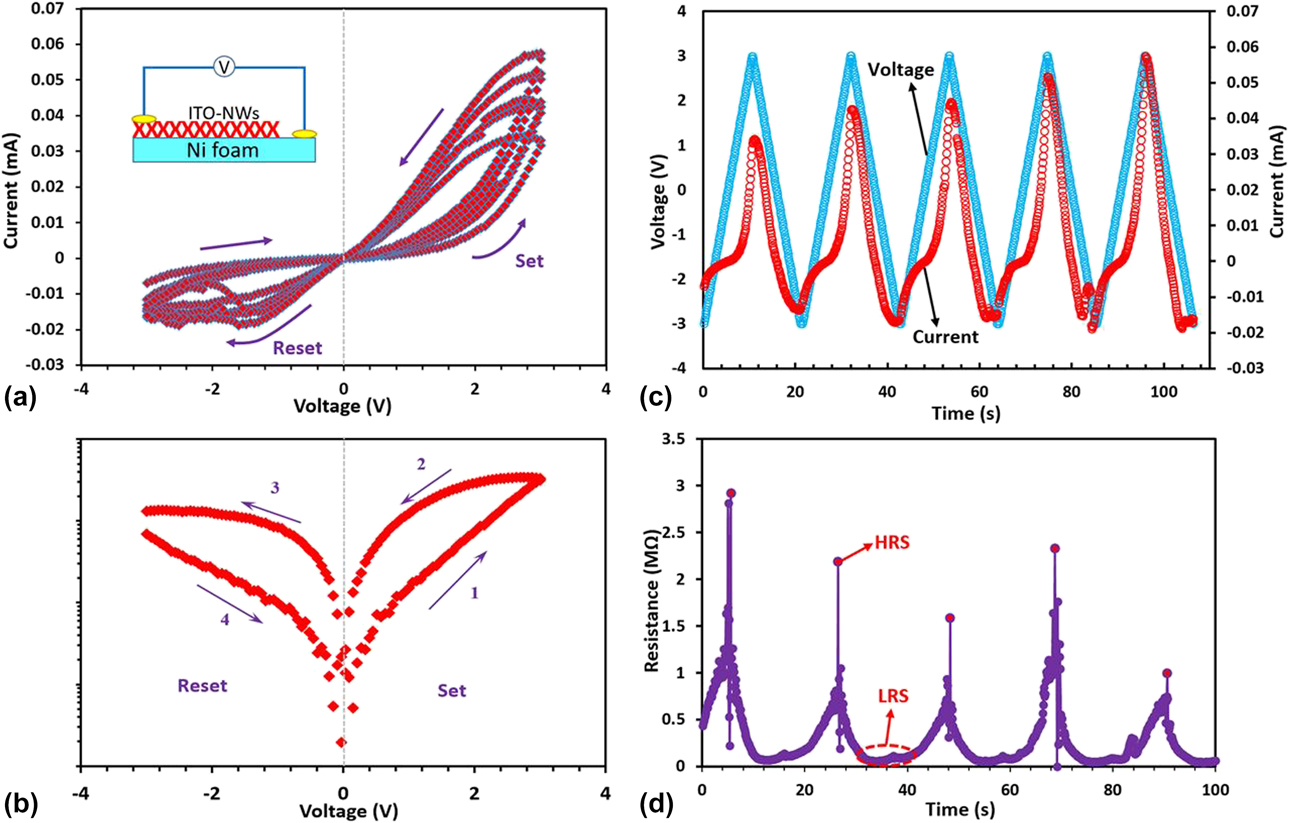
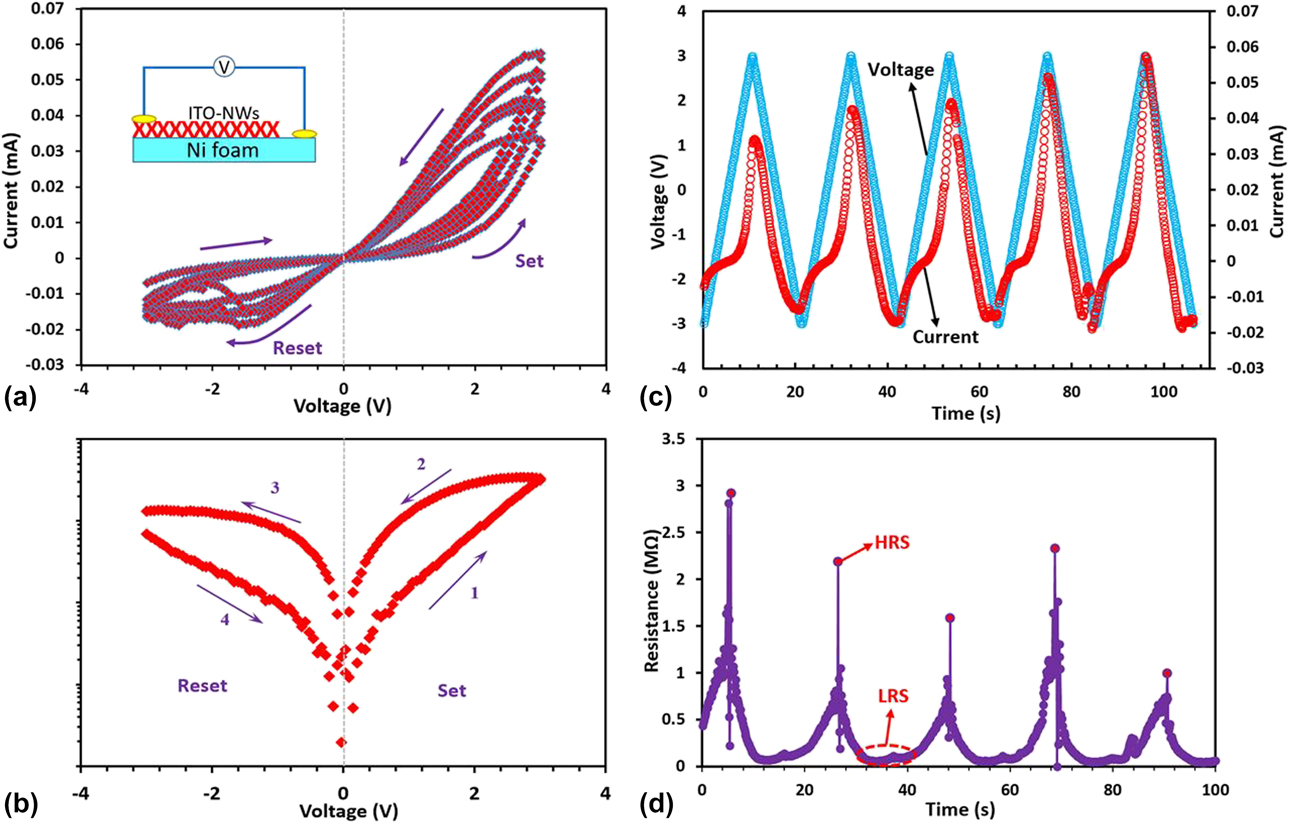
To verify the RS characteristics of ITO-NWs on Ni foam, a structure of resistance switch was proposed to test, as shown in the inset of Fig. 6(a). The top electrode was made of indium. Figure 6(a) shows the typical current–voltage (I–V) characteristics of In/ITO-NWs/Ni resistance switch for five cycles. Figure 6(b) is the I–V characteristics on the semi-logarithmic axis. The arrows in the figure denote the sweeping direction of voltage. It exhibits an asymmetric I–V relation with significant hysteresis. When the voltage is swept to a positive value above a certain voltage of 2.1 V (V-set), the leakage current jumps abruptly, which switches the resistance from HRS to LRS. When the voltage is negatively swept to a particular value of −1.3 V (V-reset), a decrease in the leakage current occurs and the resistance switch back to HRS again. Therefore, this In/ITO-NWs/Ni structure exhibits a bipolar RS behavior, and the bipolar RS behavior is reversible. Five RS cycles were measured continuously, and the results showed that the open voltage was consistent. To show the I–V characteristic of ITO-NW networks more directly, the trend diagram of the applied voltage and the corresponding current by continuous measurement for five cycles was drawn in Fig. 6(c). Under the same maximum bias voltage of 3 V, the trend of current value is increasing. This means that the resistance of ITO-NWs network has been improved. This phenomenon may be caused by the breakage of some nanowires. From the distributions of HRS and LRS, as shown in Fig. 6(d), there is a clear memory window of the device and the HRS/LRS ratio is as high as 102.
(a) I–V characteristics of a typical RS device measured in five continuous cycles, yielding bipolar RS behavior of Ni foam with ITO-NWs. (b) I–V characteristics on the semi-logarithmic axis. (c) The changes in current when applying a sawtooth voltage. (d) The cycling characteristics for the HRS and LRS of RS device.
The samples were investigated in a three-electrode configuration with the nanostructures grown on Ni foam (2 cm × 3 cm) as the working electrodes, a saturated calomel (SCE) as the reference electrode, and platinum plate as the counter electrode. KOH solution with a concentration of 6 mol/L was used as electrolyte. Galvanostatic charge–discharge measurements were carried out to evaluate the electrochemical performance of the electrode. The working electrode has both a supercapacitor electrode and an RS device, thus forming a voltage self-stabilizing supercapacitor electrode structure.
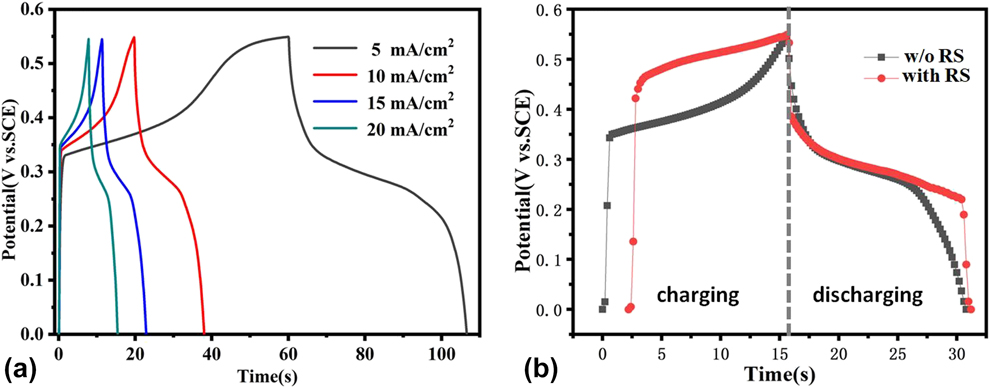
First, charge–discharge experiments on the sample under different current densities were carried out. Figure 7(a) shows the galvanostatic charge–discharge curves of the ITO-NWs/Ni foam electrode at current densities ranging from 5 to 20 mA/cm2 with the potential window of 0–0.55 V. The areal capacities of the electrode are 151.5, 99.5, 85.6, and 78.8 μA h/cm2 at the current densities 5, 10, 15, and 20 mA/cm2, respectively. It can be found that the areal capacity gradually decreases with the current density and there still remains 78.8 μA h/cm2 at a high current density of 20 mA/cm2. This value is 52% retention of that at 5 mA/cm2, demonstrating a good rate capability.
(a) The charge–discharge curves of the electrode of Ni foam with ITO-NWs at 5, 10, 15, 20 mA/cm2. (b) The charge–discharge curves of the electrode with and without memristor at 10 mA/cm2.
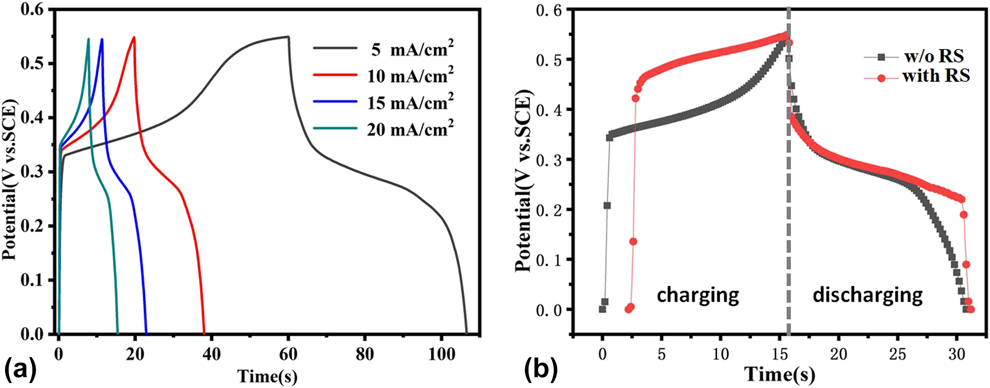
Then, the RS part was introduced into the measuring system. The charge–discharge curves measured with and without RS at the current density of 10 mA/cm2 are shown in Fig. 7(b). For the RS integrated electrode, the voltage stabilization time increased significantly during the discharge process. The voltage stabilization time of electrode without RS is 7.5 s at a stable discharging voltage of ∼0.3 V, while that of electrode with RS is 14.5 s. The stabilization time is nearly doubled (increased by 93.3%), revealing the possible application of the integrated electrode as voltage self-stabilizing supercapacitor.
To explain the reason why the resistance switch delivered stable voltage during discharging process, the charging process should also be analyzed. Figure 7(b) shows that the voltage of the integrated electrode is obviously increased during the charging stage, because resistance switch and supercapacitor are in series in the circuit and resistance switch generates a certain voltage. The resistance state of the switch has changed from HRS to LRS during charging process. During the discharge process, if the discharge voltage is less than V-reset, the state of resistance switch will maintain the LRS. When the reset voltage is reached, the state restores to the HRS. The resistance switch with HRS can stabilize the output voltage by limiting the current and dividing the voltage of the whole circuit. At the same time, the structure of resistance switch is also a capacitor in principle. It can store a certain charge, which may cause more compensation for external output circuit. Finally, the synergistic effects of integrated devices can enable discharge voltage to smoothly keep longer.
Conclusions
In summary, ITO-NWs were prepared on Ni foam by magnetron sputtering as the electrode of pseudocapacitor. This structure not only has high performance of supercapacitor but also has the characteristics of RS. The specific capacitance value is 956 F/g at the scanning rate of 10 mV/s, and the window (HRS/LRS ratio) as a bipolar resistance switch is as high as 102. By combining these properties, a kind of integrated electrode with self-stabilizing was designed and fabricated. The voltage stabilization time during discharging process is nearly doubled, revealing the possible application of the integrated electrode as voltage self-stabilizing supercapacitor.
Experimental section
Fabrication of ITO nanostructures
The Ni foam with size of 2 cm × 3 cm was soaked in diluted hydrochloric acid of 0.5 mol/L for 10 min. And then, it was cleaned in deionized water for 20 min by ultrasonic wave. Last, the Ni foam was dried in vacuum. For sputtering deposition, a background pressure of 1.5 × 10⁻⁴ Pa, a working pressure of 0.95 Pa, and an argon flow rate of 25 sccm were used. The ITO target used was In2O3:SnO2 with 90:10 (wt%). The morphology of ITO nanostructures deposited at 500 °C by using a radio frequency (RF) power of 250 W under two oxygen conditions was investigated—namely, without O2 and with an oxygen flow rate of 0.2 sccm. The sputtering time for all the samples is 20 min.
Preparation of RS
The sample with ITO-NWs grown on Ni foam has two sides. The front side (opposite to the sputtering target side, the surface nanowires are denser) as the upper surface, and the indium is used as the connection metal on the ITO-NW network to form the top electrode. On the back side of the sample, the Ni foam framework can be used as bottom electrode. The RS part presents sandwich structure of In/ITO-NWs/Ni.
Material characterization
The SEM analyses were conducted on a HITACHI SU6600 (Tokyo, Japan) Schottky Emission VPFE-SEM instrument. Bright-field TEM analyses were conducted on a JEOL JEM 2100F microscope (JEOL, Tokyo, Japan), operated at 200 kV acceleration voltage. The specific capacitance was calculated using the definition formula of C s = Q/(m∆V), where Q is the average total charge, m is the mass of the active material, and ∆V is the scanned potential window size. The average total charge was determined based on the enclosed area of the CV loops. The areal capacitance could be calculated if the mass (m) is replaced by the area (s) in the formula.
Performance measurement
The resistive switching characteristics of RS were measured by probe station and precision source/measure unit (Keysight, B2902A, Agilent Technologies Co. Ltd., Beijing, China). The diameter of the probe is 5 µm. The scanning voltage range is from −3 to 3 V, and the protection current is 1 mA. In the measurement process, a data point was collected every 0.1 s and 200 data points were collected in one cycle. The supercapacitor properties were characterized by using the electrochemical workstation (CHI660E; Shanghai Chen Hua Instrument Co., Ltd., Shanghai, China) in 6 mol/L KOH aqueous electrolyte at room temperature. The samples were investigated in a three-electrode configuration with the nanostructures grown on Ni foam (2 cm × 3 cm) as the working electrodes, an SCE as the reference electrode, and platinum plate as the counter electrode.
Supplementary material
To view supplementary material for this article, please visit https://doi.org/10.1557/jmr.2019.241.
Acknowledgments
This work was supported by the grant from the National Key R&D Program of China (No. 2016YFB0400801), the Natural Science Foundation of Shaanxi Province (No. 2017JQ6013), the China Postdoctoral Science Foundation (No. 2014M562415), and the Fundamental Research Funds for the Central Universities (No. xjj2017011).