

1 Introduction
This paper is about two ways in which firms may contribute to the persistence of differential remuneration between men and women of comparable talent via the creation and deployment of networks of personal contacts. First, firms are the most common setting in which individuals make professional contacts – through interacting with colleagues who will remain potential sources of information, advice and help later in their career. Second, firms often use networks of professional contacts, explicitly or implicitly, to help them recruit.
The impact of individuals' networks of personal and professional contacts on the development of their careers has been the subject of academic research for several decades and of intense private speculation for much longer than that. The popular saying ‘it's not what you know, it's who you know’ implies that networks of contacts are causally effective in promoting individuals' professional advancement. It also implies that inequalities in profession recognition may exist between equally talented individuals because of chance events that may lead some to have more effective networks of contacts than others.
The question whether women suffer from a lack of professional advancement due to their possessing less effective networks of contacts than men has also a long pedigree. But it has proved extremely difficult to move beyond anecdote and provide hard evidence about the nature and extent of this phenomenon if indeed it exists. Even if networks are observed to be correlated with professional advancement, causality has been almost impossible to determine, for the simple reason that ‘who you know’ is likely to be highly correlated with ‘what you know’. Individuals with talents and other characteristics that contribute to their professional success are also likely to build more extensive networks. Their networks might be symptomatic of their talents, leading to a correlation between their networks and their success even if their networks in no way contribute to that success.
In this paper we tackle the question of the comparative effectiveness of men's and women's professional networks, using a methodology for measuring the causal impact of networks, which we proposed and tested in a companion paper (Berardi et al. (Reference Berardi, Lalanne and Seabright2019)). The novelty in the present paper is not just that we apply the method to investigating whether there are gender differences in the causal impact of networks – it is also that we explore an institutional mechanism through which such gender differences may arise and be perpetuated.
We use a panel dataset of nearly 27,000 senior executives of over 5,000 North American and European firms, representing the great majority of the firms listed in the Standard and Poors 500, NASDAQ 100 and main European indices. This dataset contains information about individual remuneration, and also allows us to construct measures of the size of individuals' networks of currently influential former colleagues. We show, first, that individuals with larger networks have substantially greater remuneration; furthermore, there is no difference between the extent of this raw correlation for men and for women.
To establish how much of this statistical association reflects the causal impact of networks rather than the fact that more talented individuals are likely to have been hired by similar firms, we use two methods, which we showed in our companion paper to deliver similar results. First, we control in turn for individual, firm and match fixed effects. This method is somewhat conservative in the sense that it may fail to capture true causal effects of networks on remuneration, if those have already worked their way through by the time individuals enter our dataset. Our estimates of the causal effects are therefore likely to be downward biased.
Our second method is one that does not throw away all cross-sectional information in the data in the way that fixed effects estimation does. Instead, it seeks to control for the systematic component of unobserved individual characteristics, by controlling for the kinds of other people that were employed in a given individual's firm in the past.
To do this, we construct placebo measures of people who were employed in the same firm at different times. These represent, for each individual, those individuals who could have been their colleagues but were not because they worked there at different times. If our correlational estimates of the impact of networks reflected only those talents unobserved by the econometrician but observed by employers, these placebo measures of could-have-been-colleagues should have a similar statistical impact on remuneration as our measures of actual colleagues.
As we explain below, there is no theoretical reason for the placebo measures to have a zero or even a small impact, and in fact, their impact is large. They represent an alternative measure of that part of the raw correlation between networks and remuneration that is due to unobserved individual heterogeneity. To the extent that some heterogeneity may not be easily observable by employers, our causal estimates might be upward biased. The true causal effect might therefore lie somewhere between these and the fixed effects estimates.
We then apply these methods to comparing the effect of networks on total annual compensation, and show that once the adjustment is made for unobserved individual characteristics, women's remuneration is significantly more weakly linked to their networks than is that of men. There appear to be two reasons for this. The first is due to the fact that, for both men and women, own-gender connections are significantly more valuable than other-gender connections, and men have more of these though they do not have more connections overall. A second reason appears to lie in the kinds of firms that are more likely to hire women in senior positions. We investigate the impact of networks in remuneration separately for firms that hire more senior women than the median in the sample, which we call ‘female-friendly’ firms (FFFs).
We find that such firms have larger boards and are more likely to recruit executives with Masters degrees and degrees in business. They reward networks less for all executives, not just for women, but they also pay all their (male and female) executives more, other things equal. One possibility is that such firms are more likely to employ recruitment methods that rely on objective criteria of talent and rely less on the use of contacts. However, the fact that there remain so few women in CEO positions indicates that this phenomenon is far from sufficiently widespread.
While our characterization of female-friendly firms does not identify which underlying characteristics of firms lead them to behave differently (we use observed hiring behavior as a proxy variable), by showing that firms above and below the median of senior female hires display a different manner of using networks for recruitment, we provide an argument for the use of more detailed survey and other investigations to uncover precisely how these differences are implemented. Such investigations will likely be more ethnographic and multi-disciplinary than the large-scale statistical approach we deploy in this paper.
The remainder of this paper is organized as follows. Section 2 summarizes the gender literature on the impact of networks on professional advancement. Section 3 provides information on the data set and the methodology used. Section 4 presents the results. Section 5 concludes.
2 The gender gap and women's networks
In spite of several decades of a substantial increase in women's participation in the labor force in industrialized countries, the representation of women in senior corporate positions remains extremely marginal, and the phenomenon of the ‘glass ceiling’ continues to puzzle researchers and lay commentators alike. While women make up 44.7% of total employees in S&P 500 companies, they hold 21.2% of board seats and represent only 5.8% of CEOs (Catalyst, Pyramid: Women in S&P 500 Companies, January 15, 2020). The under-representation of women among top earners helps explain a substantial share of the gender pay gap that is not explained by traditional factors (Fortin et al., Reference Fortin, Bell and Böhm2017).
Empirical studies have also shown that, even for those who reach the top, substantial gender differences in earnings still exist. Among the explanations, various authors have proposed a gender difference in rank and firm size (Bertrand and Hallock (Reference Bertrand and Hallock2001)), in area specialization (Smith et al. (Reference Smith, Smith and Verner2013), in exit rate (Gayle et al. (Reference Gayle, Golan and Miller2012)), in career interruptions (Bertrand et al. (Reference Bertrand, Goldin and Katz2010)), more generally in the preference for flexibility in employment (Goldin (Reference Goldin2014)), in the structure of compensation (Albanesi et al. (Reference Albanesi, Olivetti and Prados2015); Kulich et al. (Reference Kulich, Trojanowski, Ryan, Haslam and Renneboog2011)) and in the existence of discrimination (Selody (Reference Selody2011)).
Given that recruitment to board and top executive positions often takes place through an informal process, typically involving the role of both professional headhunters and word of mouth recommendations, the role of networks in accessing these high-paying positions could be important. While the association of such connections for individuals in top corporate positions with career advantages has been confirmed empirically by a number of studiesFootnote 1, the potential gender differential impact has been so far understudied. One exception is Allemand et al. (Reference Allemand, Bédard, Brullebaut and Deschênes2021), who explore the impact of incumbent directors' and CEOs' networks on the appointment of female directors. Given the much smaller gender gap in compensation and lower decision-making power for non-executive directors, an investigation on executives is very much needed.Footnote 2
One plausible explanation of a different effect of social networks on labor market outcomes for men and women is gendered social networks. The question whether men and women differ in the structure of their social networks has been investigated in the sociological and psychological literature but with little agreement about the extent of any systematic differences – see Seabright (Reference Seabright2012: Chapter 7), for an overview. Scholars have also had difficulty distinguishing between the relative importance of gender differences in preferences, as opposed to the difference in opportunities and constraints, for forming and using social connections (Moore (Reference Moore1990), Fischer and Oliker (Reference Fischer and Oliker1983)).
Nevertheless, there is suggestive evidence that women tend to rely relatively more on small social networks of strong relationships, while men tend to build larger groups with weaker types of relationship (Friebel and Seabright (Reference Friebel and Seabright2011), David-Barrett et al. (Reference David-Barrett, Rotkirch, Carney, Izquierdo, Krems, Townley, McDaniell, Byrne-Smith and Dunbar2015), Friebel et al. (Reference Friebel, Lalanne, Richter, Schwardmann and Seabright2021), Ductor et al. (Reference Ductor, Goyal and Prummer2020)). Following Granovetter (Reference Granovetter1973)'s ‘strength of weak ties’ argument according to which weak links are often more useful in the job search context, a greater number of such ties might help men get ahead compared to women. Because their greater ability to provide novel information outweighs their lesser motivation to provide support and help, weak links are more likely to be useful in situations of high uncertainty such as highly rewarding top corporate positions. This very same argument is advanced by Lindenlaub and Prummer (Reference Lindenlaub and Prummer2021): different network structures help in different contexts.
There is also evidence that homophily (a preference for interacting with similar others, such as others of the same sex – see McPherson et al. (Reference McPherson, Smith-Lovin and Cook2001)) plays a role. For instance, referrals appear to be gender biased in various labor contexts (Fernandez and Sosa (Reference Fernandez and Sosa2005), Beaman et al. (Reference Beaman, Keleher and Magruder2018), Zeltzer (Reference Zeltzer2020), Zhu (Reference Zhu2018)). Job search behavior of MBA students also reflects gender-homophilous networking; women primarily network with other women (Obukhova and Kleinbaum (Reference Obukhova and Kleinbaum2020)) and female MBA section peers influence women's promotions to top corporate positions (Hampole et al. (Reference Hampole, Truffa and Wong2021)). Homophily may then compound the effect of female underrepresentation, leading women's networks to differ from males' ones. If individuals prefer to refer individuals of their own gender, then male-dominated positions will keep being filled by males (Athey et al. (Reference Athey, Avery and Zemsky2000), Neugart and Zaharieva (Reference Neugart and Zaharieva2018), Fernandez and Rubineau (Reference Fernandez and Rubineau2019)). Women who have entered the ‘old boy network’ seem to benefit from it (Belliveau (Reference Belliveau2005), Agarwal et al. (Reference Agarwal, Qian, Reeb and Sing2016)).
However, Friebel et al. (Reference Friebel, Lalanne, Richter, Schwardmann and Seabright2021) show that apparent homophily in network structure may be the outcome of differences in male and female behavior toward those with whom they have interacted in the past without any conscious preference for interactions with the same gender. In a similar vein, a second strand of explanations rests, not on different network structures, but on different behaviors within networks. In a laboratory experiment, Mengel (Reference Mengel2020) finds that networks do display homophily but that males reward their contacts more than females. This may explain the presence of gender gaps in earnings and promotion. Similarly, in their field experiment in Malawi, Beaman et al. (Reference Beaman, Keleher and Magruder2018) observe that males systematically refer less females for hiring. Males seem to do so because they have poorer information about women's skills and receive more benefits from men. Cullen and Perez-Truglia (Reference Cullen and Perez-Truglia2019) show evidence of the existence of an ‘old boys’ club’ in a large financial institution: male employees benefit more than female employees from interacting with male managers. Despite useful insights, evidence on individuals holding the top corporate positions is still lacking.
Several studies based on interviews of top corporate individuals reveal that women appear lacking the relevant informal connections to access top positions (Linehan and Scullion (Reference Linehan and Scullion2008), Lyness and Thompson (Reference Lyness and Thompson2000), Metz and Tharenou (Reference Metz and Tharenou2001)) and reap lower benefits in terms of career outcomes from their social networks (Bu and Roy (Reference Bu and Roy2005), Tattersall and Keogh (Reference Tattersall and Keogh2006), Forret and Dougherty (Reference Forret and Dougherty2004)). Greguletz et al. (Reference Greguletz, Diehl and Kreutzer2019) confirm the existence of the above-mentioned mechanisms for 37 female leaders in German corporations: homophily (and the family career trade-off) help explain the structural exclusion of women from powerful networks and female hesitation to instrumentalize social ties results in lower benefits from networking. However, studies in this literature mainly rely on surveys (and are thus inevitably subjective). The surveys are also of relatively few individuals, most of the time from a single organization, which raises issues of representativeness. Our purpose in this paper is to use a substantially larger sample of individuals than has hitherto been possible.
Finally, our suggestive findings on ‘female-friendly firms’ are related to literature on the characteristics of well-managed and better-performing firms. Exploiting the introduction of gender board quotas, several studies find positive effects of the mandatory increase in female board representation on employment and total factor productivity (Matsa and Miller (Reference Matsa and Miller2013); Comi et al. (Reference Comi, Grasseni, Origo and Pagani2020)), on sales and labor costs reduction (Tyrefors et al. (Reference Tyrefors and Jansson2017)), and on the selection of qualified (female) board members (Bertrand et al. (Reference Bertrand, Black, Jensen and Lleras-Muney2019)) despite overall mixed evidence.Footnote 3 Chevrot-Bianco (Reference Chevrot-Bianco2021) shows that gender quotas interact with network-based board appointments; the share of connected directors among female new appointees doubles after the introduction of the gender board quota in Denmark in 2012. Flabbi et al. (Reference Flabbi, Macis, Moro and Schivardi2019) find that the interaction between female CEOs and the share of female workers has a positive impact on sales per employee.Footnote 4 Finally, Adusei and Sarpong-Danquah (Reference Adusei and Sarpong-Danquah2021) find a stronger relationship between measures of country-level institutional quality and the capital structure of microfinance institutions in the presence of more gender-diverse boards. This suggests that greater gender diversity has a positive impact on the quality of governance generally, albeit one that is complementary to the presence of other high-quality institutions.
There is, however, no clear consensus yet as to the impact of board gender quotas on firm value. Hwang et al. (Reference Hwang, Shivdasani and Simintzi2018) and Greene et al. (Reference Greene, Intintoli and Kahle2020) claim that appointments of women directors reduce firms' share value, while Gertsberg et al. (Reference Gertsberg, Intintoli and Kahle2021) dispute this. However, other dimensions of firm characteristics have also been examined. Bloom et al. (Reference Bloom, Kretschmer and Van Reenen2011) find that firms with a higher proportion of women in leadership positions and more skilled employees are more likely to implement family friendly policies. Moreover, the provision of such family friendly workplace practices is positively associated with better firm performance, but such positive correlation disappears once management quality is controlled for. Therefore, female-friendly and family friendly policies and better firm performance could simply be the joint product of unobserved management quality.Footnote 5
Similarly, our categorization of firms into female-friendly ones and non-female-friendly ones may be acting as a proxy for their recruitment strategy (the extent to which they use networks to hire executives). In fact, Galenianos et al. (Reference Galenianos2013) show that introducing firm heterogeneity in a labor market model with formal and informal search methods help explain the heterogeneity in the use of referrals by firms. In particular, he finds that high productivity firms will invest more in ‘increasing signal accuracy and use referrals to a lesser extent’, in line with empirical evidence on firm size (Holzer (Reference Holzer1987); Marsden (Reference Marsden1994a, Reference Marsden1994b)). Finally, and consistently with our results, Giannetti and Wang (Reference Giannetti and Wang2020) argue that ‘public attention to gender equality changes the way female directors are recruited’ for firms with a culture more sympathetic to gender equality. In particular, they find that connected men are less likely to be appointed, resulting in a higher female board representation.
3 Data and methodology
3.1 Data description
Our analysis is based on an original dataset describing the career history of nearly 27,000 executives of over 5,000 European and North American companies between 2000 and 2012 and for whom data on demographics, education, networks (of past and present colleagues), and career history are available.
These individuals are a subset of some 300,000 individuals in a larger database provided to us by BoardEx Ltd, a UK supplier of data to headhunting companies (we refer to the latter hereafter as the ‘source’ database). This larger database comprises current or past board members or senior executives of European and North American companies. For firms to be included in the BoardEx source database requires them to reach a market capitalization above 1 million USD. Once this threshold is reached, analysts at BoardEx start collecting data on the career history of top executives and board members working at such companies from their résumés and public sources.
The reasons why our analysis sample differs from the source sample are two-fold. First, we explicitly focus on executives, therefore discarding individuals who are non-executives or who alternate between the two positions. Executives and non-executive directors are two very different populations among the senior employees of a company; they have very different roles within the company and also very different remunerations. Non-executives typically work part-time and may often hold several directorships simultaneously.Footnote 6
The second reason why our sample differs from the source sample is that we need information on remuneration, which is often not available. We exclude private firms because they do not have to report the remuneration of top executivesFootnote 7. Additionally, as remuneration disclosure depends on regulation, we do not necessarily observe individuals' compensation for every year, even if the individual is working for the company.Footnote 8
We need information on remuneration for several years, because our econometric analysis uses fixed effects estimation, in order to control for unobservable characteristics of individuals. For instance, more talented, dynamic or energetic individuals might be able both to develop larger professional networks and to have higher compensation. Panel estimation can enable us to control for all such factors that have a constant impact on outcomes. But we use an unbalanced panel (one that does not have observations in all years for all individuals) in order to keep a reasonable number of individuals in the dataset (a particularly important consideration since we are studying women who constitute less than one-tenth of the sample).
Although in principle the limited availability of remuneration information might raise questions about the representativeness of our sample, the firms in our analysis samples represent the great majority of the firms in the following indexes: S&P 500, NASDAQ 100, FTSE 100, EUROTOP 100 and CAC 40, as can be seen in Table A1 in the Online Appendix.
The main originality of this dataset is that we also have information relevant to individuals' professional networks. It is important to clarify the characteristics of this information since they affect the inferences that can be drawn from our results. Ideally, in order to study the impact of top business people's professional networks on their career, in terms of remuneration or promotion, we would like to have information on their active contacts – those with whom they interact on at least an occasional basis. Many studies have conducted interviews and collected detailed information about a relatively small number of individuals and their active networks of contacts.Footnote 9 We do not have such data. Instead, we have information, based on matching individuals' résumés, about which other members of the BoardEx source database a given individual has overlapped with in the course of his or her career. This is effectively a list of ‘currently influential people’ with whom any given individual has had an opportunity to interact; whether that interaction has been actively pursued is evidently not something we are in a position to observe.
In what follows we use the variable name ‘Connections’ to refer to the number of members of the BoardEx source database with whom an individual in our dataset is recorded as having worked in the same firm in the same year.Footnote 10 In large firms, this does not imply that the individuals concerned worked together or even met; though it increases the probability that they did relative to two individuals in the dataset taken at random. Our variable is evidently not a measure of the total of an individual's past and present colleagues, just of those individuals who could have been colleagues and who have since become sufficiently influential to feature in the BoardEx database. In addition to measuring connections, we also construct a measure that weights connections by how recently they occurred and by how long they lasted. We call this measure ‘Weighted Connections’.Footnote 11
Our measure of individuals' career outcomes is the total annual compensation (whose definition is provided in Table A2 in the Online Appendix). Because individuals may have several jobs each year (for instance, one executive job and several directorship positions), we use the remuneration of the job with the highest total annual compensation (that we call the main job) to be sure to focus on the executive position of individuals.
3.2 Methodology
We want to understand whether social networks have an impact on individuals' career outcomes, in a way that differs between men and women. We regress our measure of individuals' remuneration on our measures of connections, and interact the connections variable with a dummy variable for gender, to test whether there is a different impact of networks on remuneration for women than for men.
However, there are a number of statistical difficulties with this procedure. First, there is a risk of simultaneity bias because of reverse causality. For example, while those individuals with more connections might as a result have higher remuneration, it might also be true that individuals changing employment in pursuit of higher remuneration thereby acquire a larger network of contacts. Instead of using connections as explanatory variables, we shall use in the analysis ‘Net connections’, derived by subtracting current colleagues from total connections.Footnote 12
More generally, however, there may be unobserved characteristics of individuals that determine both the size of their networks and the size of their remuneration. Suppose, for instance, that job mobility is related to entrepreneurial dynamism: then individuals who accumulate more connections through more frequent changes of job may also independently have the talent to earn higher compensation. Alternatively, suppose certain types of firms attract more talented individuals, who thereby accumulate more connections to other influential people even though it is their talent rather than their connections that is making them successful.
To deal with the problem of unobserved individual heterogeneity we use two different strategies, which give broadly similar results. The first (commonly used) strategy consists in using panel data estimation with fixed effects. These may be individual fixed effects, firm fixed effects or fixed effects for the each match between an individual and a firm. The second strategy (partially) addresses the concern that individual heterogeneity might not be fixed over time. It can also address a different concern, namely that the use of fixed effects may be too conservative as it discards potentially informative cross-sectional information and therefore cannot capture effects of networks that take place before individuals enter the dataset.Footnote 13 To do so we use an insight from the literature on treatment effects in medicine, where treatments are compared to the placebos that capture various components of the patient-doctor interaction without the administration of the chemical molecule under investigation.
The measure we call ‘Placebo Connections’ captures the various characteristics that individuals share with their contacts through being hired by the same employer, except for the fact of having been employed at the same time.Footnote 14 It is the fact of having been employed at the same time that is our equivalent of the impact of the chemical molecule under investigation, and we have no prior expectations about the impact of everything else involved in being hired by the same firm, which is what the placebo measures capture. For each individual we count all the people in the source database who worked in the same firms but at different times, without overlapping. If differences in individuals' connections were due just to their changing employer more frequently, or to the fact that more talented individuals were employed by certain firms, then placebo connections should be just as effective at explaining remuneration as connections.
There is no reason to expect placebo effects to be zero: they may be positive or negative, small or large. They capture the combined impact of everything involved in the treatment except the fact of consuming the particular chemical molecule under investigation. The impact of the molecule (known as the ‘treatment effect over placebo’) is defined by comparing the outcome for patients who receive the molecule plus everything else involved in the treatment, with those who receive everything else but not the molecule.
The difference between the coefficient on placebo connections and the coefficient on connections, therefore, captures as precisely as we believe possible the effect of proximity rather than selection on the strength of individuals' network connections. In what follows we compare specifications with various types of individual or firm fixed effects with specifications in which we include both connections and placebo connections, together with a large number of control variables but no individual or firm fixed effects. There are some nuances of difference but the overall picture seems to be broadly coherent using these different methods.Footnote 15
4 Results
4.1 Descriptive statistics
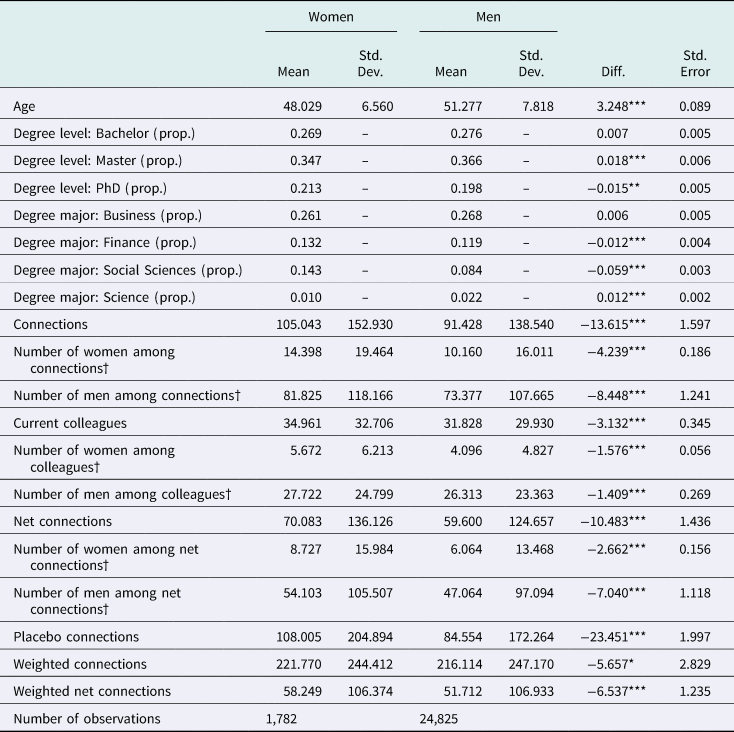
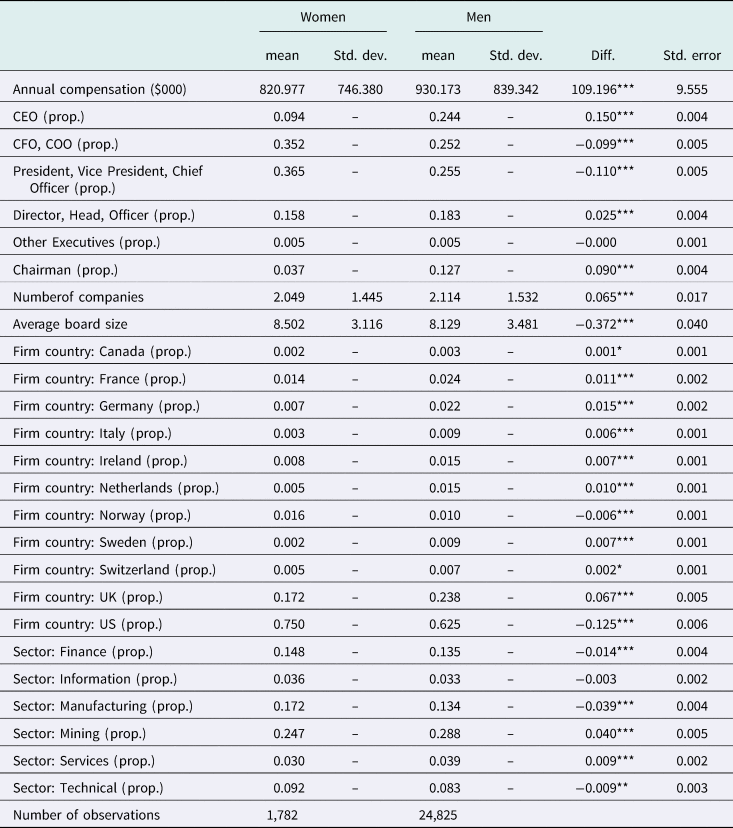
Full details of the characteristics of our sample are given in Tables 1 and 2. On average, executive women are 3 years younger than executive men (48.0 years old against 51.3 years old). Women's educational attainments slightly exceed those of men: they are a little more likely to hold a PhD compared to their male counterparts. The distribution of men's and women's degrees in business subjects are similar. Overall, the broad human capital of executive men and women does not seem very different among the individuals in our sample. Women's mobility, as measured by the number of firms they have worked for, seems also to be similar to that of men.
Human capital and network characteristics by gender

Statistics first averaged over years (within individuals) and then over individuals. †The gender of connections is not always available therefore the sum of female and male connections does not necessarily add up to the total number of connections. Definitions of network-related variables are provided in Table A2 in the Online Appendix. Statistical significance levels: + p < 0.10, *p < 0.05, **p < 0.01, ***p < 0.001.
Job and firm characteristics by gender

Statistics first averaged over years (within individuals) and then over individuals. Number of companies is the total number of different companies in which individuals have worked since the beginning of their career. Average board size is the average board size of the companies in which individuals have worked since the beginning of their career. Statistical significance levels: + p < 0.10, *p < 0.05, **p < 0.01, ***p < 0.001.
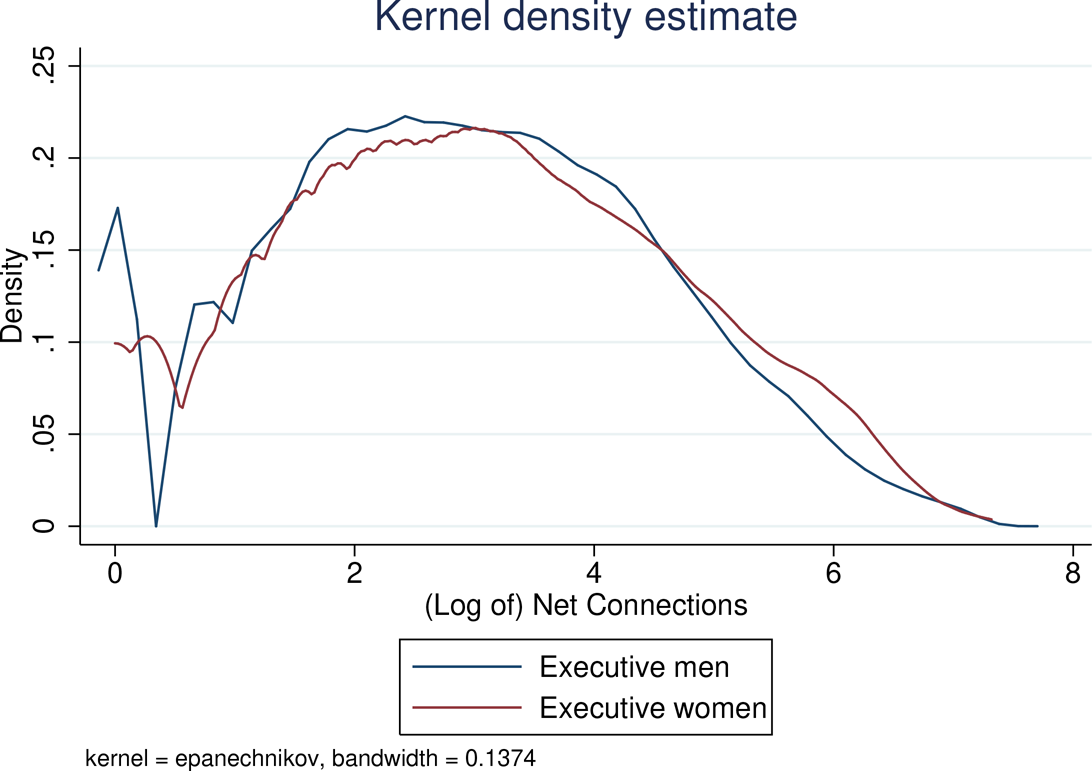
Our measure of connections reveal that women have somewhat more of these on average than men – 105.0 as against 91.4 (the same is true of the net connections we use in the regressions). As can be seen from Figure 1, the distribution shows a slightly fatter upper tail for women than for men. This may be related to the fact that women tend to work in somewhat larger firms (the average board size of firms in which women have worked is 8.5 against 8.1 for men). So women are clearly not at any disadvantage in terms of their overall number of connections. There is little perceptible homophily, in the sense that individuals identifiable as men represent 77% of women's net connections and 79% of men's.
Log of net connections by gender for executives.

Placebo connections, which represent the number of individuals who worked in the same firm but at a different moment in time, are quite different between men and women (the average figures are 108.0 and 84.6, for executive women and executive men respectively). This might be the result of women working for larger firms or firms with a higher executive labor force turnover.
There are striking differences in employment outcomes by gender. Only 6.7% of the sample are women. Executive women earned on average $821,000, while executive men earned on average $930,000.
In our sample, as has been previously found in the literature, executive women are very unlikely to hold senior positions with large decision-making power such as CEO or Chairman of the Board. 9.4% of our executive women hold CEO positions against 24.4% of the men (the figures for Chairman of the Board are 3.7% and 12.7% for women and men, respectively).
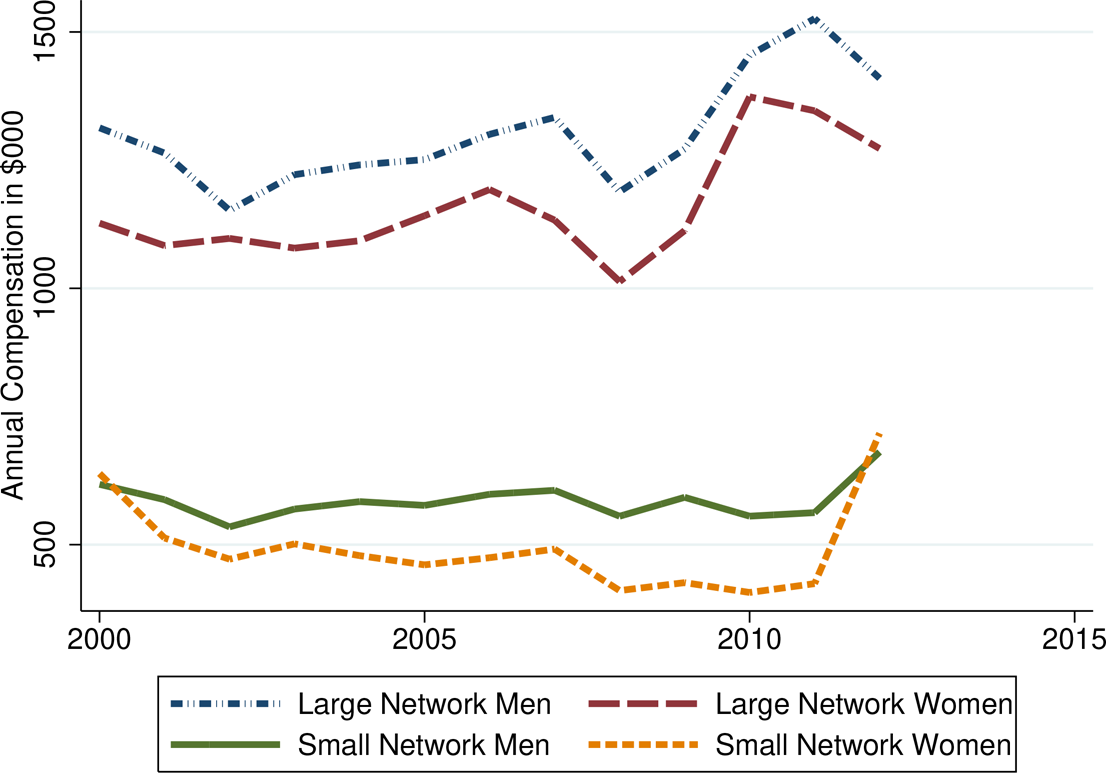
At a descriptive level, there is an equally striking association between network size and remuneration. This can be seen in Figure 2. We have divided the sample of individuals first by gender and second according to their network size, with ‘Large Network’ referring to those individuals who have weakly more than the median of the distribution of connections of all individuals, and ‘Small Network’ referring to those who have strictly less than the median. We plot the mean annual compensation for each year from 2000 to 2012.
Evolution of annual compensation by average network size and gender.

Two things stand out from this Figure. First, individuals with large networks earn more on average than individuals with small networks. Second, for a given size of the network, men appear to have a somewhat higher remuneration than comparable women, though not in all years. Understanding these patterns is the task of the next section.
4.2 Estimating the impact of networks on remuneration
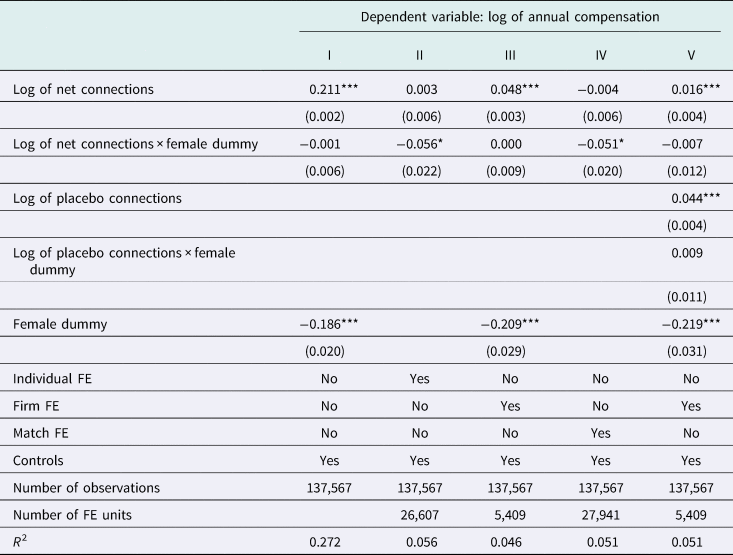
Table 3 confirms that, at the descriptive cross-sectional level, there is indeed a strong correlation between network size, as measured by net connections, and annual compensation. We report estimates for our panel which consists of 26,607 individuals working for a total of 5,409 firms. Specification I estimates an elasticity of 21.1% of compensation with respect to net connections; furthermore, there is a precisely zero estimate of the difference in this elasticity between men and women. This means that, for men at the mean of the sample, an increase of 14 (10%) in the number of connections in an individual's network is associated with an increase of 19,500 dollars (2,1%) in remuneration.Footnote 16
Impact of net connections on annual compensation

Robust standard errors in parentheses. Controls include a log of age, log of age squared, education (BA, MA, PHD, Business, Finance, Social Science and Science), country, sector and year dummies. Definitions of network-related variables are provided in Table A2 in the Online Appendix. Statistical significance levels: + p < 0.10, *p < 0.05, **p < 0.01, *** p < 0.001.
How much of this statistical association is indeed causal? Specification II of the table provides a conservative estimate by controlling for individual fixed effectsFootnote 17, and the answer is ‘none’. The causal elasticity estimated by this method is 0.3%, insignificantly different from zero. Intriguingly, however, the interaction of this with the gender dummy indicates that the estimate for women is significantly different (at the 1% level), and quite strongly negative, equal to −5.6%. In other words, women whose networks increase in size earn less than women whose networks do not.
Specification III investigates whether this difference between women and men may be due to their working for different types of firms. It uses firm fixed effects instead of individual fixed effects and finds an elasticity of 4.8% of annual compensation with respect to net connections. This allows us to say that around three-quarters of the cross-sectional association between network size and remuneration is due to the fact that executives with larger networks tend to work for better-paying firms, but we cannot say whether their networks help to get them jobs in these better-paying firms, or whether this is due to their other characteristics. And conditional on their firms, executives whose networks increase do see a modest increase in their remuneration.
Interestingly, the coefficient on the interaction with the gender dummy is now precisely zero, showing that, conditional on the firms they work for, men and women face no difference in the impact of network size on remuneration. Could it, therefore, be that there is something about the process by which executives are matched to firms that disfavors women with larger networks? Namely that women with larger networks tend to work for firms that are less likely to reward these networks? Specification IV suggests this may well be true, because conditional on the match between the executive and the firm, women once again have a negative coefficient.
In other words, a given female executive with a given employer will be likely to see a 5.1% lower elasticity of remuneration with respect to network size than an equivalent man. Note that, because we use year dummies, this does not mean that her compensation is falling. It is rather that, unlike for men, women whose networks are increasing in size are seeing their remuneration increasing more slowly than that of women whose networks are unchanged. Why might this be?
Before answering this question, note that Specification V in Table 3 provides an alternative estimate of the effect of the firms that executives have worked for by using measures of placebo networks; unlike firm fixed effects which control for the current employer, placebo networks control for characteristics of all previous employers. Here we again find no significant gender difference, though the causal impact of networks (given by the difference between the coefficients on net connections and on placebo connections) is no longer positive and now even slightly negative for all executives, yielding an elasticity of −2.8%.
In the Online Appendix, we report a number of robustness tests of these results. Table A3 shows that including a dummy variable for individuals who occupy the position of Chief Executive Officer does not change the qualitative characteristics of the coefficients in Table 3, although the CEO dummy itself has (unsurprisingly) a large and positive coefficient, varying between 31 percentage points and 64 percentage points of salary depending on the specification. So the explanation for those findings does not lie in the apparently greater difficulty women have in being appointed CEO. Whether they are CEO or not, women's networks appear to give them slightly less salary advantage than the networks of men. These conclusions are further reinforced by the findings of Table A4, which shows that the coefficients of interest remain qualitatively unchanged when controlling for a wide range of executive titles. Tables A5 and A6 also include a range of firm characteristics, both alone and in the presence of controls for executive status, without significantly altering the results.Footnote 18
The connections variable is built is such a way that it mechanically increases with the size of executives' teams and with their mobility across firms. To show that our connections variable captures a social effect beyond these two determinants, we include the average board size and the total number of companies in which individuals have worked as controls in Online Appendix Table A7. Our results are robust to this specification.
Online Appendix Table A8 tests the robustness of the specifications in Table 3 using connections weighted for a length of overlap and recentness. It shows again very similar findings. However, dropping connections older than five years (as shown in Online Appendix Table A9), does make a qualitative difference – the interaction with the female dummy variable is no longer significantly different from zero. This is important in that it suggests that, to the extent, there is a differential impact of women's networks on their remuneration than men's, this reflects networks earlier in their career.
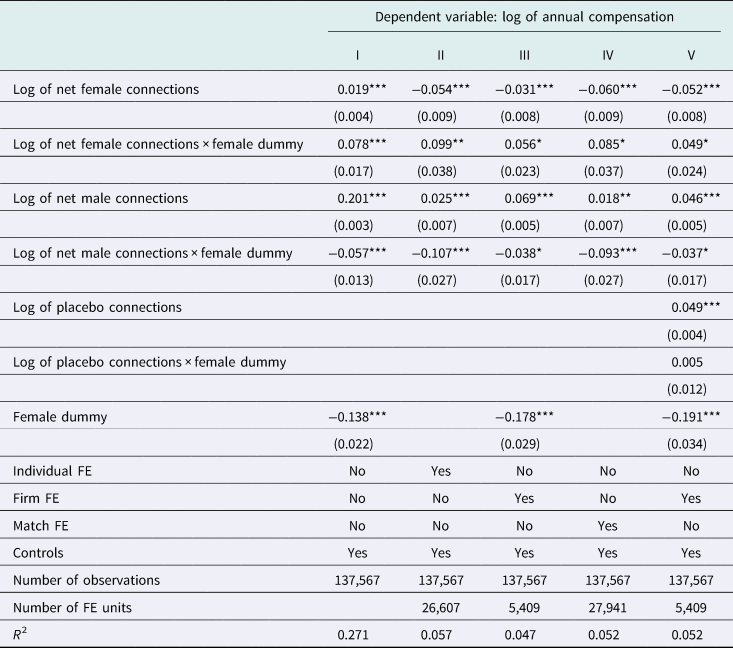
Further insight on this possibility is provided by the breakdown of networks by gender composition. Table 4 shows separately the effect of female and male connections separately, interacted with a female dummy so as to distinguish between the effects of female connections on males and females and the effects of male connections on males and females.Footnote 19 The same five specifications are used as in Table 3. What is really striking in these results is that, although the absolute value of the coefficient on both male and female connections varies substantially across the specifications (from as much as 20.1% without fixed effects to as little as 1.8% with match fixed effects for male connections), the difference between their value for men and for women is economically and statistically significant and much less variable across specifications. Female connections are more valuable for women than for men (by between 9.9 and 4.9 percentage points) while male connections are less valuable for women than for men (by between 10.7 and 3.7 percentage points). All these gender differences are statistically significant at least the 5 percent level.
Impact of same- and opposite-sex connections on annual compensation

Robust standard errors in parentheses. Controls include log of age, log of age squared, education (BA, MA, PHD, Business, Finance, Social Science and Science), country, sector and year dummies. Definitions of network-related variables are provided in Table A2 in the Online Appendix. Statistical significance levels: + p < 0.10, *p < 0.05, **p < 0.01, *** p < 0.001.
What does this imply? The value of male connections to men has an elasticity of around 2 percent in the specifications using individual or match fixed effects, and the value of female connections to women in these specifications is slightly higher, at between 2.5 and 4.5 percentage points. But the value of other-gender connections is negative, for both men and women. Men don't tend to have more male connections than women do, but these connections are much more useful to them. Why?
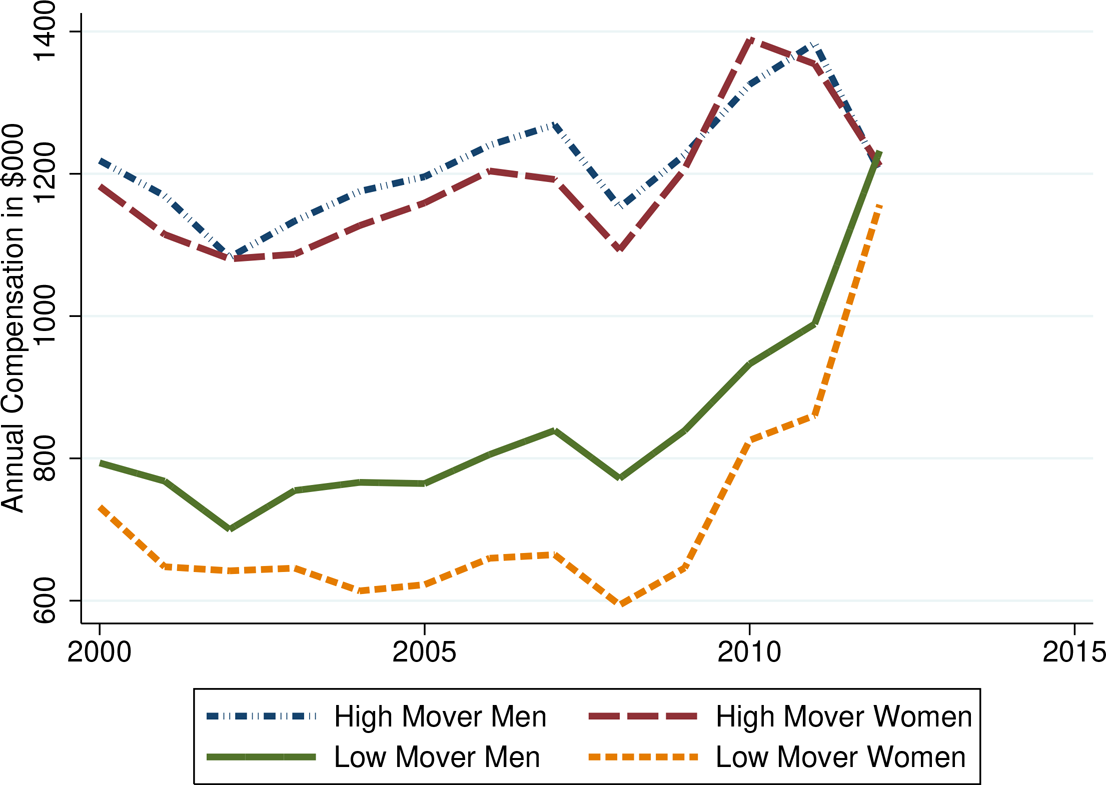
To answer this question we first want to understand of any sample of executives, male or female, why those whose networks increase in size might see lower remuneration. Two possible reasons suggest themselves: one is that increases in the size of individual networks might be associated with more frequent moving between firms, and this moving might expose executives to greater risk. Apart from the fact that it would be hard to explain why individuals should seek to move if moving were on average unfavorable to them, this hypothesis is contradicted by the findings of Berardi et al. (Reference Berardi, Lalanne and Seabright2019) who find a positive return to moving for executives on average. It is also inconsistent with Figure 3 which shows the equivalent of Figure 2, with the sample divided this time into individuals who have worked for more and less than the median number of previous companies in their career. We can see clearly that, for both men and women, individuals who have moved more often in their career have higher salaries in all years than those who have moved less often.
Evolution of annual compensation by average number of companies and gender.

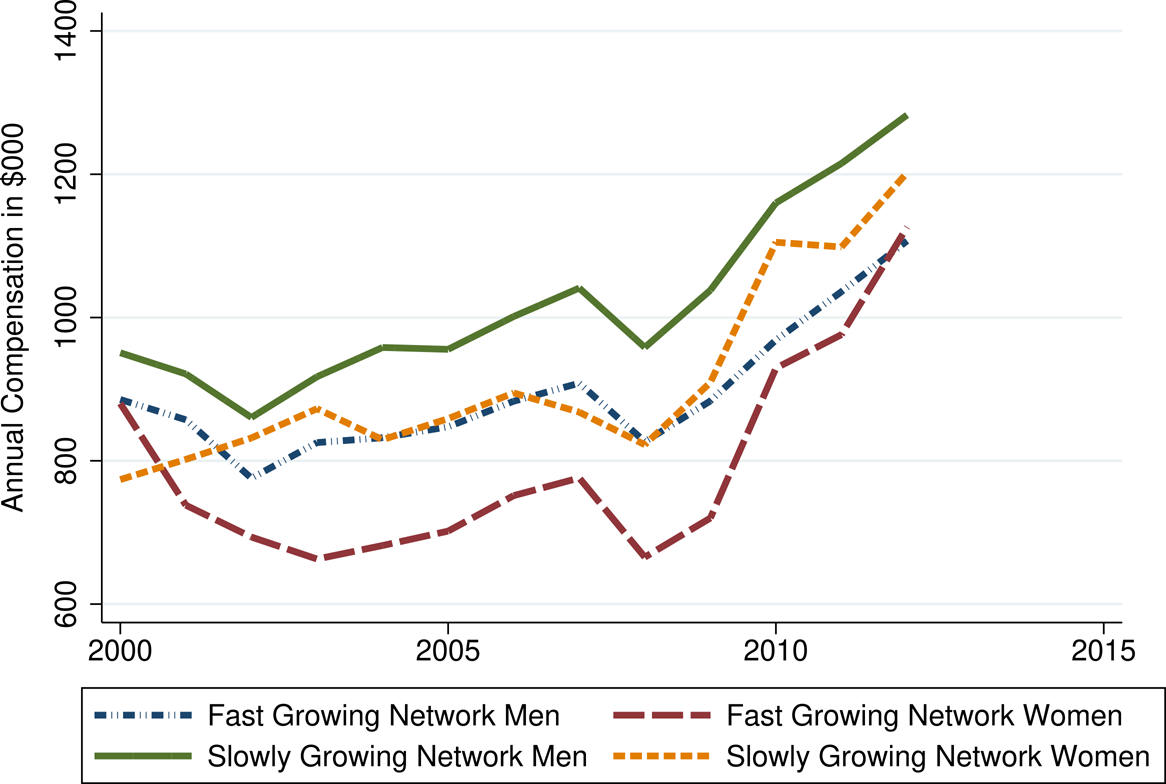
An alternative and more promising explanation for the phenomenon that executives whose networks increase in size are likely to see lower remuneration is that this reflects a selection effect. Executives whose networks increase in size over time may be those who have tended to work for firms that recruit less dynamic or entrepreneurial individuals – they might be larger, more bureaucratic or traditional firms. We don't have information on the detailed characteristics of firms that would allow us to test this – but we can separate our sample into executives whose networks increase faster over time and those whose networks increase more slowly over time. Figure 4 illustrates. It shows clearly that, for both men and women, being in the group of individuals whose net connections increase fastest over the 12-year period is associated with being paid less over the whole period (with the sole exception of the first year in the series, and only in the case of women). The gap does not increase notably over time, as might be expected if increasing networks had a negative causal effect on remuneration – it is relatively constant, suggesting that it reflects different characteristics on average in the two groups.
Evolution of annual compensation by net connections growth and gender.

However, this still does not explain why women apparently suffer more than men from this tendency for increases in network size to be associated with lower compensation. To investigate this we explore the possibility that there may be unobserved characteristics of firms that lead them to employ more women in senior positions, and then ask whether such unobserved characteristics are correlated with a different role of networks in influencing remuneration. Such unobserved characteristics might include features of management culture or deliberate policy. Since by definition they cannot be observed by us, we begin to address the question by first dividing our sample of firms into those that employ more and fewer senior women, and then compare the two sub-samples along other observable dimensions that might indicate the presence of relevant unobserved characteristics.
We call the subset of firms that employ a higher than the median proportion of women on the board and in the top management team Female-Friendly Firms (FFFs). This terminology is purely a matter of definition and for the time being implies nothing about whether the firms in question are ‘friendly’ to women in any other dimension than simply employing more of them. It should be noted also that this is not a matter of the sector of industry in which such firms operate (we control for this in all our regressions).
Tables A10 and A11 in the Online Appendix show that FFFs are indeed different from other firms. They pay more, have larger boards (with 9.9 members against 8.2) and employ executives with larger networks than do non-FFFs. They also employ more executives with Masters degrees and degrees in Business.
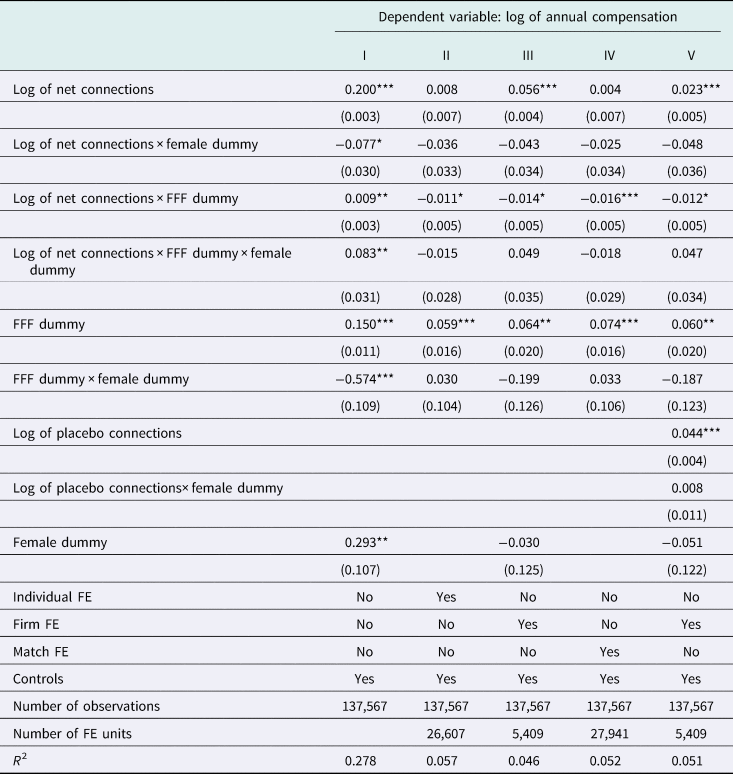
We examine whether FFFs reward networks differently for women, and what we find is very striking. Table 5 shows the same specifications as Table 3 but with interaction terms for FFFs. The most important column is Specification IV, which controls for match fixed effects. Here what we see is that FFFs do indeed reward networks substantially less than non-FFFs. But they do so for all employees, and not particularly for women (indeed the interactions with the gender dummy are insignificant in all cases). And furthermore, the coefficient for the FFF dummy is large and positive. This is not surprising since such firms tend to be larger. It is also important to note that the same broad finding holds true in the specification using placebo networks, indicating that it is not dependent on the particular method we use to control for unobserved individual heterogeneity.
Impact of net connections on annual compensation in Female Friendly Firms (FFF)

Robust standard errors in parentheses. Controls include log of age, log of age squared, education (BA, MA, PHD, Business, Finance, Social Science and Science), country, sector and year dummies. The FFF dummy is 1 for firms that employ a higher than median proportion of women on the board and in the top management team and 0 otherwise. Definitions of network-related variables are provided in Table A2. Statistical significance levels: + p < 0.10, *p < 0.05, **p < 0.01, *** p < 0.001.
Here, therefore, is a plausible explanation for the apparent tendency of firms to discriminate against women with larger networks. On average firms do not do this; instead, firms vary according to a set of characteristics that are correlated with size and the proportion of their executives with business degrees. Larger firms tend to pay more and to recruit using methods that give less weight to contacts than to objective search criteria; neither the men nor the women who work for them are rewarded for having large networks per se. Not surprisingly, once such criteria are employed the proportion of women recruited at the top levels of the firm tends to increase, albeit from a low level.
5 Discussion and conclusions
The findings reported here suggest that, for women as for men, much of the large correlation between the size of professional networks and career advancement reflects unobservable individual characteristics: individuals with the talents required for professional advancement tend also to have large networks of professional contacts. However, before concluding that there is no truth in the popular saying that ‘who you know’ matters more than ‘what you know’ for professional success, we need to bear in mind that our dataset covers executives who are already quite established in their careers. We cannot rule out that the main impact of networks occurs much earlier in most executives' careers, before they become successful enough to make an appearance in the Boardex database.
Nevertheless, even after they appear in the database, connections may nevertheless have a small positive causal impact on career progression for men. This effect appears to be significantly weaker for executive women than for executive men, a discrepancy that is greater for connections formed earlier in their careers. It is also reinforced by the fact that own-gender connections are more valuable for both men and women, and men have more of them than women do.
To the extent that there is apparent discrimination against women with larger networks, part of the answer appears to be due to a composition effect, in which firms we term ‘female friendly’ recruit using more objective methods. These firms are larger, reward networks less than other firms, pay all executives more (male and female), and recruit more women. Thus executive women are disproportionately likely to work in firms that reward their networks less, but since these are better firms to work in they are not thereby disadvantaged.
Investigating what it is about the nature of Female Friendly Firms seems to us an important subject for future research – although we are confident that these firms behave differently from others, our conjectures about the exact mechanism remain speculative at this stage.
We cannot, of course, exclude the possibility that networks function differently for men and women in other ways. They may be differently structured, or have other characteristics that our simple measures of connections do not describe. This too remains an important avenue for further research.
Supplementary material
The supplementary material for this article can be found at https://doi.org/10.1017/S1744137421000953.
Acknowledgements
We are grateful to BoardEx Ltd for the supply of our data, and to Victoria Derkach, Irina Waibel, Chris Try and the late Richard Taylor for making that possible. Nicoletta Berardi, Sebastian Kohls and Ying-Lei Toh worked hard and generously with us on cleaning the data. Thierry Mayer first gave us the idea of using placebo network measures. We had very valuable discussions with Suzanne Scotchmer a few months before her untimely death. We would like to thank all these people, and also Bina Agarwal, Samuele Centorrino, Anna Dreber, Guido Friebel, Yinghua He, Astrid Hopfensitz, Thibault Laurent, Thierry Magnac, Nicolas Pistolesi, Mirjam van Praag, Marie-Claire Villeval, and seminar audiences in Berkeley, Gothenburg, New Delhi, Oslo, Rome, Santiago and Toulouse for very valuable comments and advice. Paul Seabright acknowledges IAST funding from the French National Research Agency (ANR) under the Investments for the Future (Investissements d'Avenir) program, grant ANR-17-EURE-0010. Marie Lalanne acknowledges funding and from the Research Center SAFE, funded by the State of Hessen initiative for research LOEWE. The usual disclaimer applies.