The distinction between core and swing voters is fundamental to understanding basic electoral dynamics related to campaign strategies, elite persuasion and electoral outcomes in democracies. Yet while considerable effort has been devoted to conceptualizing core and swing groups in mature democracies, this question has received less attention in emerging democracies, particularly in Africa. The lack of scholarship may stem from the view that in contexts where ethnicity is politically salient, as it is in much of Africa, few voters will be available for persuasion and conversion during campaigns. Yet the lack of attention may also stem from methodological limitations. Nearly all of the observational research on political behavior in Africa’s emerging multi-ethnic democracies relies on data from cross-sectional studies or aggregate election returns – data that is poorly suited for examining preference change during campaigns. As a result, scholars know very little about the volatility of voting intentions during campaigns or the factors that may make some voters more ‘up for grabs’ at the start of the race.
Much of the existing research on political behavior in multi-ethnic settings suggests that swing voters do not exist in diverse societies either because ethnicity creates intense partisan bonds that make voters resistant to changeFootnote 1 or because voters are immune to elite persuasion, and rely instead on candidates’ ethnic identities and the broader ethnic profiles of the competing parties to form preferences.Footnote 2 In contrast, I argue that even in settings where ethnicity is highly salient, electoral preferences may be more fluid than commonly assumed, and that ethnic identities play an important role in structuring core and swing. I draw on instrumental theories of ethnic voting that highlight voters’ desire to secure access to state-controlled benefits and the use of ethnic cues to form expectations about the future behavior of alternative candidates.Footnote 3 I extend this literature by arguing that the informational value of ethnic cues varies across ethnic communities, and I examine the implications of this variation for preference change during campaigns. Specifically, I propose that elite cues are more informative for voters from groups that have a co-ethnic leader in the race. These voters typically face little uncertainty about which party or candidate will best look after their group’s interests. Members of groups that do not have a co-ethnic in the race confront greater uncertainty at the start of the race, and as a result are potentially more willing to update their beliefs about which candidate or party will best represent their community’s interests during the course of the campaign.
To test this proposition, I examine changes in voting intentions during the campaigns that preceded Kenya’s 2013 presidential election. Kenya provides an excellent setting for investigating how ethnicity structures core and swing voters both because ethnicity is highly salient to politics and because in presidential elections some ethnic communities invariably have co-ethnic leaders in the race while others do not. Moreover, Kenya provides a tough case for this investigation: as the result of a long history of ethnic contestation and conflict, including a period of severe inter-communal violence following the 2007 election, ethnic political attachments are deeply engrained in Kenya, potentially limiting the extent to which voting intentions will change over time. To the extent that electoral preferences are fluid in this context, they should also be fluid in other multi-ethnic settings where ethno-partisan attachments are less intense.
Drawing on a two-wave panel study conducted prior to the 2013 presidential election, the analysis shows that a surprisingly large share of Kenyans – nearly 20 per cent – changed their stated preferences during the campaign period. In line with expectations, I demonstrate that voters from groups without a co-ethnic in the race were more than two and a half times more likely to change their vote than those with a co-ethnic in the race (24.4 per cent vs. 9.5 per cent). And, consistent with the argument outlined below, the analysis shows that changes in voting intentions occur when individual voters update their beliefs about how well the alternative candidates will serve the interests of their ethnic community.
This article makes three contributions to the study of political behavior in multi-ethnic societies. First, it advances an approach to defining core and swing groups that departs from the American and comparative literatures on swing voters. Studies of the US electorate tend to privilege individual attributes, such as political engagement and interest or ideological orientations, over social identities when theorizing who is likely to be most responsive to campaign influence.Footnote 4 In contrast, the account offered here shows that in settings where ethnicity is politically salient, social identities are likely to play an important role in differentiating core and swing voters.Footnote 5 The comparative ethnic politics literature has made considerable progress in unpacking the link between ethnicity and vote choice, but has thus far devoted less attention to understanding changes in electoral preferences over time.
Secondly, the article adds to the growing scholarship on campaigns and their effects in multi-ethnic settings.Footnote 6 The findings presented in this article show that electoral preferences may be more fluid than much of the existing literature suggests, and that campaigns may have consequential effects even where ethnicity is salient. Finally, the argument developed here has implications for theories of elite behavior. Scholars have long been concerned that the introduction of democratic competition in multi-ethnic societies may give rise to electoral strategies that polarize the electorate and increase the risk of intergroup violence. It is the absence of swing voters, by some accounts, that makes persuasion futile and leads parties to embrace divisive ethnic appeals.Footnote 7 In contrast, the argument offered here implies that investing in campaign persuasion is not a fool’s errand, and that if candidates and parties seek to increase their support during the campaign they should target voters outside their core ethnic support bases, pursuing voters from groups that do not have a co-ethnic in the race.Footnote 8
SWING VOTERS IN AFRICA’S MULTIETHNIC DEMOCRACIES
The existing literature on political behavior in multi-ethnic democracies suggests that there will be few swing voters in settings where ethnicity is salient. Donald Horowitz, for example, proposes that, ‘what is uncertain is not how a voter will vote […] all that is uncertain is whether a potential voter will vote’.Footnote 9 This conclusion is based on a view that ethnicity creates intense psychological bonds that incline voters to support co-ethnic leaders for expressive reasons – to affirm the status of one’s group within the polity. In the decades since Horowitz’s foundational contribution, the ethnic politics literature has moved away from emphasizing expressive motivations as the source of ethnic voting, pointing instead to instrumental goals and a reliance on ethnic cues. There is now a broad consensus that in settings where voters seek to secure favorable access to state-controlled resources, ethnicity serves as a cue that informs electoral preferences through the information it conveys about how alternative candidates are likely to behave in office – which groups they will favor and which they will disfavor.Footnote 10
Two assumptions are common in the recent ethnic politics literature. The first is that ethnic cues will be equally informative for voters from all ethnic communities. Chandra, in particular, develops a framework by which voters form preferences across parties by ‘counting heads’ of co-ethnic leaders arrayed across competing parties, a model that suggests no variation in the informational value of ethnic cues.Footnote 11 The second assumption is that other sources of information, particularly elite rhetoric, will have little effect on voters’ beliefs about the parties’ favoritism intentions. Posner, for example, argues that pledges to share resources across group lines lack credibility and are dismissed as cheap talk.Footnote 12 Chandra likewise claims that voters discount elite rhetoric, suggesting instead that the most credible signal of a party’s intentions is ‘not what it says, but who it is’ – a view that leaves little room for campaign effects.Footnote 13 And, while Ferree argues that campaigns may have more consequential effects on vote choice, her research in South Africa finds little evidence that campaigns matter.Footnote 14 Taken together, these works imply that the information conveyed through elite cues should leave few voters uncertain at the start of the race, and that elite attempts at persuasion during the campaign should have little effect.Footnote 15
The argument offered here departs from the existing literature by proposing that voter preferences may be more fluid than prior work implies, and that the extent to which preferences change over time should vary across communities in systematic ways. I propose that ethnic cues provide a stronger signal for voters from groups that have a co-ethnic leader in the race, and as a result, these voters will be less likely to be swayed by the parties’ various attempts at persuasion during campaigns.Footnote 16
Why should ethnic cues be more informative for voters from groups that have a co-ethnic leader in the race? The reason is that in African democracies political institutions concentrate decision-making power in the office of the chief executive (most countries are presidential regimes). Historically, chief executives across the continent have enjoyed high levels of discretion over all decisions, including distributive allocations.Footnote 17 Despite two decades of political liberalization since the early 1990s, chief executives remain relatively unconstrained in their ability to control policy making and implementation.Footnote 18 The strength of presidential power means that the president determines how myriad benefits – money for roads, schools and clinics; jobs in the bureaucracy; scholarships for university and so on – are distributed across ethnic communities. There is abundant evidence, moreover, that political leaders in many African countries have used these discretionary powers to favor core political clientele, including co-ethnic supporters.Footnote 19
Given the concentration of power in the hands of the chief executive, voters look above all to the ethnic identities of the presidential candidates to form expectations about which group(s) each leader will favor if elected. The identities of lower-level actors within parties are less informative simply because such actors exert less control over patronage allocations. In line with this logic, Posner observes that in Zambia, ‘the overwhelming tendency is for voters to ignore the vice presidents, secretaries general, and party chairpersons […] and to draw their inferences about the party’s patronage orientations from the ethnic background of its top leader’.Footnote 20 Likewise, in Kenya voters look above all to the ethnic identity of the presidential aspirants for information about future patronage dynamics. Haugerud, for example, reports that, ‘Kenyans I talked with in both town and countryside in mid-1993 discussed the nation’s political future in explicit ethnic and regional terms, and assumed that the ethnic identity of a new president would define patterns of favoritism.’Footnote 21
Voters from groups that do not have a co-ethnic leader in the presidential race often make up a sizable share of the electorate in African elections.Footnote 22 These voters may rely on ethnic cues to form expectations about which candidate will best represent their group’s interests by examining which party includes more co-ethnic leaders in senior positions.Footnote 23 Yet because lower-level actors within parties often have less influence on distributive decisions after the election, the ethnic identity of lower-level actors provides less information about the future behavior of the party’s presidential nominee, relative to the ethnicity of the top candidates.Footnote 24 As a result, voters from groups that do not have a co-ethnic in the race should, on average, be less certain at the start of the race about which of the alternative parties or candidates will best serve their group’s interests. These voters will therefore hold weaker initial preferences and will be more likely to update their voting intentions during the campaign period than voters from groups that have a co-ethnic in the race.
How might campaigns alter voting intentions? The argument here does not make specific claims about the channels through which campaigns affect preferences. Rather, it treats the campaigns as a bundle of activities that includes rallies, household canvasing, media reporting, public deliberation and so forth. A large body of literature from a variety of contexts provides evidence that these aspects of the campaign can influence attitudes and preferences.Footnote 25 In Africa’s emerging democracies, campaigning is mainly done through public rallies and grassroots contact, rather than paid media advertising. Existing studies demonstrate that during campaigns, parties seek to alter voters’ beliefs about their favoritism intentions (and those of their rivals) in advantageous ways.Footnote 26 I propose that it is the greater receptivity to these various aspects of the campaign that makes voters from groups without a co-ethnic in the race the swing.
BACKGROUND: KENYA’S 2013 PRESIDENTIAL ELECTION
Two features of the Kenyan context make it well suited for an examination of how ethnicity structures core and swing groups. First, a long history of ethnic favoritism by successive post-independence leaders means that instrumental theories of ethnic voting are likely to be relevant. Several studies demonstrate that ethnic favoritism has been at the heart of politics since independence.Footnote 27 Groups that have co-ethnic leaders in top government positions – above all the presidency – are thought to enjoy numerous benefits, while others are left out. Existing quantitative studies of resource distribution lend support to these notions.Footnote 28 While some research suggests that the extent of ethnic favoritism has declined since the return to multiparty politics in 1992,Footnote 29 survey data indicate that Kenyans continue to expect ethnic favoritism from elected leaders. My own survey data from the 2013 election (described below) shows that in response to a question about how often government leaders favor their own ethnic groups, an overwhelming majority (83 per cent) said ‘almost always’ or ‘some of the time’; only a small share replied ‘rarely’ or ‘never.’
A second feature of the Kenyan context is that, like most African countries, it is highly diverse. The largest ethnic group, the Kikuyu, make up only about 17 per cent of the overall population, according to the 2009 census. The high level of diversity means that some ethnic communities invariably have co-ethnic leaders in presidential contests and others do not. It also means that, as in other parts of the continent, constructing multi-ethnic electoral coalitions is central to electoral competition.Footnote 30 Prior to each election cycle, elite bargaining often takes center stage, as senior political leaders seek advantageous alliances with top leaders from other ethnic communities, who are in turn expected to bring a reserve of support from their own community in exchange for positions on the ticket. Since the return to multiparty elections in 1992, elite coalitions have been exceptionally fluid in Kenya; alliances are often made and remade between election cycles, creating a high level of volatility in the party system. The personalistic nature of the Kenyan party system means that voters are particularly attuned to the information conveyed by elite cues.
The 2013 presidential election was a contest between two main competitors. Uhuru Kenyatta (a Kikuyu) headed the Jubilee Alliance which brought together his own party, the National Alliance, with the United Republican Party, headed by William Ruto (a Kalenjin). The main opponent was the Coalition for Reforms and Democracy (CORD), headed by Raila Odinga (a Luo), which brought together the Orange Democratic Movement (ODM), a party that Odinga had led since the 2007 election, and the Wiper Democratic Movement, headed by Kalonzo Musyoka (a Kamba). A number of minor candidates – most notably Musalia Mudavadi of the United Democratic Forum (UDF) – also stood in the election. The official election results, while contested by the ODM, gave Kenyatta the victory with 50.5 per cent of the popular vote, compared to 43.7 per cent for Odinga and 4 per cent for Mudavadi.
Data from the first round of the panel survey described below demonstrates the ethnic character of the opposing coalitions. While ethnicity was not a perfect predictor of voting preferences, most Kikuyus (89 per cent) and Kalenjins (81 per cent) indicated an intention to vote for Kenyatta at the start of the race, and most Luos (95 per cent) and Kambas (77 per cent) expressed an intention to vote for Odinga.Footnote 31 Among other major ethnic groups, most Merus and Embus (84 per cent), two closely related groups to the Kikuyu, supported Kenyatta, and most Mijikenda (78 per cent) expressed an intention to vote for Odinga. Preferences were more mixed among Kisiis and Luhyas, with 65 per cent of each group indicating an intention to support Odinga.
In their efforts to shape popular perceptions of their favoritism intentions during the campaigns, the parties relied on both appeals that directly referenced communal interests and more subtle appeals that implicitly referenced ethnic interests, often by using location as a proxy of ethnicity. Throughout the campaign, Odinga, the CORD leader, made targeted appeals to specific communities, promising to address land grievances, deliver title deeds, improve access to credit, or improve local infrastructure and employment opportunities for particular groups.Footnote 32 While such appeals sometimes employed subtle or implicit references to ethnicity, in other cases they were more explicit. For example, speaking in a Kalenjin area (a Jubilee stronghold), Odinga made a direct appeal to communal interests, saying ‘I want to assure the Kipsisgis [a sub-tribe of the Kalenjin] community that the Raila Odinga they voted for in 2007 has not changed and will never turn his back on them.’Footnote 33 At the same rally, Musyoka, CORD’s nominee for the vice presidency, said, ‘I have enjoyed a cordial relationship with this community since the time of President Moi, and I now urge you to count on me as your representative in CORD.’ Likewise, Kenyatta, the Jubilee leader, used similar rhetoric to appeal to group interests, promising, for example, to address group injustices related to land in the Rift Valley and on the coast.Footnote 34
Presidential rallies were complemented by local rallies held by lower-level candidates for governor, senate, parliament and council positions, as well as door-to-door campaigning by village-level party agents. Data from the second round of the panel survey (described below) indicate the extensive reach of the parties’ campaign activities. An estimated 42 per cent of Kenyans attended one or more campaign rallies; 9.5 per cent were contacted in their homes by party agents during the campaign; and 4.3 per cent received text messages encouraging them to vote for a particular party or candidate prior to the election.Footnote 35
DATA: A PANEL STUDY OF PREFERENCE CHANGE
The analysis draws on survey data collected from a nationwide panel study conducted prior to the election, timed to correspond as closely as possible with the beginning and end of the main period of campaigning, the three months before the election. The first wave was conducted at the start of the campaign period, just after the main coalitions, Jubilee and CORD, formed in early December 2012. The second wave was conducted shortly before the 4 March 2013 election.Footnote 36 The survey team succeeded in re-interviewing 829 of the 1,246 (67 per cent) individuals who were included in the first round. All analysis employs inverse propensity weights to reduce attrition bias on observables (the Appendix provides details on the weighting procedure) following the methods developed by Fitzgerald, Gottschalk and Moffitt.Footnote 37 North Eastern province, which contains less than 1 per cent of the Kenyan population (2009 census), was excluded from the survey because of security concerns and the difficultly of reaching the nomadic communities that inhabit some parts of the province.
In the analysis that follows I treat two communities – the Kikuyu and Luo – as core groups that had viable co-ethnic leaders in the presidential race. All other groups are treated as the potential swing. Several considerations are relevant to this coding decision. First, it is important to note that Kenyatta and Odinga were not the only candidates in the race. The ballot also included a Somali (Mohamed Dida), a Maasai (James Kiyiapi) and a Luhya (Musalia Mudavadi). Yet it hardly makes sense to consider the Somalis, Maasais and Luhyas as core groups, because it was well understood prior to the start of the campaign that these candidates were not viable contenders.Footnote 38 Likewise, the ballot also included three Kikuyu candidates in addition to Kenyatta (Martha Karua, Paul Muite and Peter Kenneth). Again, however, it was well known at the start of the race that these candidates were not serious contenders. For these reasons, it is sensible to treat the election as a contest between Kenyatta and Odinga, and therefore to view their respective communities as the core groups in 2013.
Secondly, I treat the Kalenjin and Kamba as swing groups, despite the fact that both had co-ethnic leaders as vice presidential nominees for the two leading parties. While there is good reason to think that the ethnic identity of vice presidential nominees should provide a strong signal of the ethnic intentions of the leading candidates, much like the identity of the presidential candidates, it is important to note that the office of the vice president in Kenya has historically been relatively weak, with decision-making power concentrated in the office of the president.Footnote 39 Moreover, previous vice presidents, particularly Moody Awori (2003–08), and Musalia Mudavadi (2002–03) had been seen as poor representatives of their ethnic community, the Luhya.Footnote 40 For these reasons, the ethnicity of the vice president is a weak signal, relative to the ethnicity of the presidential candidates. Further, the particular elite alliances that emerged in the 2013 race were not natural combinations with respect to past intergroup dynamics.Footnote 41 For much of Kenya’s post-independence history, Kikuyus and Kalenjins have been adversaries rather than allies, competing for control of the state and locked in conflict over access to land in the Rift Valley. Likewise, in the multiparty era since 1992 the Luo and Kamba have often fallen on opposing sides of the ethno-partisan divide. Moreover, data from the first round of the panel survey show that at the start of the race, the extent of bloc voting was lower in both of the vice presidential nominees’ communities than in the presidential candidates’ own groups.Footnote 42 As a result, a central task for both vice presidential nominees – Ruto and Musyoka – during the campaign was to persuade their respective communities to support the allied presidential aspirant.Footnote 43 There is therefore considerable justification for treating the Kalenjin and Kamba as swing groups. Nonetheless, to allay concerns that the key results presented below could be driven by this coding decision, I show that the results are robust to defining the Kamba and Kalenjin as core groups rather than swing.
THE EFFECTS OF HAVING A CO-ETHNIC IN THE RACE ON INITIAL ATTITUDES
The analysis proceeds in three steps. First, in this section I demonstrate that having a co-ethnic in the race affects basic attitudes and orientations at the start of the campaign. In the next section, I examine how having a co-ethnic in the race affects the likelihood of changing one’s preferences during the campaign period. Third, I explore the link between beliefs about the candidates’ favoritism intentions and preference changes.
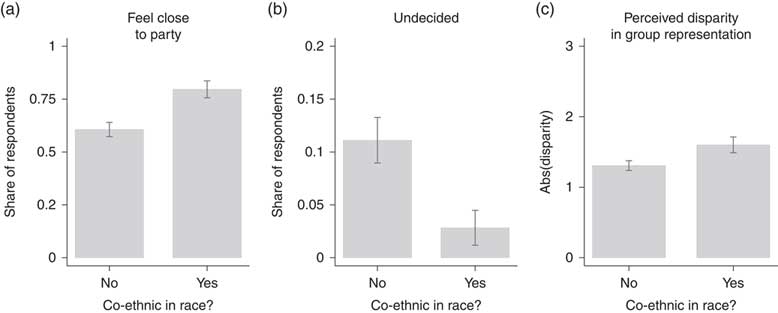
To explore how having a co-ethnic in the race affects initial preferences, I examine responses to three questions from the first survey wave that gauge the strength of partisan affinities, uncertainty about vote choice and beliefs about how well the competing candidates would represent voters’ ethnic interests. The online appendix includes details on question wording for all survey measures. The first measure comes from a standard question that asked respondents whether they felt close to any particular party. The second measure is the share of respondents that reported being undecided in response to a question that asked who they would vote for if the election were between the two leading candidates, Kenyatta and Odinga.Footnote 44 The third measure examines the perceived gap between the two leading candidates regarding how well each would represent the interests of respondents’ ethnic groups. For this, I draw on a question that asked, ‘How well do you think each of the following candidates would represent the interests of your ethnic group if elected: very well, somewhat well, not well, or not at all?’ The disparity in beliefs is measured as the absolute value of responses for Kenyatta minus those for Odinga. This measure ranges from a minimum of zero for a respondent who thought both candidates would represent their community’s interests equally well to three for someone who thought that one leader would represent her group’s interests ‘very well’ and the other ‘not at all.’
Figure 1 shows that having a co-ethnic in the race is associated with substantively meaningful differences on all three measures. With regard to partisan affinity, those without a co-ethnic in the race were less likely to feel close to a political party (61 per cent vs. 80 per cent, p<0.001). They were more likely to be undecided between the two leading candidates (11.1 per cent vs. 2.8 per cent, p<0.001), and they saw a smaller disparity, on average, between the two leading candidates regarding group representation (1.31 vs. 1.60 on a three-point scale, p<0.001).Footnote 45 In sum, voters from groups that did not have a co-ethnic in the race were less likely to feel close to a party, more likely to be uncertain at the start of the race, and less likely to perceive a large disparity between the leading candidates with regard to how well the two would represent their group’s interests. For all of these reasons, such voters should be more likely to switch their voting intentions as a result of campaign persuasion and other related influences during the campaign.
Initial attitudes and beliefs Notes: data come from the first survey round. (a) shows the share of respondents that reported feeling close to a party; (b) shows the share that said they did not know who they would vote for if the election were between the two frontrunners, Kenyatta and Odinga; and (c) shows the average disparity in beliefs about how well the two leading candidates would represent respondents’ ethnic interests, calculated as the absolute value of beliefs about Kenyatta minus Odinga.

PREFERENCE CHANGE DURING THE CAMPAIGN
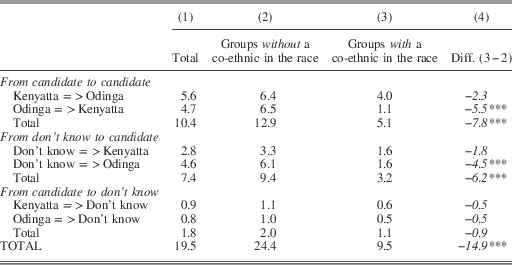
To examine preference changes during the campaign period, Table 1 presents voting intentions across the two survey waves.Footnote 46 It shows that 19.5 per cent of respondents updated their preferences during the campaign. It is interesting to note that the overall magnitude of preference change is similar to that found in studies of older democracies.Footnote 47 While some of this movement (7.4 per cent) can be attributed to respondents who were initially uncertain making up their minds, a larger portion (10.4 per cent) is comprised of respondents who switched candidates. Specifically, regarding movement between the two leading candidates, the data show that an estimated 5.6 per cent of respondents shifted from supporting Kenyatta in round 1 to Odinga in round 2, while a similar share (4.7 per cent) shifted in the opposite direction.Footnote 48
Changes in Vote Intention (percentages)

Note: difference-in-mean estimates in Column 4 are based on t-tests using weighted data to account for attrition between rounds (see Appendix for weighting procedures). Due to rounding, some cell entries do not sum to total. ***p<0.01, **p<0.05, *p<0.10.
More important for the present analysis, the data in Table 1 show that respondents from groups that did not have a co-ethnic candidate in the presidential race were roughly two and a half times more likely to update their preferences than respondents from groups that had a co-ethnic in the race (24.4 per cent compared to 9.5 per cent, difference=14.9, p<0.001). Part of this difference can be attributed to higher rates of uncertainty at the start of the campaign: 9.4 per cent of those who did not have a co-ethnic in the race switched from ‘don’t know’ to one of the leading candidates, while only 3.2 per cent of those with a co-ethnic in the race did so (difference=6.2, p<0.001). But a substantial difference is also observed with regard to movement between the two leading candidates: while 12.9 per cent of those without a co-ethnic in the race switched between Kenyatta and Odinga, only 5.1 per cent of those with a co-ethnic in the race did so (difference=7.8, p<0.001).Footnote 49
While the data in Table 1 suggest that having a co-ethnic leader in the race affects the likelihood of changing one’s vote during the campaign, it is possible that members of groups with a co-ethnic in the 2013 race differ in some systematic ways from members of groups that did not have a co-ethnic in the race, and that these underlying differences – rather than having a co-ethnic in the race – explain the differences documented in Table 1. To address this possibility, I estimate a series of logit models of preference change that control for a wide range of potential confounds suggested by prior literature. In all models, the dependent variable takes a value of 1 for respondents whose voting intentions changed during the campaign period, and 0 otherwise.
All control variables, except where noted, are taken from the first survey round. Full details of the measures and descriptive statistics are provided in the Appendix. First, following studies that show that voters from mixed social backgrounds have more fluid preferences,Footnote 50 I include measures of whether respondents come from mixed-ethnicity parents or are married to (or live with) a non-co-ethnic partner. Second, in line with research showing that the diversity of social networks and local environments can affect preferences,Footnote 51 I include measures of the ethnic diversity of respondents’ social networks and local environments. Third, a large body of literature has shown that information access, knowledge and political interest are linked to preference stability.Footnote 52 Following these works, I include measures of political interest, education, media consumption and whether respondents mainly get radio news from national-language stations that broadcast in Swahili and/or English or ‘vernacular’ stations that broadcast in the language of a particular ethnic group. Finally, I include standard demographic controls – age, gender and wealth – that other studies have shown to be associated with preference change,Footnote 53 and I control for the number of days between interviews.
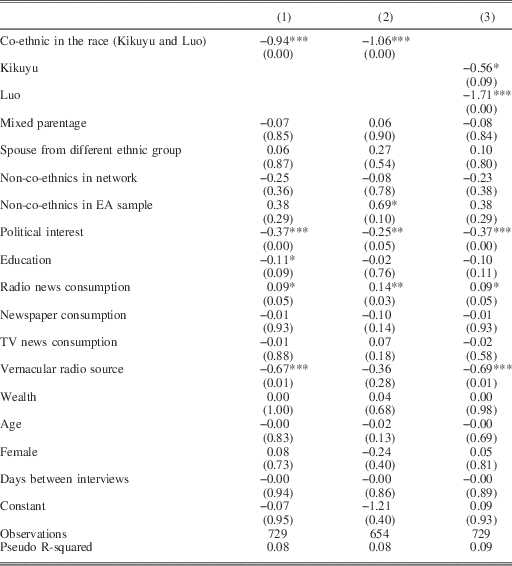
The results from logit analysis are shown in Table 2. Model 1 confirms that those with a co-ethnic in the race are less likely to change their voting intentions during the campaign. Holding all control variables at their means, having a co-ethnic in the race is associated with a 12.2-percentage-point decrease in the predicted probability of changing one’s preferences, similar in magnitude to the raw data in Table 1. Next, I re-estimate the model excluding respondents who changed to or from ‘don’t know’ between survey rounds in order to test whether those who do not have a co-ethnic in the race have more fluid preferences solely because they tend to be more undecided at the start of the race. The results in Model 2 indicate that the findings in the base model do not stem only from higher levels of initial uncertainty. I also disaggregate the key independent variable to test whether the observed effect holds for both groups with a co-ethnic in the race, the Kikuyu and the Luo, and show in Model 3 that it does.
Logit Models of Preference Change

Notes: the dependent variable in all models takes a value of 1 for respondents whose preferences changed between survey rounds. Model 1 serves as the base model. Model 2 excludes those who changed to or from ‘don’t know.’ Model 3 disaggregates the main independent variable. Data is weighed to account for attrition (see Appendix). p-values in parentheses; ***p<0.01, **p<0.05, *p<0.10.
I briefly discuss three robustness tests, details of which can be found in the Appendix. First, in the above analysis I treat only two groups – the Kikuyu and Luo – as core groups. Yet, as noted, one might think that having a vice presidential nominee in the race would also provide a strong signal about which political alliance would best represent one’s ethnic group. It might therefore be appropriate to treat the Kalenjin and Kamba as core groups, given the presence of William Ruto (a Kalenjin) and Kalonzo Musyoka (a Kamba) as the vice presidential nominees on the Jubilee and CORD tickets. The results in Appendix Table A7 show that the main findings are robust to treating the Kalenjin and Kamba as core groups.
Second, given that the analysis relies on panel data, there is a risk that attrition could bias the results in ways that would favor the main hypothesis. However, the analysis of attrition rates (discussed more fully in the Appendix) suggests that attrition likely biased the sample in the opposite direction. Moreover, all analysis presented above employs weights to account for attrition on observables using the method developed by Fitzgerald, Gottschalk and Moffitt.Footnote 54 Third, I examine whether the results stem from interviewer effects. Appendix Table A8 shows no significant differences across core and swing groups with regard to the likelihood of being interviewed by a non-co-ethnic, and Appendix Table A9 shows that the main results are robust to the inclusions of variables for interviewer ethnicity.
LINKING PREFERENCE CHANGE TO BELIEFS ABOUT THE CANDIDATES
Next, I offer evidence that instrumental theories of ethnic voting can help explain the observed changes in voting intentions. Instrumental theories imply that if electoral choices depend on beliefs about how well each candidate will represent the interests of one’s ethnic group, voters should update their voting intentions if their beliefs about the candidates’ intentions change.
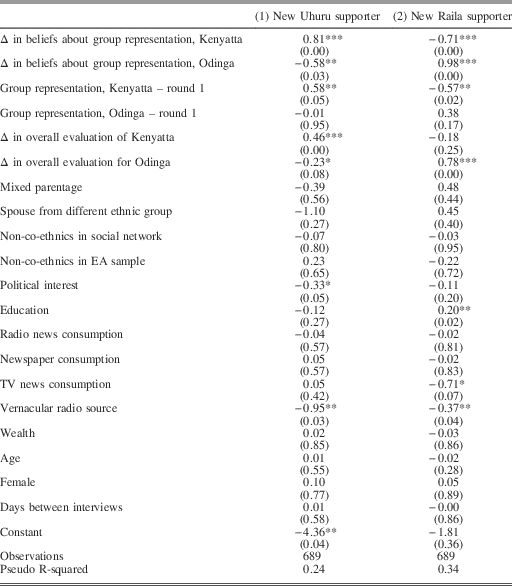
To test this proposition, I use logit regressions to estimate two transition models that examine the direction of change. In the first model, which examines transitions to Kenyatta, the dependent variable takes a value of 1 for respondents who registered a preference for Kenyatta in the second survey round but not in the first. The second model repeats the analysis for transitions to Odinga. The key independent variables in both models measure the change in respondents’ beliefs about how well each candidate would represent their ethnic community between survey rounds. In addition to the controls used in the models of preference change (Table 2), I include respondents’ initial beliefs about the candidates’ ethnic intentions, as measured in the first survey round, to account for the possibility that changes in these beliefs may matter less for those who initially hold strong positive or negative beliefs about how well either candidate would represent their group’s interests. The models also include variables that measure changes in the overall favorability ratings (like/dislike) of each candidate in order to distinguish the effects of changes in beliefs about the candidates’ ethnic intentions from more general attitudes toward each candidate.Footnote 55
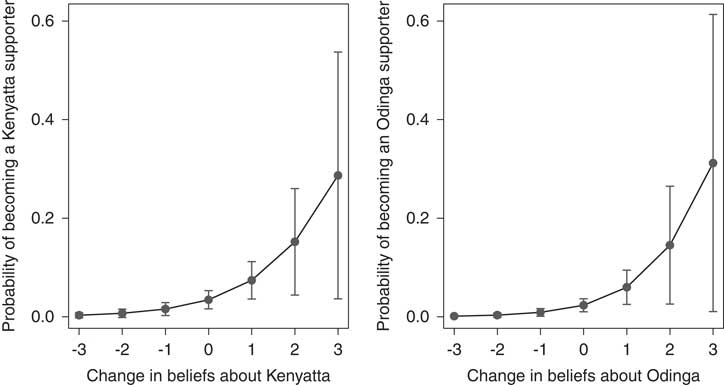
The association between changes in beliefs about the candidates’ representational intentions and electoral preferences is shown in Table 3. The models show that a positive change in beliefs about how well either candidate would represent one’s ethnic group is associated with an increase in the probability of becoming a supporter and a decrease in the likelihood of becoming a supporter of the candidate’s rival. Figure 2 plots the estimated effect of a change in beliefs about each candidate on the probability of becoming a new supporter of each candidate, holding all other variables in the models at their mean values. It shows that the probability of becoming a new Kenyatta or Odinga supporter was less than 0.05 for a respondent whose views of the candidates were unchanged during the campaign period. Negative changes in beliefs about either candidate reduced the probability of becoming a new supporter to nearly 0, while positive changes sharply increased the likelihood of becoming a new supporter of each candidate. I treat these estimates as suggestive evidence, given that changes in beliefs about the candidates’ ethnic intentions could be endogenous to changes in voting preferences and the models cannot account for all possible confounds that might be correlated with both beliefs about the candidates’ ethnic intentions and electoral preferences. Nonetheless, the evidence is consistent with the proposition that campaigns work by shifting voters’ perceptions of which candidate will best represent the interests of their ethnic communities.
Estimated effect of changes in beliefs about candidates on vote intention Notes: These figures show the estimated effect of changes in perceptions about how well each candidate will represent the respondent’s group, based on the results in Table 3. Estimated effects are calculated with other covariates held at their mean values.

Logit Models of Direction of Change

Notes: data is weighed to account for attrition (see Appendix). p-value in parentheses; ***p<0.01, **p<0.05, *p<0.10.
ALTERNATIVE EXPLANATIONS
While the results show that voters from groups without a co-ethnic in the race are more likely to change their voting intentions during the campaign, the primary mechanism proposed to explain such changes – campaign persuasion – is not directly observed. Because of the well-known limitations associated with estimating campaign effects using observational data, this article infers the effects of the campaign by observing changes in voting intentions during the campaign period rather than seeking to directly estimate the effects of campaign exposure.Footnote 56 However, because it is indirect, this approach provides only suggestive evidence that differences in receptivity to campaign persuasion explain the observed shifts in voting intentions. To bolster confidence in the proposed mechanism, this section rules out several alternative explanations.
One concern is that changes in voting intentions might be attributed to events other than the campaigns. The short time frame for campaigning (roughly three months) in Kenya helps to mitigate this risk. Moreover, the median time between the first and second survey waves was only sixty-six days. Despite this, it is plausible that other events could affect voter intentions. Particularly relevant are elite defections, which could prompt some voters to update their views of the opposing candidates and their parties. To explore this possibility, I collected information on politicians who switched parties during the campaign from Kenya’s two major newspapers, The Nation and The Standard.Footnote 57 I then coded the ethnicity of each party switcher and classified each as major or minor in terms of prominence.Footnote 58 The data (presented in Appendix Table A3) show that party switching was relatively rare during the 2013 campaign, and of the sixty-one politicians who switched parties, only fifteen were prominent politicians. More importantly, there is no clear relationship between party switching and rates of preference change across ethnic groups, as shown in Appendix Figure A2.
While overall trends in party switching appear not to account for differences in preference change, it is worth further exploring the possible effects of one very prominent defection, Musalia Mudavadi’s departure from the Jubilee Coalition to stand for the presidency on his own party label, UDF. One way to control for the potential effects of Mudavadi’s departure is to rerun the main test in Table 2 without respondents from Mudavadi’s Luhya ethnic group, those who would have in all likelihood been most affected by his decision. The results, presented in Appendix Table A4 (Model 1), show that the main findings are not affected by the exclusion of Luhya respondents. An alternative is to include variables that track individual support for Mudavadi, in order to account for possible differential effects caused by his exit from Jubilee. I employ two variables that measure perceptions, one that probed sentiments toward the candidate by asking how much respondents liked or disliked Mudavadi, and a second that asked respondents how well they thought the candidate would represent the interests of their ethnic group if elected. The results, presented in Appendix Table A4 (Models 2 and 3), show that the main findings presented above are robust to the inclusion of these variables.
A second concern is that differences in the stability of preferences may stem from differential exposure to the campaigns, rather than receptivity to campaign persuasion. Perhaps Kikuyus and Luos in the 2013 race were less likely to update their preferences because they had fewer opportunities to interact with the campaigns. Data from the second survey round, however, show that Kikuyus and Luos were no less likely to have attended campaign rallies, to have been contacted at home by the leading parties, to have received an SMS message related to the election or to have been offered money for their vote (Appendix Table A5). And in some instances, Kikuyus and Luos were more likely than voters from other groups to have been exposed to these campaign activities. These data suggest that Kikuyus and Luos were less likely to change their voting intentions because the strength of their initial preferences made them less receptive to campaign influences, not because they received a smaller ‘dose’ of the campaigns.
A third alternative explanation relates to the strength of ethnic identities. The expressive voting literatureFootnote 59 suggests that strong bonds of ethnic affinity may create psychological benefits that incline voters to support co-ethnic candidates or the party that best integrates co-ethnic leaders. If such bonds are more widespread or intense within some ethnic communities, or if they only come into play when voters have a co-ethnic in the race, we might expect to find lower rates of preference change within such groups. While the panel survey did not include a question on the strength of ethnic identification, data from a previous study conducted in 2007 is useful here.Footnote 60 The survey found that among Kikuyus and Luos, 19 per cent identified in terms of their language or tribal group while 20 per cent of other groups did, suggesting that communal attachments are not more pronounced for voters in groups that had a co-ethnic in the 2013 race. The relatively small share of respondents identifying in ethnic terms, moreover, suggests that even if ethnic attachments do matter only when voters have a co-ethnic in the race, such attachments are not sufficiently widespread to account for differences in the stability of preferences across core and swing groups in Kenya’s 2013 election.
Finally, I explore whether the results might reflect social pressure or in-group sanctioning. Kikuyus and Luos have frequently been at the center of political contestation in Kenya. Perhaps as a result of this history of political mobilization, stronger norms against ‘defecting’ from group behavior (and networks to enforce such norms) have developed within these two communities. During elections, members of these groups might therefore face stronger sanctions that would lead to more homogenous voting intentions at the start of the race and a reduced likelihood of changing one’s vote over the course of the campaign. To test this possibility, the second round of the panel survey asked about two types of possible external sanctions: social marginalization and physical violence. The survey first asked respondents who they thought was the leading presidential candidate in the area. It then asked respondents how afraid they would be that others in their area would exclude them from social gatherings and/or attack or harm them if they voted against the leading local candidate. As shown in Appendix Table A6, the data reveal positive differences on both measures among voters from groups with a co-ethnic in race, but these differences are substantively small and not statistically significant.
CONCLUSION
This article proposes that in highly diverse societies where ethnicity is politically salient, voters who do not have a co-ethnic leader in the race are more likely to update their electoral preferences during the campaign. Data from a two-round panel study conducted prior to Kenya’s 2013 presidential election provide support for this proposition.
To what extent do these arguments generalize beyond the single election and country studied here? There is good reason to think that they should apply to other diverse societies, particularly in Africa. The key factors identified in this article – high levels of ethnic diversity, voters’ reliance on ethnic cues and political institutions that concentrate power in the chief executive – prevail across much of Africa. And while few studies have examined electoral volatility, research from other parts of Africa suggests that the arguments presented here are relevant beyond Kenya. In a study of swing voters in Ghana, for example, Weghorst and Lindberg treat two ethnic groups – the Ashanti and the Ewe – as the core ethnic communities of the two leading parties, the New Patriotic Party and National Democratic Congress, arguing that voters in these groups are less receptive to elite persuasion and are therefore less likely to update their preferences between election rounds.Footnote 61 The informational approach developed in this article suggests that the Ashanti and Ewe are core groups in part because both communities have had co-ethnic leaders in past presidential elections, particularly in the first elections after the return to multiparty politics, when beliefs about the parties’ representational intentions likely solidified for many voters.
At the same time, there may be cases where the argument will be less applicable. It is important to note that electoral preferences in Kenya’s 2013 election may have been particularly fluid both because the two key coalitions formed just prior to the main period of campaigning and because there was no incumbent in the race. It is plausible that in settings where the parties are more stable and/or where an incumbent stands for re-election, initial preferences may be more firmly set prior the campaign, limiting the extent of preference change during the campaign period and muting the distinction between core and swing voters. Second, an important aspect of Kenya’s 2013 election was that the two leading contenders were from different ethnic backgrounds. Where two or more viable candidates come from the same community, as in Kenya’s 2002 election, voters from that group may be more up for grabs at the start of the race, again blurring the distinction between core and swing voters.
The findings presented here suggest several avenues for future research. First, considerable heterogeneity in preference change was observed in Kenya’s 2013 election both among groups that had a co-ethnic candidate the race and among those that did not. This suggests that the arguments offered here could be enriched by exploring other group-level factors, potentially including social distance or inter-group polarization, which may also explain differences in preference volatility. Second, the analysis in this article focuses primarily on differentials in the fluidity of preferences, not the aggregate direction of change during the campaign. Supplemental analysis (Appendix Table A10) shows that the strength of ethnic bloc voting increased during the campaign period in most of Kenya’s larger ethnic communities, a finding that merits future exploration. Finally, more work is needed to test the specific mechanisms that drive attitude change during campaigns in emerging, multi-ethnic settings like Kenya. In particular, the findings presented here would be enriched by work that exploits exogenous variation in campaign exposure to test the relative effects of persuasive appeals across core and swing groups.