The Centers for Disease Control and Prevention (CDC) National Healthcare Safety Network (NHSN) Antimicrobial Use (AU) optionReference Fridkin, Baggs and Fagan 1 provides systems with the ability to (1) internally track antibiotic consumption and (2) participate in a national benchmark. 2 The AU method uses antimicrobial days (AD) per 1,000 days present. Antimicrobial days are extracted from the electronic medication administration record (eMAR) and are tallied facility-wide and per unit. Thus, a patient on 1 antibiotic who transfers through 3 units on a given day contributes 1 AD facility-wide and 1 AD to each unit-specific calculation. 2 The standardized denominator for AD, 1,000 days present, is a tally of the number of patients who were present for any portion of a calendar day facility-wide and per unit. 2
Older methods of tallying antimicrobial consumption, such as days of therapy (DOT), have been traditionally used. A DOT is counted as any day in which the patient was prescribed the antibiotic. Denominators also differ slightly with older methods. Generally, patient days are calculated as patients present between the census-taking times on 2 sequential calendar days within the entire facility and then are standardized to 1,000 patient days.Reference Cohen, Calfee and Fridkin 3 Thus, specific distinctions exist between AU definitions and traditional metrics. We previously tracked antimicrobial consumption as DOT/1,000 patient days.Reference McLaughlin, Advincula, Malczynski, Qi, Bolon and Scheetz 4 Here, we have evaluated the correlation between DOT/1,000 patient days and AD/1,000 days present. Such an understanding is needed if hospitals wish to identify trends using data collected with the older DOT methodologies as they switch to ADs in the NHSN AU module.
METHODS
Broad-spectrum β-lactams were targeted for evaluation because inappropriate use of these agents can lead to widespread antibiotic resistance and can compromise patient care. Days of therapy per 1,000 patient days were compared with antimicrobial days per 1,000 days present at our large tertiary academic medical center over a 12-month period. Days of therapy were calculated as previously describedReference McLaughlin, Advincula, Malczynski, Qi, Bolon and Scheetz 4 and were obtained monthly from pharmacy records (TheraDoc, Premier, Salt Lake City, Utah). Broad-spectrum β-lactam data included cefepime, ertapenem, imipenem, meropenem, and piperacillin-tazobactam.Reference McLaughlin, Advincula, Malczynski, Qi, Bolon and Scheetz 4 Imipenem and meropenem consumption data were combined in all analyses due to drug shortages and restricted formulary status.Reference McLaughlin, Advincula, Malczynski, Qi, Bolon and Scheetz 4 Denominators were calculated as described above. Antimicrobial days for the aforementioned antimicrobials and days present (facility-wide) were extracted from TheraDoc as compiled for the export to the NHSN AU module. 2 System mapping was performed to ensure that locations contributing antibiotic orders to DOT were identical to those mapped for the AU module.
Standardized consumption rates were calculated monthly using each method. The correlation between metrics was evaluated using the Pearson correlation coefficient across all agents. Agent-specific correlations were also calculated. Least-squares regression was utilized to calculate the slope of the best-fit line between metrics. The intercept of the regression was estimated and was also fixed at zero to permit a simple comparison of intermethod variation at all levels of consumption. Analyses were conducted using Stata version 14.0 (Statacorp, College Station, TX) and Microsoft Excel 2013 (Microsoft, Redmond, WA). An a priori level of α for significance was set at 0.05 for all comparisons.
RESULTS
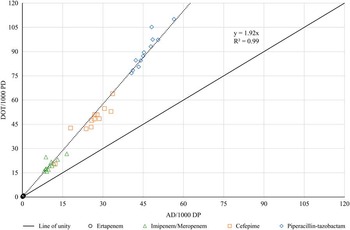
Broad-spectrum β-lactam consumption represented ~14% of all antimicrobial consumption in 2012, according to the NHSN AU module. Across all antimicrobials evaluated, the mean±standard deviation (SD) consumption was 39.5±34.9 DOT/1,000 patient days compared to 20.7±17.9 AD/1,000 days present. Consumption estimates according to each method were highly correlated across all agents (R2=0.99; P<.0001) (Figure 1). Overall, AD/1,000 days present underpredicted DOT/1,000 patient days by 1.94-fold (95% CI, 1.88–2.00) when the y-intercept was allowed to vary. The underprediction of DOT/1,000 patient days was similar at 1.92-fold (95% CI, 1.88–1.95) when the linear regression fixed the intercept at zero (Figure 1). When comparing the slopes of the regression lines according to whether or not the intercept was fixed at zero, the slope changed by <1.1%. Thus, a fixed-intercept model was selected for all comparisons.
Observed correlation between agent-specific DOT/1,000 patient days and AD/1,000 days when the y-intercept is fixed at zero. The correlation between standardized rates of days of therapy and antimicrobial days is shown. AD, antimicrobial days; DOT, days of therapy.

Agent-specific comparisons showed a high degree of correlation for ertapenem (R2=0.85), meropenem/imipenem (R2=0.74), cefepime (R2=0.92), and piperacillin-tazobactam (R2=0.93) (P<.01 for all). When the intercept was fixed at zero for each individual agent, the slopes of the regression lines for ertapenem, meropenem/imipenem, cefepime, and piperacillin-tazobactam were generally similar to the overall slope of the NHSN AU module estimate (1.75-, 1.85-, 1.80-, and 1.96-fold underprediction of DOT/1,000 patient days, respectively; P<.0001 for all).
DISCUSSION
Consumption estimates determined by the AU module (in AD/1,000 days present) were roughly 2-fold lower than those quantified by DOT/1,000 patient days. These findings were consistent across all of the antimicrobials evaluated. The high degree of correlation between these 2 consumption evaluation methods should be reassuring to institutions implementing AU programs for benchmarking purposes. Patient-specific factors, including renal dose adjustment, may influence NHSN AU module estimates. Additional studies are needed to verify these preliminary findings.
Hospitals that opt to align with the AU module and implement antimicrobial days as their primary measure of antimicrobial consumption will benefit by having a method to convert old DOT data to AD measures. In studies designed to characterize the relationship between consumption and patient-level outcomes, such as the development of resistance, days of therapy has traditionally been used as the primary consumption metric.Reference Polk, Fox, Mahoney, Letcavage and MacDougall 5 Thus, converting days of therapy to antimicrobial days allows institutions to trend previously tabulated data. Given the clear link between antimicrobial consumption and resistance, it is of critical importance to ensure that antimicrobial consumption measures are valid and reproducible.Reference Polk, Fox, Mahoney, Letcavage and MacDougall 5 , Reference Monnet, Lopez-Lozano, Campillos, Burgos, Yague and Gonzalo 6
Limitations to our analysis include the relatively small number of agents evaluated and the relative homogeneity of renal dose adjustment expected for each agent we evaluated (eg, none of the agents evaluated would have been dosed every 48 hours per internal protocols). However, our analysis is strengthened by the concordance of slopes for each agent. Our data also included high-use agents (eg, piperacillin-tazobactam) and low-use agents (eg, ertapenem).
In conclusion, our findings suggest that participants in the NHSN AU module program may be able to convert past consumption data from DOT/1,000 patient days to AD/1,000 days present using a simple scaling factor. We believe that institutions should use consistent metrics when evaluating consumption data. Backward conversion of data (as demonstrated here) is possible; however, we recommend that others verify their own data independently.
ACKNOWLEDGMENTS
We are thankful to the entire team dedicated to the NHSN AUR system. Without their help, benchmarking would forever be limited to academic institutions.
Financial support: This study was conducted as part of our routine work.
Potential conflicts of interest: Dr. Davis reports grants and personal fees from Merck Pharmaceuticals, grants and personal fees from Allergan, personal fees from Melinta, and personal fees from Pfizer pharmaceuticals outside the submitted work. Dr. Scheetz reports grants from National Institute of Allergy and Infectious Diseases of the National Institutes of Health and various other foundations during the conduct of the study; however, these are not relevant to the submitted work. All other authors report no conflicts of interest relevant to this article.