I. INTRODUCTION
The size-controlled and shape-dependent micro- and nanoscale inorganic materials have attracted considerable attention, especially the crystals with ordered superstructures self-assembled by low-dimensional inorganic nanostructure, because of their importance in basic scientific research and potential applications in technology.Reference Luo, Li, Shu, Wang, Xia and Yan1–Reference Zhou, Wang, Xu and Sun3 Many efforts have been made to explore effective synthetic approaches to the fabrication of a variety of inorganic crystals with complex three-dimensional (3D) nanostructures to enhance their performance in currently existing applications.Reference Kiebach, Pienack, Bensch, Grunwaldt, Michailovski, Baiker, Fox, Zhou and Patzke4–Reference Sun, Yang, Villers, Zhang, Sacher and Dodelet8 Various methods have been used to synthesize 3D microarchitectures, such as the microemulsion method, hydrothermal (solvo-thermal) method, sol-gel method, molten salt method, microwave method, sonochemical route, and so on. Among these methods, the hydrothermal method is a typical solution-based approach that has been proven as an effective and convenient process in preparing various inorganic materials with diverse controllable morphologies and architecture in terms of cost and potential for large-scale production.Reference Song, Xu and Yu9, Reference Liang, Peng, Wang, Zheng, Wang, Qiu, Nan and Li10 The surfactant-assisted hydrothermal approaches are the effective method for the synthesis of inorganic materials at relatively low temperature.
Recently, tungstate compounds have attracted great interest for their applications in the fields of laser hosts, photocatalysts, x-ray intensifying screen, scintillators, etc.Reference Lei and Yan11, Reference Lei, Yan and Chen12 Double tungstates containing sodium, potassium and rare-earth ions have been extensively investigated because of their applicability in diode-pumped solid-state lasers.Reference Wang, Zhang, Wang, Yu, Zhang, Wang, Wang and Ba13–Reference Han, García-Cortés, Serrano, Zaldo and Cascales17 As novel high-quality crystals of monoclinic KLu(WO4)2, KLu(WO4)2 single crystal doped with other rare-earth ions has been reported.Reference Petrov, Pujol, Mateos, Silvestre, Rivier, Aguiló, Solé, Liu, Griebner and Díza18 However, except for these investigations of (Na, K)Ln(WO4)2:RE3+ single crystals, little is known about white light Eu3+-doped sodium lutetium tungstates polycrystals. Tungstates can emit blue-green light themselves under ultraviolet (UV) excitation, with Eu3+ doping, and tungstates may also effectively transfer energy to Eu3+ generating red emissions.Reference Nazarov, Tsukerblat, Popovici and Jeon19 Therefore, by adjusting the doping concentration of rare-earth ions, tungstates become potential white light phosphors. In the past few years, there appeared a large amount of literature corresponding to the red, blue, and green tungstate phosphor, such as Eu3+- or Tb3+-doped CaWO4,Reference Wen, Zhao, Huo, Chen, Lin and Zhang20 ZnWO4, etc.Reference Dai, Song, Bai, Pan, Lu, Wang, Ren and Zhao21, Reference Huang, Luo, Yu, Li and Zou22 Some work has been done on Eu3+-doped white light tungstate phosphors. For example, Huang et al.Reference Huang, Luo, Yu, Li and Zou22 have reported white-light emission yttrium tungstate-chloride xerogel without activator ions. To completely understand the mechanism of rare-earth-doped tungstate generating white light, we investigated a series of rare-earth tungstates phosphors.Reference Lei and Yan23, Reference Lei, Yan, Chen and Zhao24
In this work, a novel kind of sodium lutetium tungstate phosphor with self-assembled 3D spheres microarchitectures have been synthesized via a facile surfactant-assisted hydrothermal process. The cationic surfactant cetyltrimethyl ammonium bromide (CTAB) as a structure-directing agent plays a key role in driving self-assembled lutetium tungstate microspheres composed of nanoflakes. The pH value, reaction time, and reaction temperature also have a significant influence on the morphology of crystals. The photoluminescence (PL) properties of lutetium tungstate microspheres have been investigated.
II. EXPERIMENTAL SECTION
A. Chemicals
Europium oxide [Eu2O3 (99.99%)], yttrium oxide [Lu2O3 (99.99%)], sodium tungstate [Na2WO4·H2O (A.R.)], sodium hydroxide [NaOH (A.R.)], and cetyltrimethyl ammonium bromide (CTAB) were used without further purification.
B. Synthesis procedures
All chemicals are of analytical grade and used without further treatments. In a representative synthesis route, the given amount containing rare-earth ions (Lu3+ and Eu3+) nitrate were prepared by dissolving corresponding Eu2O3–Lu2O3 [(2–x) mmol Lu3+ and x mmol Eu3+ (x = 0, 0.02, 0.04, 0.06, and 0.08)] in HNO3, and excess HNO3 was removed by evaporation (the molar ratio of Eu3+ and Lu3+ varies from 0.01 to 0.05). The solution A was prepared by dissolving the obtained rare-earth nitrate (containing Lu3+ and Eu3+) in 5-mL deionized water; solution B was prepared by dissolving Na2WO4·2H2O (the molar ratio of RE3+ and W6+ is 2:1) and CTAB in a 5-mL deionized water (with heat treatment at ∼348 K) at initial pH 7.0 and stirred for 10 min. Solution A was then added into solution B, and the mixture was vigorously stirred for ∼30 min to ensure that all reagents were dispersed homogeneously. The mixture was transferred into a 25-mL Teflon-lined (DuPont, Wilmington, DE) stainless steel autoclave and filled with deionized water up to a 70% filling capacity of the total volume. The autoclave was sealed and maintained at 180 °C for 1 to ∼72 h and then naturally cooled to room temperature. After the aforementioned hydrothermal treatment, the product was centrifuged and washed with deionized water and absolute ethanol several times. The precipitate was then dried at 70 °C for 24 h and collected for characterization. The pH value was adjusted by adding NaOH. The experiments with different reaction parameters (different time, reaction temperature, etc.) are in the same process.
C. Characterization
The final products were examined by x-ray diffraction (XRD), scanning electron microscopy (SEM), energy-dispersive x-ray spectra (EDX), transmission electron microscopy (TEM,) thermogravimetry-differential scanning calorimetry (TG-DSC), Fourier transform infrared (FTIR), ultraviolet-visible (UV-vis) spectra, and PL, respectively. X-ray powder diffraction analyses were carried out on a Bruker D8-Focus x-ray diffractometer (Bruker AXS Company, Karlsruhe, Germany) with graphite-monochromatized Cu Kα radiation (40 KV/60 mA, graphite monochromator). Thermogravimetric analysis was performed on an STA-409PC/4/H LUXX TG-DSC instrument (NETZSCH-Gerätebau GmbH Company, Selb, Germany) at a heating rate of 10 K/min to a maximum temperature of 1273 K. The morphology was characterized with a Philips XL-30 (Philips Company, Amsterdam, The Netherlands) environmental scanning electron microscope (ESEM) equipped with an EDX. TEM images were recorded on a JEOL200CX (Tokyo, Japan) microscope with an accelerating voltage of 200 kV. PL spectra were obtained using a fluorescence spectrophotometer (RF5301) with a xenon lamp as the excitation source. FTIR data were collected on a Nicolet model 5SXC (America, Waltham, MA) spectrophotometer in the range of 4000–400 cm−1 using KBr pellets. UV-vis diffuse reflectance spectra were recorded on an America BWtek Instantspec BWS003 spectrophotometer equipped with an integrating sphere, using BaSO4 as a reference.
III. RESULTS AND DISCUSSION
CTAB as a cation surfactant plays a critical role in the formation of nano- and micro- architectures. The formation mechanism of lutetium tungstate microspheres is obviously due to a template effect in the presence of surfactant CTAB. As a surfactant, CTAB is widely used as a structure-directing agent.Reference Zhu, Zhang, Xiao, Yang and Fu25, Reference Wang, Zhang, Chen and Anpo26 Many studies testified that the growth of nanostructures is related to selective absorption of organic surfactants onto certain crystallographic facets to promote the crystal growth.Reference Zhu, Zhang, Xiao, Yang and Fu25–Reference Xie, Dai, Huang, Liang, Jiang and Qian27 To better understand the template effect, we also investigated the products obtained in the same hydrothermal process without adding any surfactants as a comparison.
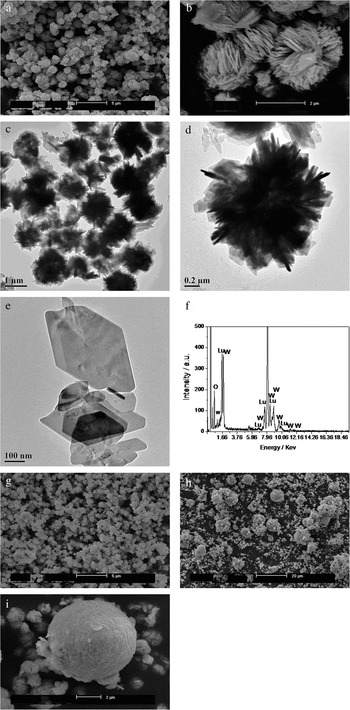
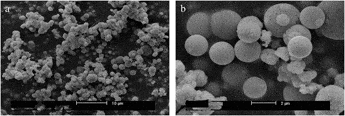
Figures 1(a) and 1(b) show the SEM images of the products obtained by hydrothermal process at 180 °C for 72 h without adding the surfactant CTAB, and we can observe that the uniform particles are sphere-like morphology with a diameter of ∼2 μm. The spheres are composed of a great many self-assembled nanoflakes [Fig. 1(b)]. That is to say, without the influence of surfactant, the products have the tendency to form minimum surface energy spheres. The TEM image of Fig. 1(c) shows the overview of the microspheres. The magnification TEM image of one independent microsphere is shown in Fig. 1(d). It is a solid sphere with a diameter of ∼2 μm and is composed of a great many nanoflakes. The size of the nanoflake is about 100 to ∼200 nm [Fig. 1(e)]. To verify the composition of the superstructure, the energy dispersive spectroscopy (EDS) spectrum [Fig. 1(f)] of the microstructure is carried out for the product in Fig. 1(e), which indicates that the contents of Lu, W, and O elements for nanoflake crystal are with the molar ratio (Lu:W:O) of 1:1.3:3.5. The concentration of CTAB also plays a role in controlling morphology of the hydrothermal product. Figure 1(g) is the SEM image of the product obtained in the presence of 0.3 mmol CTAB. The size of the microspheres is smaller than the spheres obtained without the influence of CTAB. The SEM image of the hydrothermal products obtained in the presence of 0.5 mmol CTAB are shown in Figs. 1(h) and 1(i). Figure 1(h) shows the low magnification view of the hydrothermal product. The products are composed of a great many smaller spheres with a diameter of ∼0.5 to 1 μm and several larger spheres with a diameter of ∼5 μm. The maximum and minimum size spheres coexisted at the same time, and many smaller spheres attach onto the surface of the larger ones. Figure 1(i) shows a high magnification view of the product. The smaller spheres are made up of nanoflakes, which is the same as the product obtained without the influence of CTAB. The difference is that in the presence of CTAB the smaller spheres are inclined to aggregate into larger spheres and then form a smooth surface. As one of the crystal growth mechanisms, Ostwald ripening has been used extensively to describe and explain the crystal growth of particles with approximately micrometer size in solution.Reference Li, Luo and Papadimitrakopoulos28–Reference Fan, Morozumi, Kimura, Yokoi and Okubo30 This is the process by which larger particles grow at the expense of smaller ones as a result of the higher solubility of the smaller particles.Reference Stabel, Herna, Schryver and Rabe31–Reference Hoang, Deriemaeker, La and Finsy33 However, in some circumstances, it cannot be used to explain the crystal growth process.Reference Zhang, Wang, Zheng, Huang, Chen, Lan, Ren, Lin and Wang34 In this CTAB-assisted hydrothermal process, the larger microspheres are composed of aggregated smaller spheres. The 3D architectures can be spontaneously assembled by mesoscale transformation processes that involve metastable inorganic-based colloidal aggregates.
(a) Low magnification and (b) high magnification SEM images of the product obtained by the hydrothermal method at 180 °C for 72 h without adding surfactant, (c) low magnification TEM image, (d) high magnification TEM, (e) nanoflakes and the corresponding (f) EDS spectra, (g) the same hydrothermal process with adding 0.3 mmol CTAB, (h) low magnification and (i) high magnification of the products obtained in the presence of 0.5 mmol CTAB by the same hydrothermal process.

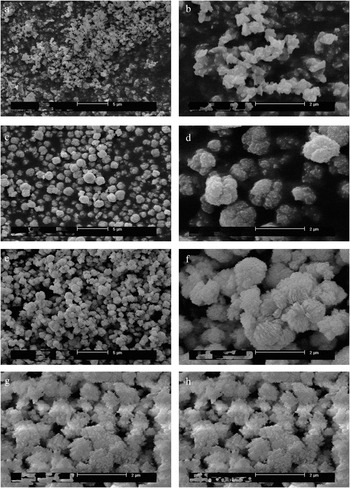
The shape evolution of the products obtained by the hydrothermal method at 180 °C for different times in the presence of 0.3 mmol CTAB is examined by SEM (Fig. 2). This process contains two steps: nucleation and crystal growth. At the primary stage of the reaction (1 h), we can obtain the nonhomogeneous particles with different size distribution [Fig. 2(a) low magnification and Fig. 2(b) high magnification]. This process can be viewed as a nucleation process. When the reaction is prolonged up to about 3 h, a great many sphere-like particles come into being [Fig. 2(c)], the high magnification SEM image [Fig. 2(d)] shows that all the particles are in the form of spheres with a rough surface. When the reaction time is prolonged up to 6 h, the crystallization of the sphere-like particles is improved [Fig. 2(e)]. From the high magnification view [Fig. 2(f)] we can clearly observe that the spheres with a diameter of ∼1.5 μm are composed of many nanoflakes. The spheres obtained for 24 h [Figs. 2(g) and 2(h)] by the same hydrothermal process aggregate seriously. The particle size of the spheres is not much different than the spheres obtained for 6 h.
SEM images of the products obtained in the presence of 0.3 mmol CTAB after reaction of different times at 180 °C for (a, b) 1 h, (c, d) 3 h, (e, f) 6 h, and (g, h) 24 h with different magnifications.

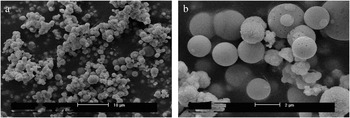
Except for the influence of reaction time and surfactant, reaction temperature also plays a key role in controlling morphology of the product. Figure 3(a) is the overview of the products obtained at 230 °C for 24 h in the presence of 0.5 mmol CTAB. The high magnification SEM image [Fig. 3(b)] shows that there exist three kinds of spheres, one is the sphere composed of nanoflakes, the second one is the spheres with a smooth surface, and the third one is the smooth sphere with pores. While at the relatively high temperature, the surface of the spheres is smooth and some have pores. The spheres with a rough surface and smooth surface coexist at the same time. This may be due to the incomplete reaction of the temperature.
(a) Low magnification and (b) high magnification SEM images of the products obtained at 230 °C for 24 h in the presence of 0.5 mmol CTAB.

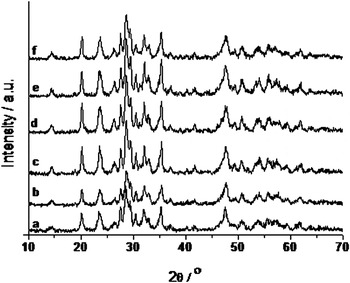
The phase and purity of the as-synthesized samples are characterized by XRD patterns. Figures 4(a)–4(f) show the XRD patterns of the products obtained by the hydrothermal method at 180 °C for different reaction times 1, 3, 6, 24, 48, and 72 h, respectively. Figure 4(a) is the XRD pattern of the hydrothermal product obtained for 1 h, the diffraction peaks are obviously broadened. The products obtained for 3 h also exhibit a broad XRD pattern [Fig. 1(b)]. By prolonging the reaction time, relative sharp diffraction peaks can be observed. The broadened diffraction peaks indicate the small size of the crystals; this result is in agreement with the nanoflakes discussed by the TEM image. These lutetium tungstates XRD patterns are similar to gadolinium tungstate and yttrium tungstate investigated previously,Reference Wen, Zhao, Huo, Chen, Lin and Zhang20 whose crystal structures have not been made clearly. The hydrothermal product may contain sodium ammonium tartrate hydrate (C4H8NNaO6·4H2O), which belongs to monoclinic symmetry with lattice parameter a = 12.125, b = 14.414, and c = 6.199, space group is P21.Reference Kiebach, Pienack, Bensch, Grunwaldt, Michailovski, Baiker, Fox, Zhou and Patzke4 The aforementioned EDS analysis shows that the molar ratio of Lu:W:O is 1:1.3:3.5, therefore we believe the hydrothermal product contains elements Na, Lu, W, O, and H. This will be verified by the following TG-DSC and FTIR discussion.
XRD patterns of lutetium tungstate synthesized by the hydrothermal method at 180 °C for different reaction times (a) 1 h, (b) 3 h, (c) 6 h, (d) 24 h, (e) 48 h, and (f) 72 h.

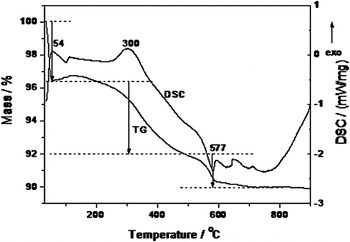
To investigate the thermal stability and phase-transformation temperature of the hydrothermal products, we used TG-DSC measurement. Figure 5 shows the TG-DSC curve of the sphere-like Eu3+-doped lutetium tungstate phosphor obtained by the hydrothermal method at 180 °C in the presence of CTAB for 72 h. There are three stages in the TG curve, the first weight loss stage (∼3.5%) with an exothermic peak at 54 °C, which may be due to the fluctuation of the device. The second weight loss stage (∼4.5%) with an exothermic peak at 300 °C corresponds to the formation of a new phase, and the third weight loss stage (∼2%) of the hydrothermal products with an endothermic peak at ∼577 °C in the DSC curve corresponds to the evaporation of coordinated water in crystal lattice. The TG-DSC result indicates that the thermal stability of the hydrothermal product is not good enough.
TG-DSC curve of the hydrothermal product obtained at 180 °C for 72 h.

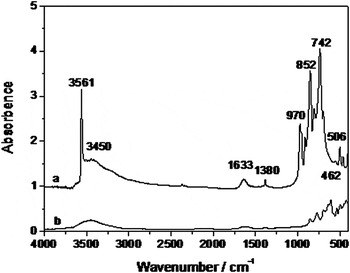
Figures 6(a) and 6(b) show the FTIR spectra of the hydrothermal products and the hydrothermal product with heat treatment at 1000 °C for 2 h, respectively. There is a broad band at 3450 cm−1 and a band at 1633 cm−1 in Figs. 6(a) and 6(b) spectra, corresponding to the surface-absorbed water and hydroxyl groups, respectively. The sharp band peaking at 3561 cm−1 [Fig. 6(a)] attributed to the O–H stretching vibration of the coordination water molecules, and the similar FTIR absorption band had been reported in calcium hydroxapatite.Reference Tas35 In Fig. 6(b), there is no existence of the band at 3561 cm−1, which means that when heating the hydrothermal product at 1000 °C, no O–H groups exist. The band at 1380 cm−1 is due to the NO3− group from lutetium and europium nitrate. The band at 970 and 852 cm−1 are due to W–O stretching vibration and a strong band at 742 cm−1 is due to the asymmetric stretching vibration of W–O–W bridges.Reference Busca36
FTIR spectra of (a) the hydrothermal products, (b) the hydrothermal product with heat treatment at 1000 °C for 2 h.

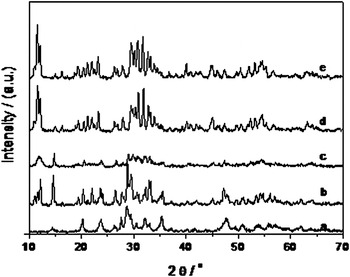
Figure 7 shows the XRD patterns of the hydrothermal products obtained at 180 °C for 72 h with a different pH value. Figures 7(a)–7(e) are the XRD patterns of products obtained with pH = 7, 8, 10, 12, and 14, respectively. When the pH value is above 7, the XRD patterns changed, i.e., the crystal structures changed and were composed of more than one phase. The result indicates that to obtain the white light phosphor, the pH should be kept at 7.
XRD pattern of the hydrothermal products obtained at different pH values of (a) 7, (b) 8, (c) 10, (d) 12, and (e) 14.

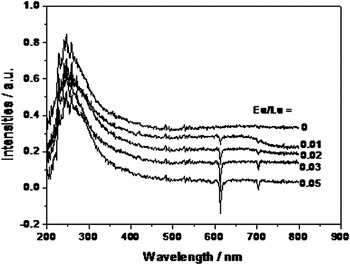
In general, the optical absorption energy of the host lattice might be obtained by measuring the diffuse reflection spectrum. Figure 8 shows the UV-visible diffuse reflectance of the products synthesized by the hydrothermal method (170 °C for 72 h) with different molar ratios of Eu3+ and Lu3+ at 0, 0.01, 0.02, 0.03, and 0.05. There is a broad absorption band range from 220 to 350 nm, peaking at about 247 nm of these spectra with different ratios of Eu3+ and Lu3+, ascribed to the charge transfer transition of O → W and O → Eu3+, which has no considerable changes when doped with the different concentrations of Eu3+. The sharp lines on the top of the broad bands are attributed to the small interaction of the excited state with the lattice. In these absorption spectra, the downward bands at 595, 613, and 703 nm are the characteristic transition of Eu3+. And with the increasing of the ratio of Eu and Lu, the intensity of the characteristic transition of Eu3+ increased, too.
UV-vis diffuse reflectance of the products synthesized by the hydrothermal method with different ratios between Eu3+ and Lu3+ at 170 °C for 72 h: 0, 0.01, 0.02, 0.03, and 0.05 without the influence of CTAB.

Figures 9(I) and 9(II) show the excitation and emission spectra of white light phosphor Eu3+-doped lutetium tungstate obtained by the hydrothermal method at 180 °C for 1, 3, 6, 24, 48, 72, and 144 h, respectively. The excitation spectra are acquired by fixing the emission wavelength at 613 nm. All the excitation spectra of the phosphor obtained at different reaction times exhibit a broad band long with sharp lines at 324, 359, 380, 392, 415, and 462 nm, respectively. The broad band appears from 220 to 290 nm with the maximum peak at 265 nm, corresponding to the O → W ligand to metal charge transfer transition. The sharp lines assign to the 7F0 → 5D4, 7F0 → 5L7, 7F0 → 5L6, and 7F0 → 5D2 transitions of Eu3+, respectively. The intensity of the excitation spectra varied regularly with prolonging the reaction time. With prolonging the reaction time, the PL intensity also increases. The PL intensity reaches the maximum value at 48 h, and then decreases.
(I) Excitation and (II) emission spectra of lutetium tungstate obtained by the hydrothermal method at 180 °C for different reaction times 1, 3, 6, 24, 48, 72, and 144 h.

All the emission spectra of lutetium tungstate obtained at different times are recorded in the range of 300 to ∼700 nm under 265-nm excitation. The emission spectra include a broad band and three narrow 5D0 → 7FJ (J = 1, 2) emission bands appearing at 467, 588, 591, and 611 nm, respectively. The broad band ranges from 350 to 600 nm, with the peak at 467 nm in the blue region, which is assigned to the O → W ligand-to-metal charge transfer states. The bands at 467, 588, 591, and 611 nm correspond to the characteristic emission of Eu3 + 5D0 → 7FJ (J = 1, 2). From the emission spectra, we can also conclude that the PL intensity increases with the prolonging of the reaction time at 48 h. After reaction for 72 h, the PL intensity decreases, especially the product obtained for 144 h, i.e., too long reaction time is not good for PL intensity. For this white light phosphor, the optimum reaction parameters are 180 °C and 48 h. The decreasing PL intensity might be due to the fact that the longer hydrothermal processing time may produce the aggregation of particles.
IV. CONCLUSIONS
In summary, the micrometer-scale Eu3+-doped white light sphere-like lutetium tungstate phosphors can be effectively fabricated via a simple and mild cationic surfactant CTAB-assisted hydrothermal method. The influences of the CTAB surfactant, pH value, reaction time, and reaction temperature have been studied on the formation, microstructure, and luminescent properties of lutetium tungstate microspheres. PL measurement indicates that lutetium tungstate microspheres show a broad O–W (CTS) transition and the characteristic transition of Eu3+ at ∼591 and ∼611 nm.
ACKNOWLEDGMENTS
The authors gratefully acknowledge the financial support from the National Science Foundation of China (No. 20971100) and Program for New Century Excellent Talents in University (NCET-08-0398).