Although Republicans picked up two seats in the US Senate, the bigger story of the 2018 US midterm elections was the “blue wave,” which granted Democratic candidates a 40-seat gain in the US House of Representatives. It was an especially strong wave by historical standards: the Democrats’ vote margin in the national vote for US House candidates was 8.6% of all votes cast across the country (Duffy, Wasserman, and Flinn Reference Duffy, Wasserman and Flinn2018) compared to a Republican advantage of 7.2% in 2010 (Cillizza Reference Cillizza2018).
This analysis considers how political advertising in those campaigns might have related to the Democrats’ success in US House races. We argue that advertising may have mattered in at least three ways. First, Democrats significantly outspent Republicans in the most competitive races, even those that leaned Republican. Second, Democrats widened the playing field since 2014, when there were far fewer races with heavy ad spending. Third, Democrats, for the first time since passing the Affordable Care Act (ACA), emphasized the issue of health care, which may have nationalized congressional campaigns around an issue that tended to advantage them over Republicans (Petrocik Reference Petrocik1996).
More broadly, we show that television ad volumes in 2018 were extremely heavy, the highest in the 20 years for which we have comparable data. This occurred despite increased spending on digital advertising, which we discuss using recently available data. Moreover, “dark money”—that is, money spent by groups that do not publicly disclose their donors—made a comeback in 2018. Democrats, who traditionally have not benefited from dark money as much as Republicans, were huge recipients in 2018.
Our data on advertising during the 2018 campaign are from the Wesleyan Media Project (WMP), which tracks both television and online advertising. WMP television data are from a commercial firm, Kantar Media/CMAG, which tracks the placement of ads on broadcast television in all 210 US media markets.Footnote 1 From these data, we know the station on which each ad aired, the time it aired, its length, and an estimate of its cost. WMP staff analyzed video of each unique ad, coding it on more than 50 different characteristics, including the tone of the ad, whether it was primarily about policy or candidate characteristics, and the specific issues mentioned.Footnote 2 We also rely on digital-ad-spending data reports that were released by both Facebook and Google and compiled by WMP.Footnote 3
Our research, therefore, provides a first post-mortem on the use of political advertising in 2018, including a comparison of television to digital advertising totals.
UNDERSTANDING DEMOCRATIC HOUSE SUCCESSES
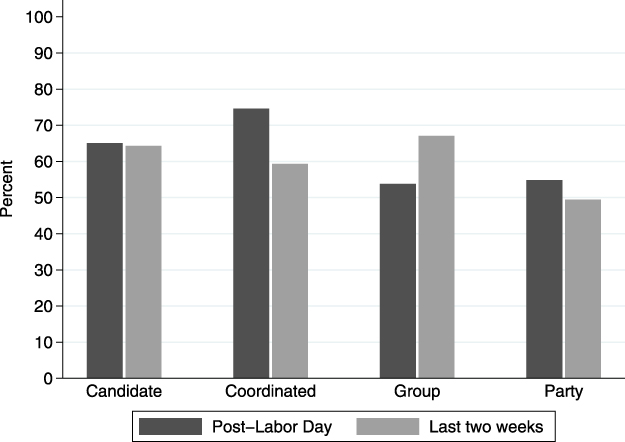
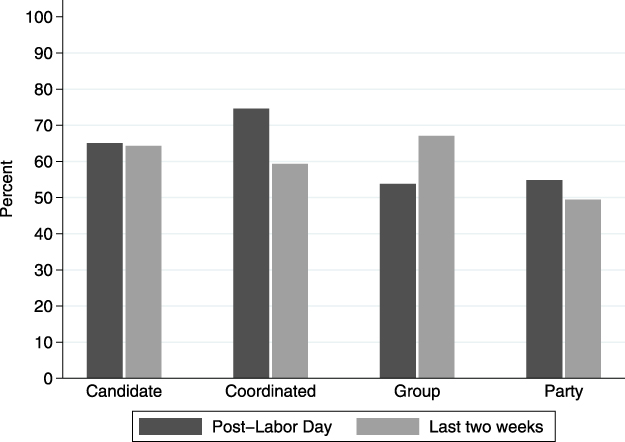
One key to persuasion is exposing voters to more of your side’s messages than the other side’s messages (Zaller Reference Zaller, Mutz and Sniderman1996). On this score, Democrats did well in 2018 on television. All told, 60.7% of ad spending in US House races between Labor Day and Election Day was by Democrats—either candidates, a party organization, or a Democratic-affiliated group. (We limit this discussion to US House races. The online appendix provides comparable analysis for US Senate races.) This Democratic advantage was even greater in the final two weeks of the race, when pro-Democratic sponsors financed 63.5% of ad spending. Figure 1 shows that the Democratic advantage held regardless of sponsor type—with one exception. For example, in both the post–Labor Day period and in the final two weeks of the campaign, Democrats sponsored roughly 65% of ad spending by candidates. They accounted for more than 70% of spending coordinated between candidates and a party in the post–Labor Day period, and they accounted for more than two thirds of the spending by outside groups in the last two weeks of the campaign. The one exception to Democratic dominance overall occurred in the last two weeks of the campaign in advertising by party organizations, in which the GOP sponsored slightly more than half of that spending in US House races.
Percentage of Democratic Spending in US House Races by Sponsorship
Sources: Kantar Media/CMAG with analysis by the Wesleyan Media Project.
Notes: Candidate ads are sponsored directly by the candidates; coordinated airings are those sponsored jointly by the candidate and party; group airings are those sponsored by outside groups intended to benefit candidates; and party airings are those sponsored by the political-party committees. Post–Labor Day covers the September 4 through November 6, 2018, period; the last two weeks covers the October 24 through November 6, 2018, period.
There certainly is a vibrant debate in the field about the persuasive and mobilizing capacities of campaigns. Evidence supports the contention that ad imbalances either persuade or mobilize (Gerber et al. Reference Gerber, Gimpel, Green and Shaw2011; Huber and Arceneaux Reference Huber and Arceneaux2007; Ridout and Franz Reference Ridout and Franz2011); others argue that campaign efforts are minimal or ineffectual (Kalla and Broockman Reference Kalla and Broockman2017). Although we remain sympathetic to the former, in either case, ad imbalances are a precondition for any persuasion or mobilization effects, however large or long-lasting. Ultimately, the big picture in 2018 was a message environment dominated by Democrats.
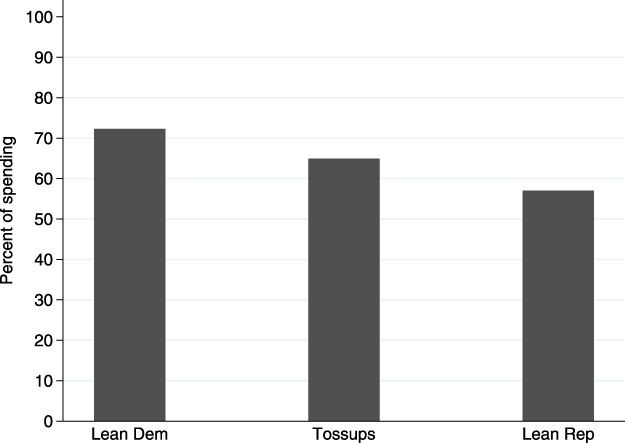
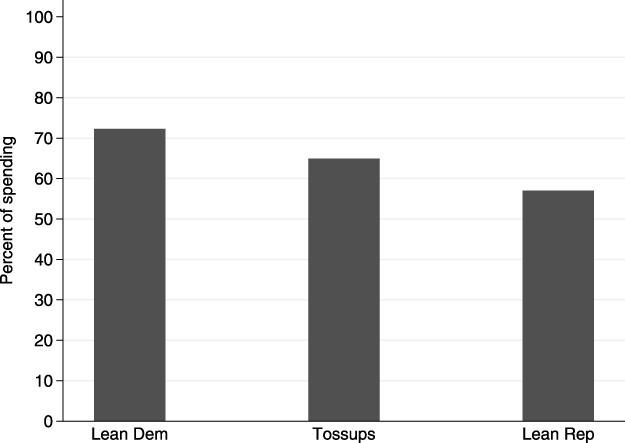
In assessing the potential impact of political advertising in US House races, we also need to know where those ads aired. We examined the share of ad spending on television by pro-Democratic and pro-Republican sponsors in three types of US House races: those rated by the Cook Political Report as “lean Democrat,” pure “tossups,” and “lean Republican.”Footnote 4 Figure 2 shows that spending on TV ads by pro-Democratic sponsors was more prevalent in all three types of races in the last two weeks of the campaign. Democratic sponsors accounted for 72.3% of ad spending in the “lean-Democratic” races, 64.9% in the “tossup” races, and 57.0% in the “lean-Republican” races. This lopsided distribution of ad spending may explain in part why Democrats won 21 of 30 tossup races and all of the lean-Democratic races. Clearly, however, other factors also were in the party’s favor, including its ability to recruit high-quality candidates and raise the money necessary for placing those ads.
[S]pending on TV ads by pro-Democratic sponsors was more prevalent in all three types of races in the last two weeks of the campaign. Democratic sponsors accounted for 72.3% of ad spending in the “lean-Democratic” races, 64.9% in the “tossup” races, and 57.0% in the “lean-Republican” races.
Percentage of Democratic Spending in US House Races by Competitiveness (Final Two Weeks)
Sources: Kantar Media/CMAG with analysis by the Wesleyan Media Project for airings and the Cook Political Report for competitiveness ratings.
Notes: “Lean Dem” races are those deemed by the Cook Political Report as slightly favoring the Democratic candidate; “Lean Rep” races are those deemed to slightly favor the Republican candidate; and “Tossups” do not favor either candidate. Ratings were issued on October 30, 2018. Spending data cover the final two weeks of the campaign (October 24 through November 6, 2018).
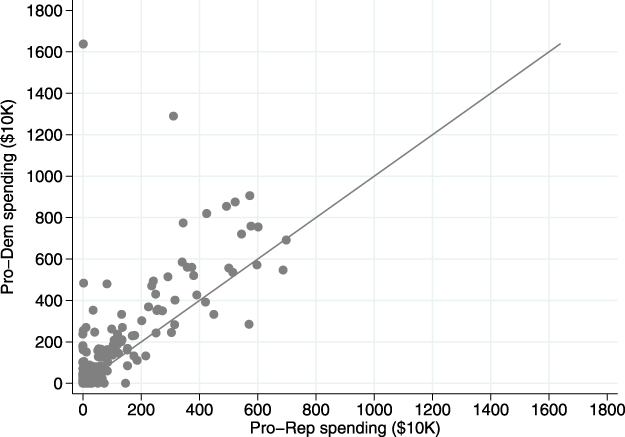
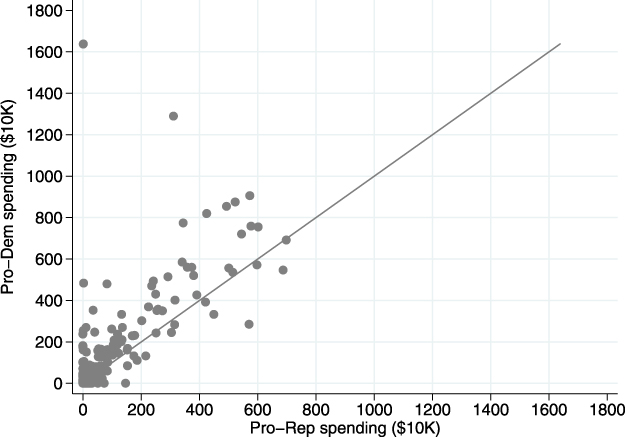
There is an even closer look at how House Democrats were advantaged by plotting pro-Democratic spending on broadcast television ads against pro-Republican spending in each race during the post–Labor Day period (figure 3). The x-axis shows pro-Republican spending (in units of $10,000); the y-axis shows pro-Democratic spending. Points above the line represent races in which pro-Democratic spending was higher; points below the line represent races in which pro-Republican spending was higher. In 135 of the 218 races in which there was television advertising (62%), pro-Democratic spending was higher.
Spending on Television Ads in US House Races by Party of the Benefiting Candidate
Sources: Kantar Media/CMAG with analysis by the Wesleyan Media Project.
Notes: Pro-Dem spending includes all ads benefiting Democratic candidates and Pro-Rep spending includes all ads benefiting Republican candidates, including those sponsored by candidates, the party, coordinated airings between the candidate and party, and outside groups from September 4 (the day after Labor Day) through Election Day 2018.
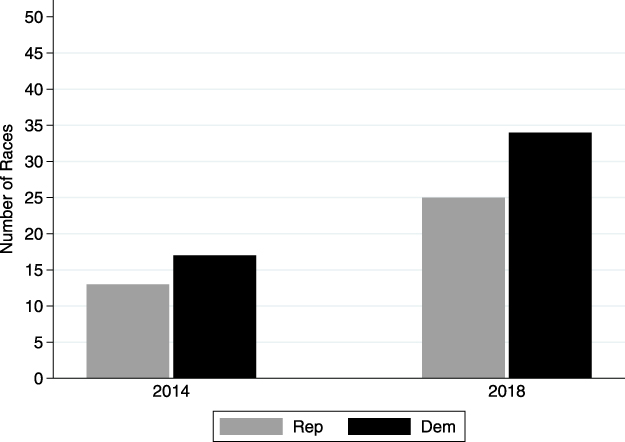
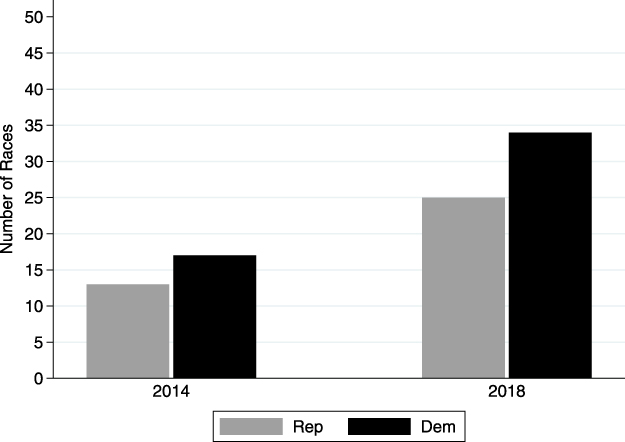
Not only did Democrats generally out-advertise Republicans, they also put many more races into play than in the previous midterm. Figure 4 shows the number of US House races, categorized by party, in which candidates, parties, and groups combined spent more than $3 million on television advertising—a healthy sum that should allow any candidate’s message to be disseminated. Whereas only 17 Democratic candidates for the US House were backed by at least $3 million in advertising in 2014, 34 were backed in 2018. The number of races in which spending by Republicans increased also was substantial, from 13 in 2014 to 25 in 2018.
US House Races with More Than $3 Million in Television-Ad Spending
Sources: Kantar Media/CMAG with analysis by the Wesleyan Media Project.
Notes: “Dem” refers to the number of Democratic candidates and “Rep” refers to the number of Republican candidates who were backed by at least $3 million in ad spending in each cycle during the post–Labor Day period (September 2 through November 4, 2014, and September 4 through November 6, 2018).
Democrats Were Also Laser-Focused on One Issue: Health Care
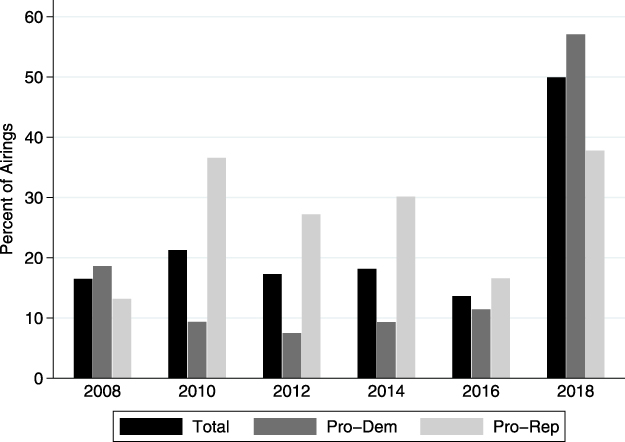
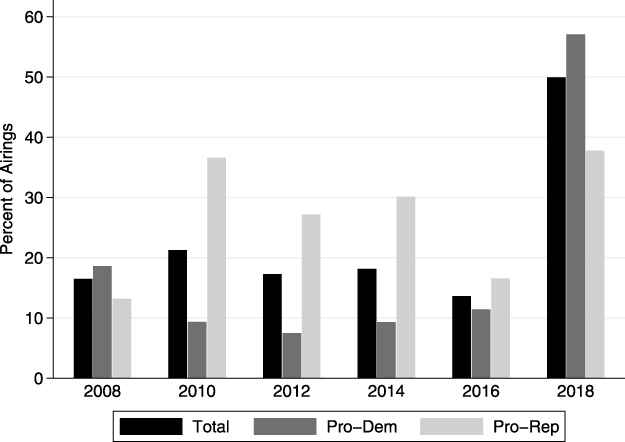
Figure 5 shows the percentage of total ads aired by pro-Democratic and pro-Republican sponsors in US House races in the post–Labor Day period that mentioned health care. More than half of Democratic ads in 2018 mentioned the issue, which is a striking change in strategy from prior years in which many Democrats shied away from the issue—perhaps because supporting passage of the ACA may have cost many their seats (Nyhan et al. Reference Nyhan, McGhee, Sides, Masket and Greene2012). Republicans, by contrast, devoted much of their advertising in prior cycles to attacking the ACA (Gollust et al. Reference Gollust, Barry, Niederdeppe, Baum and Fowler2014). However, Republicans’ inability to repeal the law and their attempts to rescind some of the most popular provisions of the ACA in 2017 changed the calculus for both parties. Democrats were happy to run ads criticizing Republican votes to strip protections for preexisting conditions, among other issues. That said, Republicans were not silent on health care; nearly 40% of Republican ad airings in US House races mentioned the issue, with many of those ads using a “government-intervention” frame (Joseph et al. Reference Joseph, Lepelstat, Russell and Sullivan2018).
Percentage of Ads in US House Races that Mention Health Care
Sources: Kantar Media/CMAG with analysis by the Wesleyan Media Project.
Notes: “Pro-Dem” includes all ads benefiting Democratic candidates; “Pro-Rep” includes all ads benefiting Republican candidates for the US House, including those sponsored by candidates, the party, coordinated airings between the candidate and the party, and outside groups. “Total” includes pro-Democratic, pro-Republican, and any third-party airings. Percentages are calculated by dividing the total number of ads mentioning health care or the ACA/Obamacare (as coded by the Wesleyan Media Project or the Wisconsin Advertising Project) by the total number of ads for each type from September 4 to Election Day for each year.
RECORD VOLUMES OF ADVERTISING
Political advertising on television in 2018 also was notable for sheer volume. In fact, there were more ad airings in federal races in 2018 than in any previous congressional campaign for which there are data: 2.43 million ad airings between January 1, 2018, and Election Day. This is a 60% increase from the 1.52 million airings in the same set of races in 2016 and a 55% increase from the 1.57 million airings in 2014.
One explanation for the increase in volume is the large number of competitive races in 2018, which typically draw more advertising than noncompetitive races (Goldstein and Freedman Reference Goldstein and Freedman2002). Moreover, the number of candidates competing for their party nominations for seats in the US House was much higher than in the past. In fact, 2,009 candidates ran in US House primaries in 2018—a substantial increase from the 1,443 who ran in 2014 and the 1,550 who ran in 2016 (Kamarck and Podkul Reference Kamarck and Podkul2018). Most of the increase was on the Democratic side.
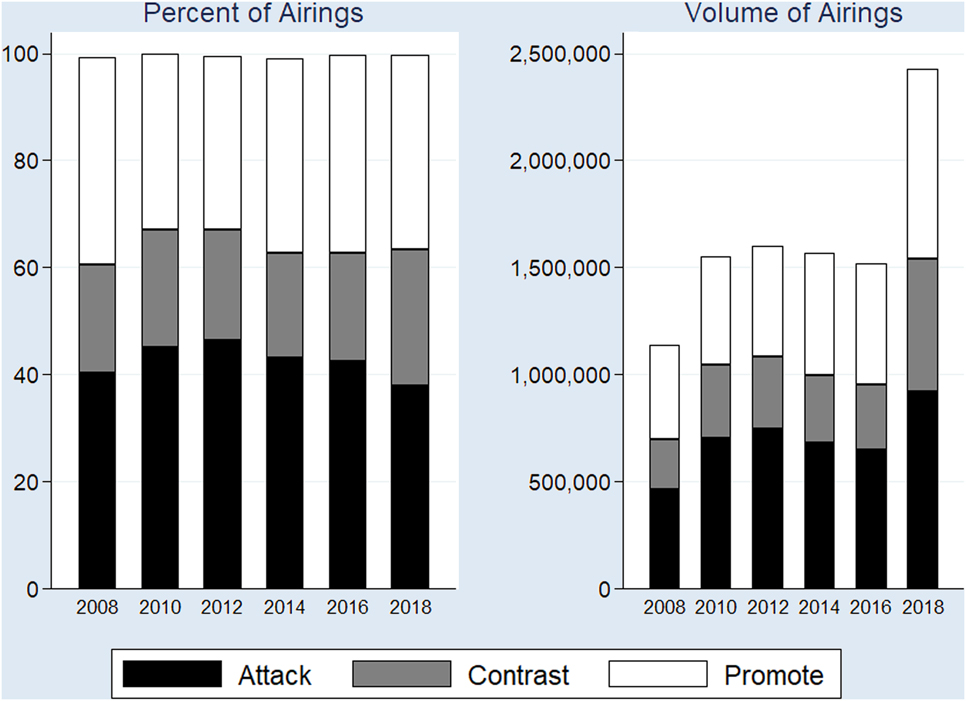
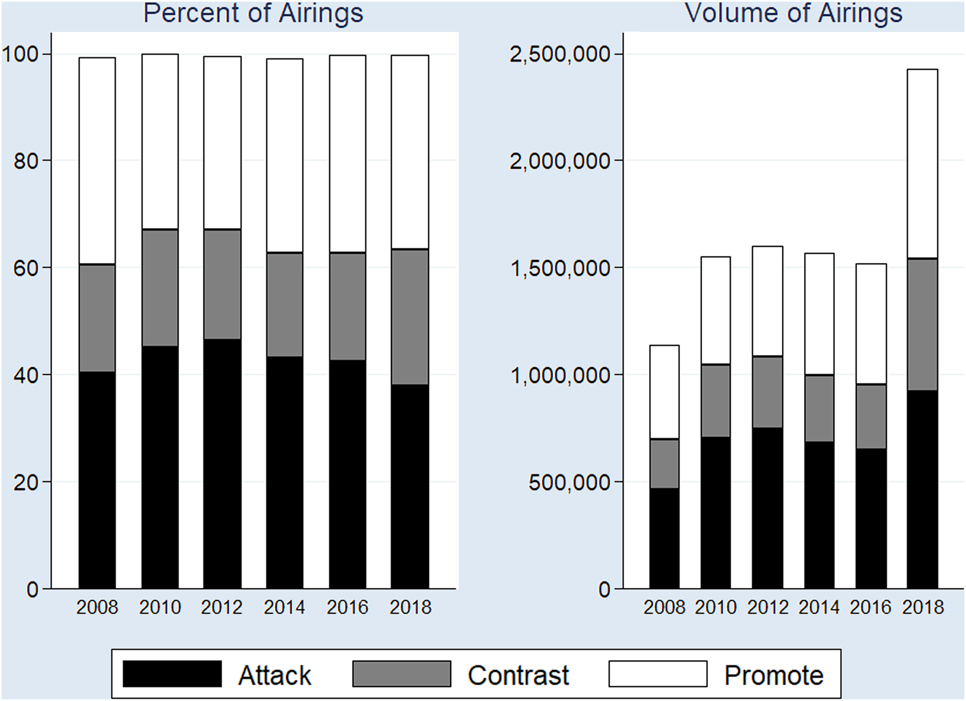
Figure 6 displays the tone of advertising in US House and Senate races in the past decade as a proportion of all ads on air (left panel) and in volume of ad airings (right panel). As shown in the left panel, whereas the proportion of pure attacks has decreased slightly, the number of ads that mention an opponent (i.e., contrast and attack ads combined) has held steady between 60% and 67%. In other words, the majority of ads that citizens encounter contain a negative reference to an opponent candidate. The right panel shows the total volume of ads in each year (indicated by the height of the bar) and the number of ads in each tone category. Although 2018 was not a record year for negativity in terms of proportion, the right panel in figure 6 makes clear that the sheer volume of negative and contrast advertising on television—which was much greater than in prior cycles—may have made the campaign feel much more negative than in prior years.
Although 2018 was not a record year for negativity in terms of proportion, the right panel in figure 6 makes clear that the sheer volume of negative and contrast advertising on television—which was much greater than in prior cycles—may have made the campaign feel much more negative than in prior years.
Tone of Ads in US House and US Senate Races, by Percentage and Volume
Sources: Kantar Media/CMAG with analysis by the Wesleyan Media Project.
Notes: Attack ads are those that solely mention the targeted candidate (other than the paid-for by line); promotional ads are those that solely mention the favored candidate; and contrast ads are those that mention both favored and targeted candidates as coded by the Wesleyan Media Project or the Wisconsin Advertising Project. Percentage and volume figures are from January 1 to Election Day for each year.
DIGITAL-AD SPENDING
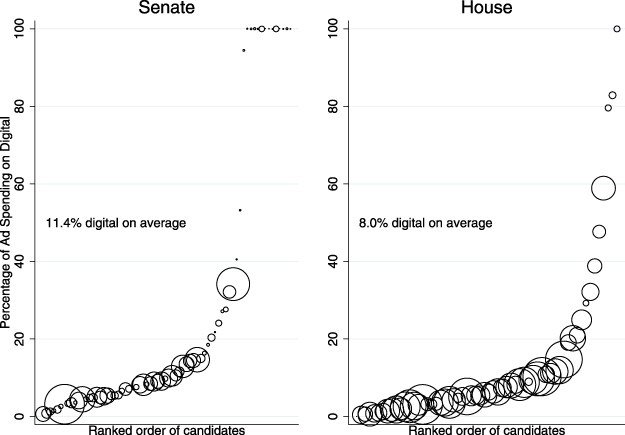
How much of a role did digital advertising play in 2018? We estimate that in competitive US House races—those rated “tossups” by the Cook Political Report—candidates spent an average of 8% of their total ad spending on digital ads (i.e., Facebook and Google) between May and Election Day. This estimate comes with a caveat: Facebook and Google (including YouTube) are by far the largest social-media platforms for the placement of digital advertising—one consultant called Facebook an “800-pound gorilla” (Kreiss, Lawrence, and McGregor Reference Kreiss, Lawrence and McGregor2018)—but they are not the only ones. For instance, promoted posts on Twitter are not included in these spending figures; neither are ads placed directly on other websites. That said, as Hindman (Reference Hindman2018, 4) noted, “[a]s of mid-2016, Google and Facebook together combined for more than 73% of digital advertising dollars in the United States.” In other words, spending on the two platforms accounts for most of online spending.
Figure 7 shows the distribution of digital spending across candidates. The majority spent less than 10% of their advertising budgets on digital ads, but some spent significantly more. In general, candidate digital spending was high on a percentage basis in those locations where using television advertising was particularly inefficient. For instance, three candidates who spent the greatest percentage of total ad dollars on digital advertising (i.e., Gil Cisneros, Dana Rohrabacher, and Young Kim) were running for US House seats in the Los Angeles media market, one of the most expensive in the country. In addition to being expensive, it is inefficient to air ads there because media-market and congressional-district lines do not coincide. In fact, US House candidates who air broadcast television ads in Los Angeles would reach people living in several other congressional districts—people who could not vote for the sponsoring candidate. To summarize, digital advertising—which can be finely targeted—is more attractive in those races where media markets and district boundaries do not align.
Digital Advertising as Percentage of Ad Spending in US House and US Senate Races
Sources: Kantar Media/CMAG (TV), Facebook, and Google with analysis by the Wesleyan Media Project.
Note: The size of the bubble is scaled by total spending on TV/Facebook/Google for the period from May 1 through November 6, 2018. Only candidates running in US House races ranked “tossups” are included.
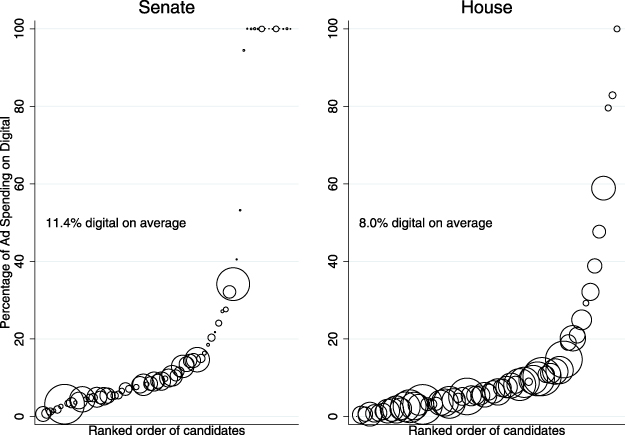
We found slightly higher spending on digital advertising as a percentage of total ad spending in US Senate contests. On average, 11.4% of ad spending was on Facebook and Google platforms. Again, there was a considerable range across candidates, with several US Senate candidates spending 100% of their ad budget on digital advertising. These candidates tended to fall into two different categories. The first consisted of candidates who were incumbents certain to win, such as Bernie Sanders in Vermont, Elizabeth Warren in Massachusetts, Kirsten Gillibrand in New York, and Tom Carper in Delaware. Given their incredible leads in the polls, there was no need for them to spend money on television. Digital ad spending by these candidates (Carper is the exception) probably focused more on creating a potential donor list for a presidential bid than persuading voters in their home state. The second category of candidates who spent all of their ad budget on digital advertising were sure losers—candidates who could not afford to spend on television advertising. Candidates in this category included Rob Arlett in Delaware, Ron Curtis in Hawaii, Tony Campbell in Maryland, and Mick Rich in New Mexico.
INTEREST GROUPS IN 2018
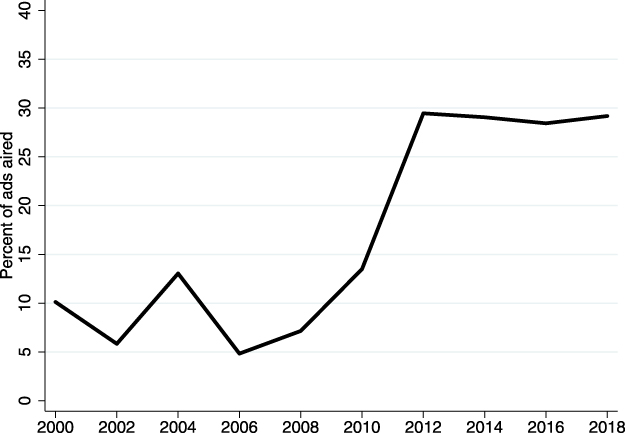
Outside-group advertising was a major presence in the 2018 elections on television. Outside groups include traditional political-action committees (PACs), Super PACs, 501c4 not-for-profits, and other group types but not formal party organizations such as the Democratic National Committee. Figure 8 shows the percentage of television ads airing in federal races sponsored by outside groups. Outside-group spending was higher in 2018 than in any other year in the time series but only slightly. In fact, since 2012, outside-group advertising has comprised slightly less than 30% of all federal-related political advertising, including presidential elections. This 30% average, however, is somewhat misleading because the share of advertising by outside groups is even higher when our analysis is limited to the fall of the election year and the most competitive races.
Outside-Group Advertising in Federal Races, 2000–2018
Sources: Kantar Media/CMAG and the Wisconsin Advertising Project with analysis by the Wesleyan Media Project.
Notes: Figures are from all available dates in each year to Election Day. The numerator is the number of ads aired by outside groups. It is divided by the total number of ads that aired across all sponsors in federal races in each year.
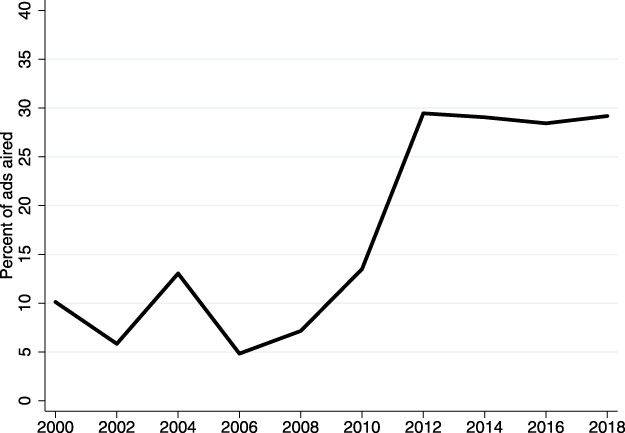
In tandem with the increase in spending by outside groups, advertising by formal party organizations also has shrunk in recent cycles. In 2018, party independent and coordinated advertising comprised only one in every 10 ads aired in the full cycle. In previous cycles, party efforts in federal races often comprised between 20% and 30% of all ads on broadcast television. In 2000, for example, including those in presidential and congressional elections, parties sponsored more than one in every three ads aired.
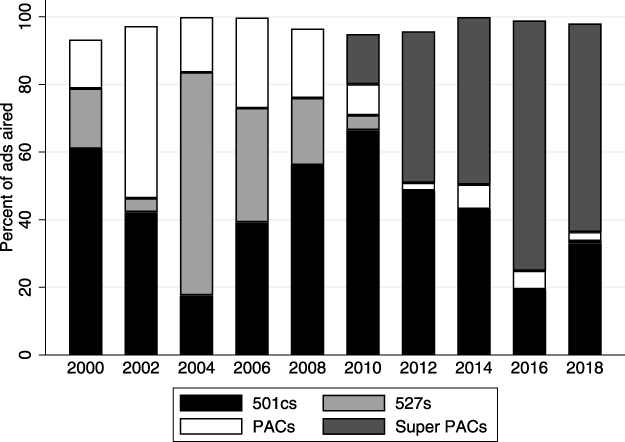
Figure 9 shows the percentage of group-sponsored ads aired in federal races classified by sponsoring-group type. We categorized each group as one of four main types: traditional PACs, Super PACs, 501cs, and 527s (a few minor groups included LLCs, Carey PACs, and unclassified “coalitions”).Footnote 5
Percentage of Group-Sponsored Ad Airings by Group Type in Federal Races
Sources: Kantar Media/CMAG with analysis by the Wesleyan Media Project. Group classifications are from the Center for Responsive Politics.
Notes: Figures are from all available dates in each year to Election Day. Ads sponsored by multiple groups across categories are not counted in any category. Not all groups fall into these four categories; that is, percentages do not always total 100.
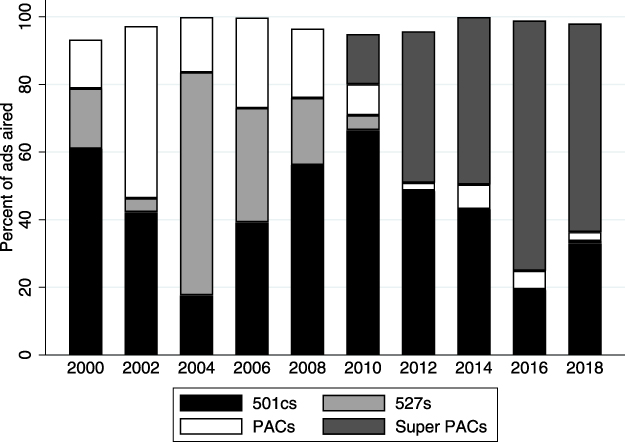
We first note the resurgence of advertising from 501c groups in 2018. These tax-exempt not-for-profits often are called “dark-money” groups because they are not required to disclose publicly their donors. There also are no limits on contributions to these groups, making them ideal for wealthy donors interested in influencing electoral politics. Dark-money groups accounted for about a third of group-sponsored ads in 2018, an increase of approximately 20% in 2016. Since 2010, the main story has been the increase of Super PACs, a legal invention that is the direct result of Citizens United. These groups were created to collect unlimited funds for the explicit purpose of aiding or attacking federal candidates.
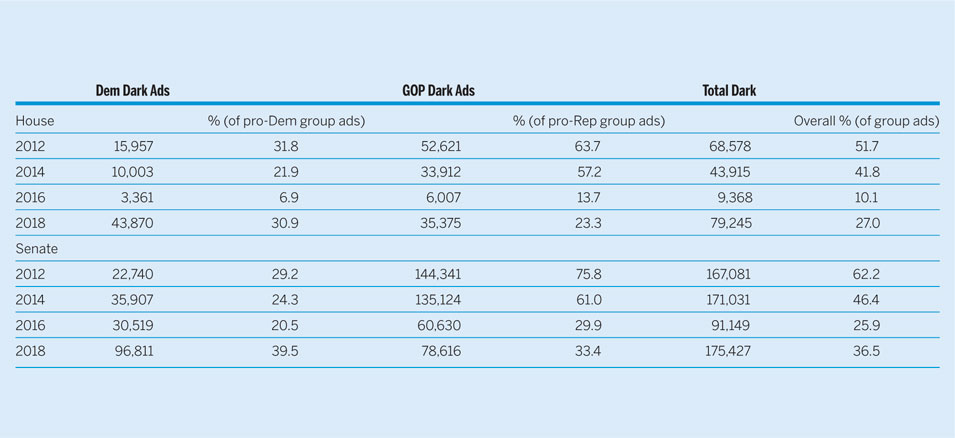
The share of television ads sponsored by dark-money groups increased significantly in 2018, as did the volume of their ads. Table 1 shows the number of dark-money ads aired in congressional races since 2012, as well as the partisan sponsorship of that spending. Importantly, the volume of ads sponsored by dark-money groups in congressional races was higher in 2018 than in any of the three previous cycles. In fact, more dark-money ads aired in US House and Senate races in 2018 than even in 2012, when more than half of the group-sponsored ads were from dark-money sources.
The share of television ads sponsored by dark-money groups increased significantly in 2018, as did the volume of their ads.
Dark Money in Congressional Elections, 2012–2018
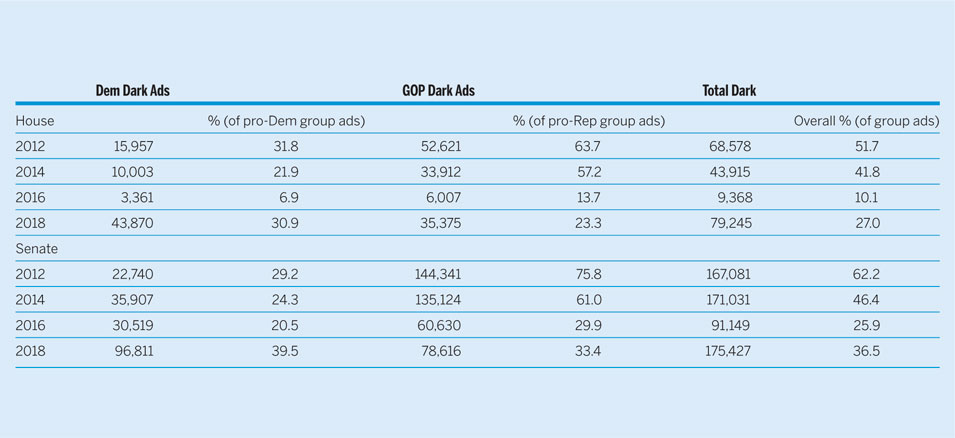
Sources: Kantar Media/CMAG with analysis from the Wesleyan Media Project. Group classifications from the Center for Responsive Politics.
Notes: For ads aired from January 1 (off year) to Election Day.
All 210 media markets for broadcast television buys are included, as well as any national cable ads.
Table 1 also indicates which party benefited from dark money. Between 2012 and 2016, dark money tilted pro-Republican. For example, 57% of pro-GOP outside-group television ads in US House races in 2014 were from dark-money groups; this amounted to more than 33,000 airings in the cycle. Only 22% of pro-Democratic group spending was from nondisclosing sources, totaling slightly more than 10,000 airings. In both US House and Senate races in 2012, 2014, and 2016, more dark money benefited Republicans than Democrats, often by significant amounts. In 2018, the pattern reversed: in terms of both share and volume, more dark-money ads aired on behalf of Democratic congressional candidates. For example, nearly 40% of the group-sponsored ads aired on behalf of Senate Democrats in 2018 were from dark-money sponsors, which was also nearly triple the volume for those candidates in 2014.
However, these percentages consider only those ads directly sponsored by dark-money groups. Dark-money spending can show up in other ways, such as through the funding of Super PACs. We label these Super PACs that accept contributions from dark-money groups as partial-disclosure groups. In 2018, they were quite common: 42% of group spending in US House races in 2018 was from partial disclosure groups compared to 25% in 2016; 50% of outside-group advertising in US Senate races in 2018 was from partial-disclosure groups compared to only 20% in 2016.
CONCLUSION
Our analysis of broadcast television advertising during the 2018 campaign provides an important context for understanding 2018’s “blue wave.” First, in a majority of US House races, there was more pro-Democratic than pro-Republican ad spending—and this was true in the “lean-Democratic,” “tossup” and “lean-Republican” race categories. Second, the playing field in 2018 was much wider than in the past, with an increased number of US House candidates backed by more than $3 million in ad spending. Third, there was one theme that united pro-Democratic advertising: health care. Fourth, contrary to the narrative that advertising on television is declining, there was a record number of television ads aired in the 2018 midterms, whereas digital ad spending still constituted a small percentage of overall advertising spending for most candidates’ campaigns. Fifth, there was a healthy volume of outside-group activity in 2018, with dark-money groups increasing their involvement—especially in support of Democratic candidates.
It is risky to speculate about how political advertising in 2020 will look, especially given the unexpected findings from 2018—that is, sharp increases in the volume of television advertising and the reversal of the decline in dark-money spending. Much may depend on whether high levels of donor enthusiasm in 2018 continue into the 2019–2020 election cycle because the scope of advertising efforts depends highly on the availability of money to pay for them.
SUPPLEMENTARY MATERIAL
To view supplementary material for this article, please visit https://doi.org/10.1017/S1049096519001240.
ACKNOWLEDGMENTS
We thank Laura Baum, Dolly Haddad, Wesleyan’s Quantitative Analysis Center, and numerous undergraduate students who made our real-time tracking possible. The Wesleyan Media Project gratefully acknowledges support from the John S. and James L. Knight Foundation and Wesleyan University. The views presented herein are solely those of the authors.