1 Introduction
In many alpine regions, temporal variability of glacier discharge is of major importance for hydropower, flood control and water management. Although there have been abundant studies with the aim of simulating snow-melt induced runoff (Kirnbauer and others, 1994), surprisingly few studies have focussed specifically on the modelling of glacial discharge. These have tended to use statistical or simple temperature-index methods to predict meltwater contribution to discharge (Nilsson and Sundblad, 1975; Lundquist, 1982; Braun and Aellen, 1990). Since the glacial discharge regime is characterized by pronounced diurnal cycles, subdiurnal time steps are important to predict peak discharges in proglacial streams. A distributed hourly energy-balance model has been coupled to a linear reservoir model by Baker and others (1982) and Mader and Kaser (1994) in order to simulate glacier discharge. However, the former model neglected precipitation, and the latter included only a crude, predefined spatial clement. Surface energy-balance studies have tended to apply some form of bulk approach to determine the turbulent fluxes, using measurements of air temperature, humidity and wind speed at one level (see e.g. Braithwaite, 1995; Arnold and others, 1996). Often, the applied transfer coefficients or roughness lengths are taken from other studies due to the difficulties involved in deriving these quantities. As calculated energy balances have been found to be highly sensitive to their choice (Munro, 1989), errors may occur, especially in areas where the turbulent fluxes make a significant contribution to surface melt energy.
The purpose of this paper is twofold. First, we describe a discharge model which calculates hourly melt at each cell of a digital elevation model using a surface energy-balance model. Calculated meltwater and rain are then routed through the glacier by three parallel linear reservoirs. Emphasis is placed on the question of applicability of the linear reservoir approach in accounting for the specific hydrological features of a valley glacier. Secondly, two different para-meterizations of the turbulent fluxes are compared with respect to their impact on simulated discharge.
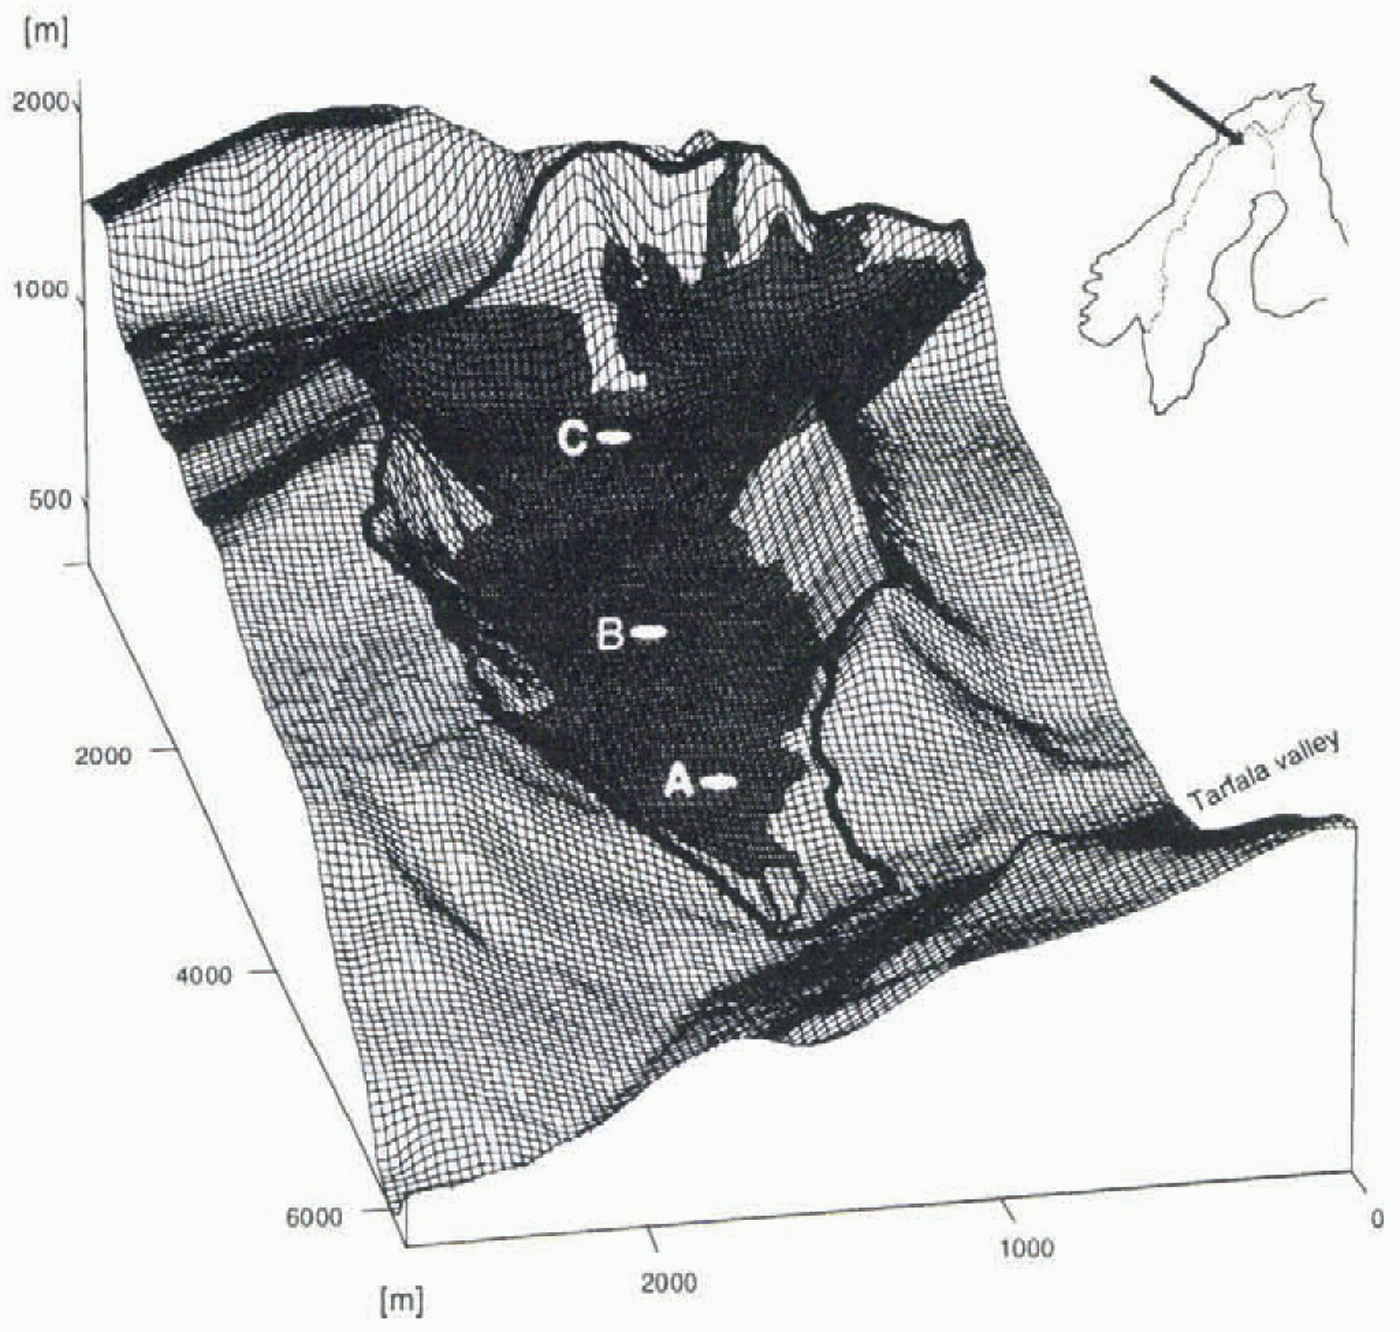
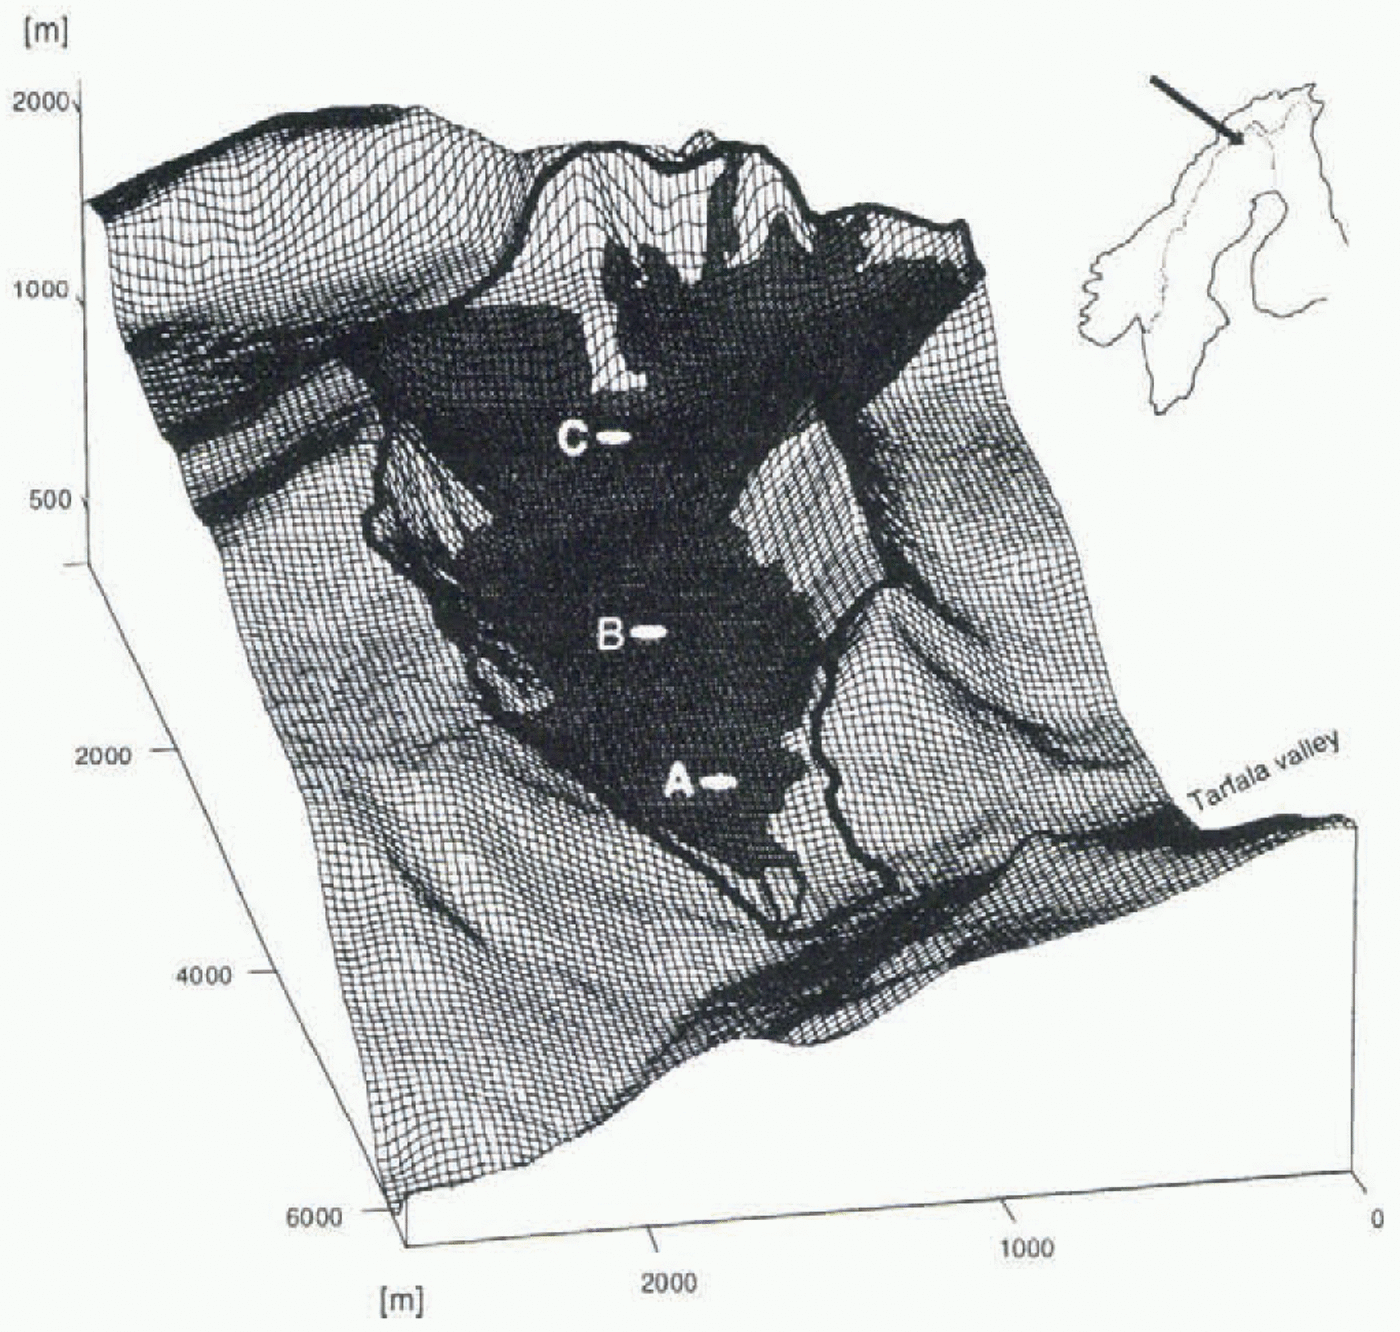
The model is applied to Storglaciären during two melt seasons using a 30 m resolution digital elevation model (Schneider, 1993; Fig. 1). Storglaciären is a small glacier (3 km2) in Swedish Lappland (67°55’ N, 18°35’ E). The drainage basin is 4.8 km2, ranging in elevation from 1120 to 2100 m a.s.l., of which 70% is glacierized. Storglaciären is drained by two principal streams, Nordjåkk and Sydjâkk, which are braided river sytems emerging from numerous locations along the glacier snout before becoming channelized into distinct streams a few hundred metres below the terminus. The rocks underlying the glacier are relatively impermeable to water (Andreasson and Gee, 1989).
2 Data Collection
As part of a comprehensive glacio-meteorological programme, several automatic weather stations were operated on Storglaciären (Fig. 1) during the melt seasons of 1993 and 1994 (Hock and Holmgren, 1996). Data collected at the main stations (B) close to the equilibrium-line altitude were taken to drive the model. Required meteorological input data for the model are screen-level air temperature, relative humidity, wind speed, global radiation, reflected shortwave radiation, net radiation and precipitation.
Glacial discharge was monitored approximately 300 m downstream of the glacier terminus. Mechanical stage recorders attached to a buoy floating in a plastic tube were installed at weirs on Nordjåkk and Sydjâkk. Water level was recorded on 8 d charts, which were digitized at hourly intervals. The stage–discharge relationships for both streams were determined by means of 42 and 32 discharge measurements at Nordjåkk and Sydjåkk, respectively, using the salt
Drainage basin of Storglaciären based on the 30 m resolution digital terrain model established by Schneider (1993). The black line delimits the drainage basin. A, B and C denote the locations of the climate stations during the melt seasons of 1993 and 1994.
dilution technique (Hock and Schneider, 1995). The relationship is well established for discharges up to approximately 2 m3 s–1 on Nordjåkk and 1 m3 s–1 on Sydjåkk. For flood flows beyond these ranges, the relationships have not been verified.
3 Model Description
3.1. Surface energy balance
Ice and snow mell is calculated using a simple surface energy-balance model. The energy available for melt, Q M, is obtained from

where G is global radiation, α is the albedo, L Net is the net long-wave radiation, Q H is the sensible heat flux, Q L is the latent heat flux and Q R is the energy supplied by rain. The heat flux in the ice or snow is assumed to be small (Hock and Holmgren, 1996), and thus neglected. Energy fluxes directed towards the surface are defined positive. The energy for melt is converted into water equivalent by using the latent heat of fusion.
When extrapolating short-wave radiative fluxes in mountainous regions, the added effect of topographic shading and slope and azimuth angle on radiation is of crucial importance. Thus, for each grid cell slope and aspect, and for every time step the shading due to surrounding topography, are determined. Global radiation is distributed to each grid cell using both the measurements of global radiation from the climate station and the calculated clear-sky direct radiation on the inclined surface I. The latter is obtained by

where I 0 is the solar constant (1368 Wm–2), ф is the atmospheric clear-sky transmissivity (assumed to be 0.75), P is atmospheric pressure, P 0 is mean atmospheric pressure at sea level, Z is the local zenith angle, and θ is the angle of incidence between the normal to the grid slope and the solar beam (Oke, 1987). If the grid point considered is shaded, I is sei to zero. Due to a lack of continuous cloud-cover data, an explicit separation of global radiation into direct and diffuse components was not applicable. We propose the following procedure, that does not require any cloud-cover data. The combined effect of clouds on global radiation, i.e. a decrease in direct radiation and a relative increase in diffuse radiation, is taken into account by distinguishing four cases, depending on whether or not the climate station and the grid point to be calculated are shaded under clear-sky conditions, shading only occurring due to surrounding topography: 1.!Both the climate station and the grid point to be calculated are in the sun under clear-sky conditions: Global radiation G at the grid point is obtained by
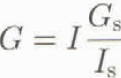
where I and I s are the clear-sky direct radiation at the grid point and the climate station, respectively, using Equation (2), and G s is the global radiation from the climate station. The assumption in this case is that the ratio of global radiation and potential direct radiation (G s/I s) is constant over the entire area (Escher-Vetter, 1980). The ratio (G s/I s) will vary from a maximum under clear-sky conditions to a minimum in overcast conditions.
2.The grid point is in the sun, but due to surrounding topography the climate station is in the shade: The ratio G s/I s is no longer defined (direct radiation at the climate station is zero). We apply Equation (3) using the last ratio G s/I s before the station became shaded. Cloud conditions are assumed to remain constant during this period of time. However, the error introduced by this assumption is considered small, because this case most often occurs when large zenith angles dominate and global radiation tends to be small.
3.Both the climate station and the grid point are shaded by surrounding topography: There is no direct radiation, but only diffuse radiation at both grid points. Diffuse radiation is assumed to be invariant over the area. Hence, global radiation at the grid point is set to measured global radiation.
4.The grid point is in the shade, but the climate station is in the sun: There is both direct and diffuse radiation at the climate station but only diffuse radiation at the grid point. This is approximated using a fixed percentage of 15% (Konzelmann and Ohmura, 1995) of the clear-sky direct radiation at the grid point, calculated by Equation (2). This must be considered a minimum value, as the effect of clouds is neglected.
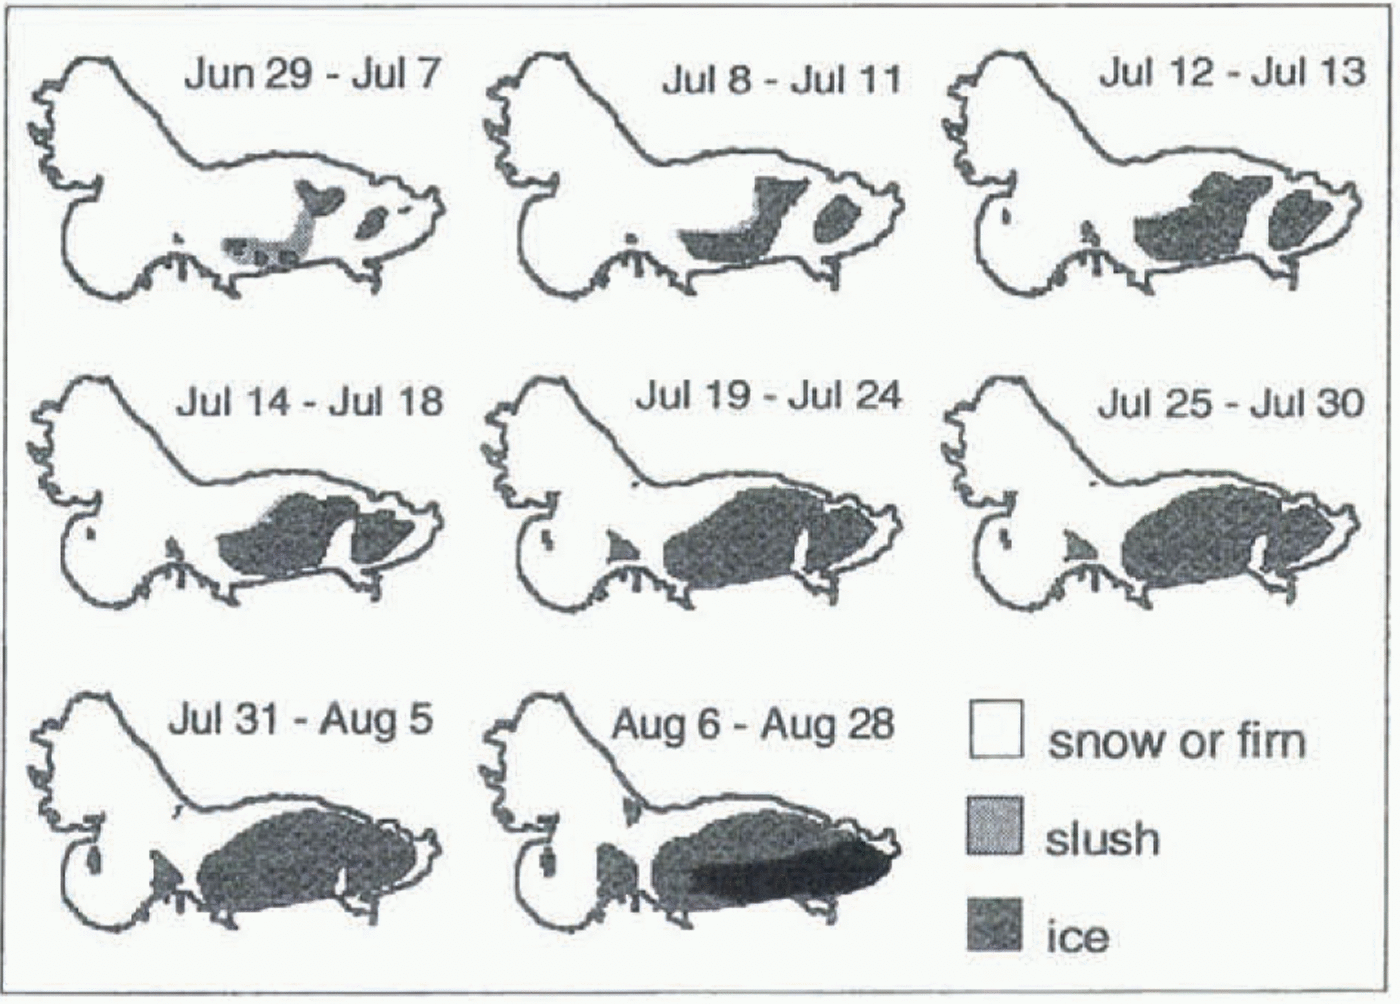
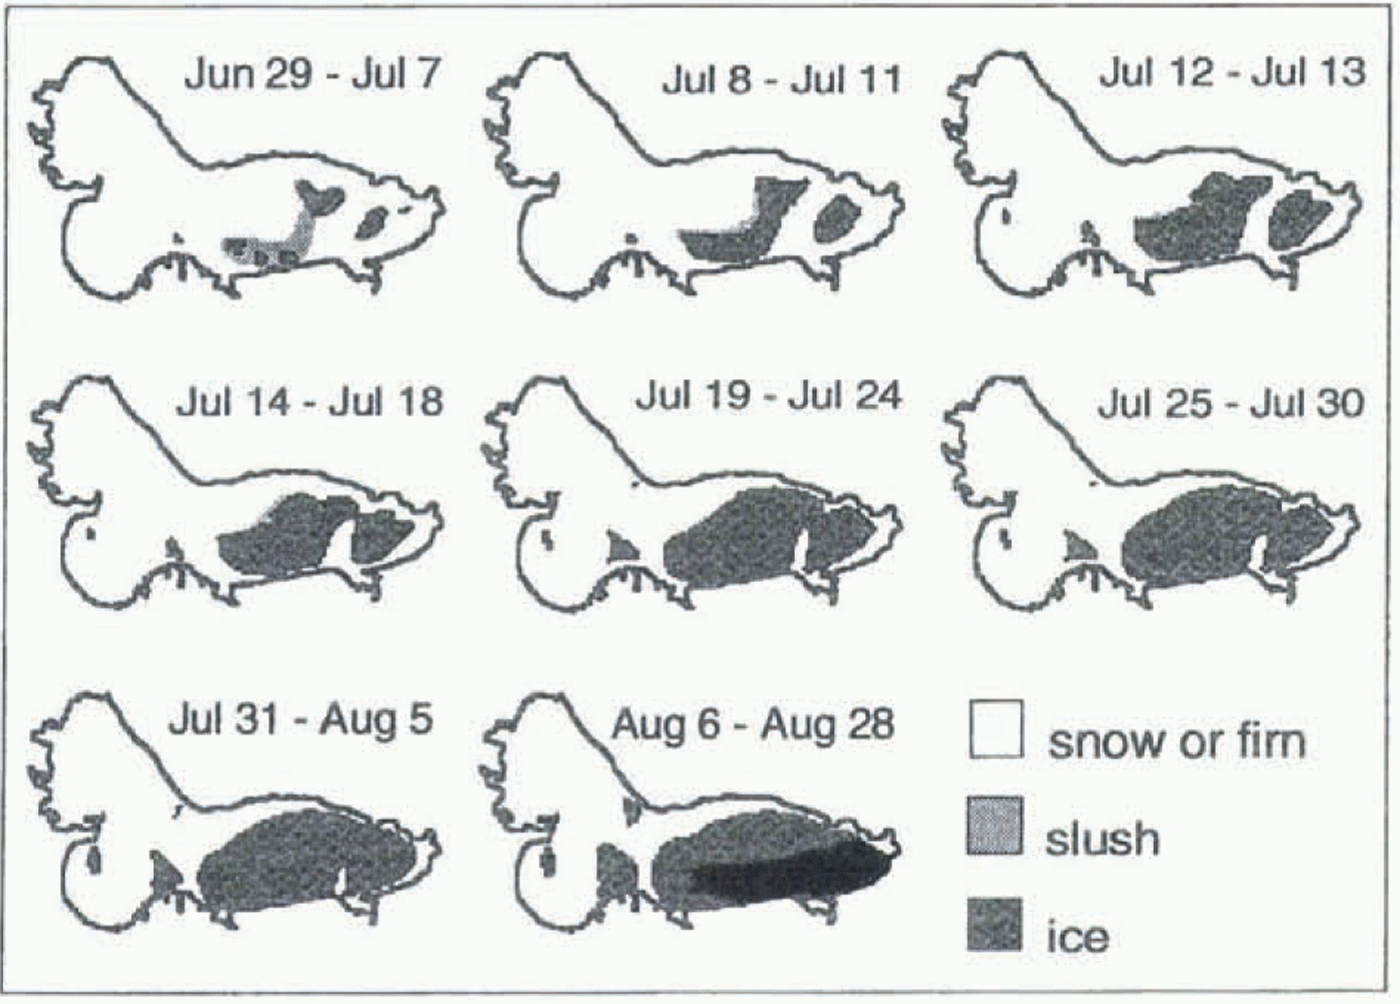
The temporal evolution of albedo is obtained from predefined surface grid files based on field observations of the glacier surface and the location of the snowline throughout the season (Fig. 2). Three types of surface are distinguished in these files: ice, slush and snow/firn. Albedo values of 0.42 and 0.50 were used for ice and slush, respectively, as measured on average at station B (Hock and Holmgren, 1996). The snow and firn albedo was taken from daily averaged albedo measurements over snow, varying between 0.62 and 0.88. The time series at station B and station C was used in
Temporal evolution of surface conditions on Storglaciären in 1994. The glacier was snow-covered after 28 August. For the 1993 simulation a different set of maps was used.
1993 and 1994, respectively. During the period in 1993 when ice was exposed at station B, a constant albedo of 0.6 was assumed for snow and firn.
Long-wave outgoing radiation is taken to be 315.6 Wm–2, corresponding to a melting surface with a temperature of 0°C and an emissivity of unity. Long-wave incoming radiation is calculated from measurements of net radiation, global radiation, reflected short-wave radiation from the climate station and the value of long-wave outgoing radiation for a melting surface. Both long-wave radiative components are assumed to be constant over the entire glacier, neglecting potential spatial variations due to surrounding topography and cloud-cover variations.
Turbulent fluxes are estimated by two alternative bulk aerodynamic methods, each requiring input data of air temperature, humidity and wind speed. Temperature was distributed to each grid cell using a lapse rate of 0.4 K per 100 m, obtained from average temperatures measured at stations A and C on the glacier (Fig. 1). Vapour pressure and wind speed were assumed constant over the glacier. The surface is assumed to be melting. The first method is a semi-empirical relationship proposed by Escher-Vetter (1980) and applied by Baker and others (1982) and Mader and Kaser (1994), whereby the sensible and latent heat fluxes Q H and Q L, respectively, are estimated by
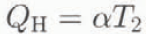
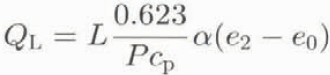
where α is the coefficient of heat transfer, T 2 is air temperature (°C) at 2 m, L is the latent heat of evaporation or sublimation as appropriate, P is atmospheric pressure, c p is the specific heat of air at constant pressure, and e 2 and e 0 are the vapour pressure at 2 m and at the melting surface, respectively. The coefficient a (product of air density p, c p and the eddy diffusivity) was empirically determined to 5.7 [Equation], where u 2 is the wind speed at 2 m (Escher-Vetter, 1980).
The second method is based on Monin–Obukhov similarity theory and has been widely applied in glacier surface energy-balance studies (see e.g. Konzelmann and Braithwaite, 1995). It assumes homogeneous horizontal terrain, stationarity and constancy of vertical fluxes (Ambach, 1986):


where k is von Kármán’s constant (0.41); p 0 is the air density at the mean atmospheric pressure at sea level, P 0; z is the instrument height, and z 0w, z 0T and z 0e are the roughness lengths for logarithmic profiles of wind, temperature and water vapour, respectively. The roughness length for wind was assumed to be 2.7 mm over ice and 0.15 mm over snow, as previously obtained on Storglaciären, and the roughness lengths for temperature and water vapour were assumed to be 300 times smaller (Hock and Holmgren, 1996).
The energy supplied by rain is calculated from the rainfall rate and air temperature.
3.2. Precipitation
A 10% linear increase in precipitation with elevation was assumed for the catchment (Hieltala, 1989) and 25% was
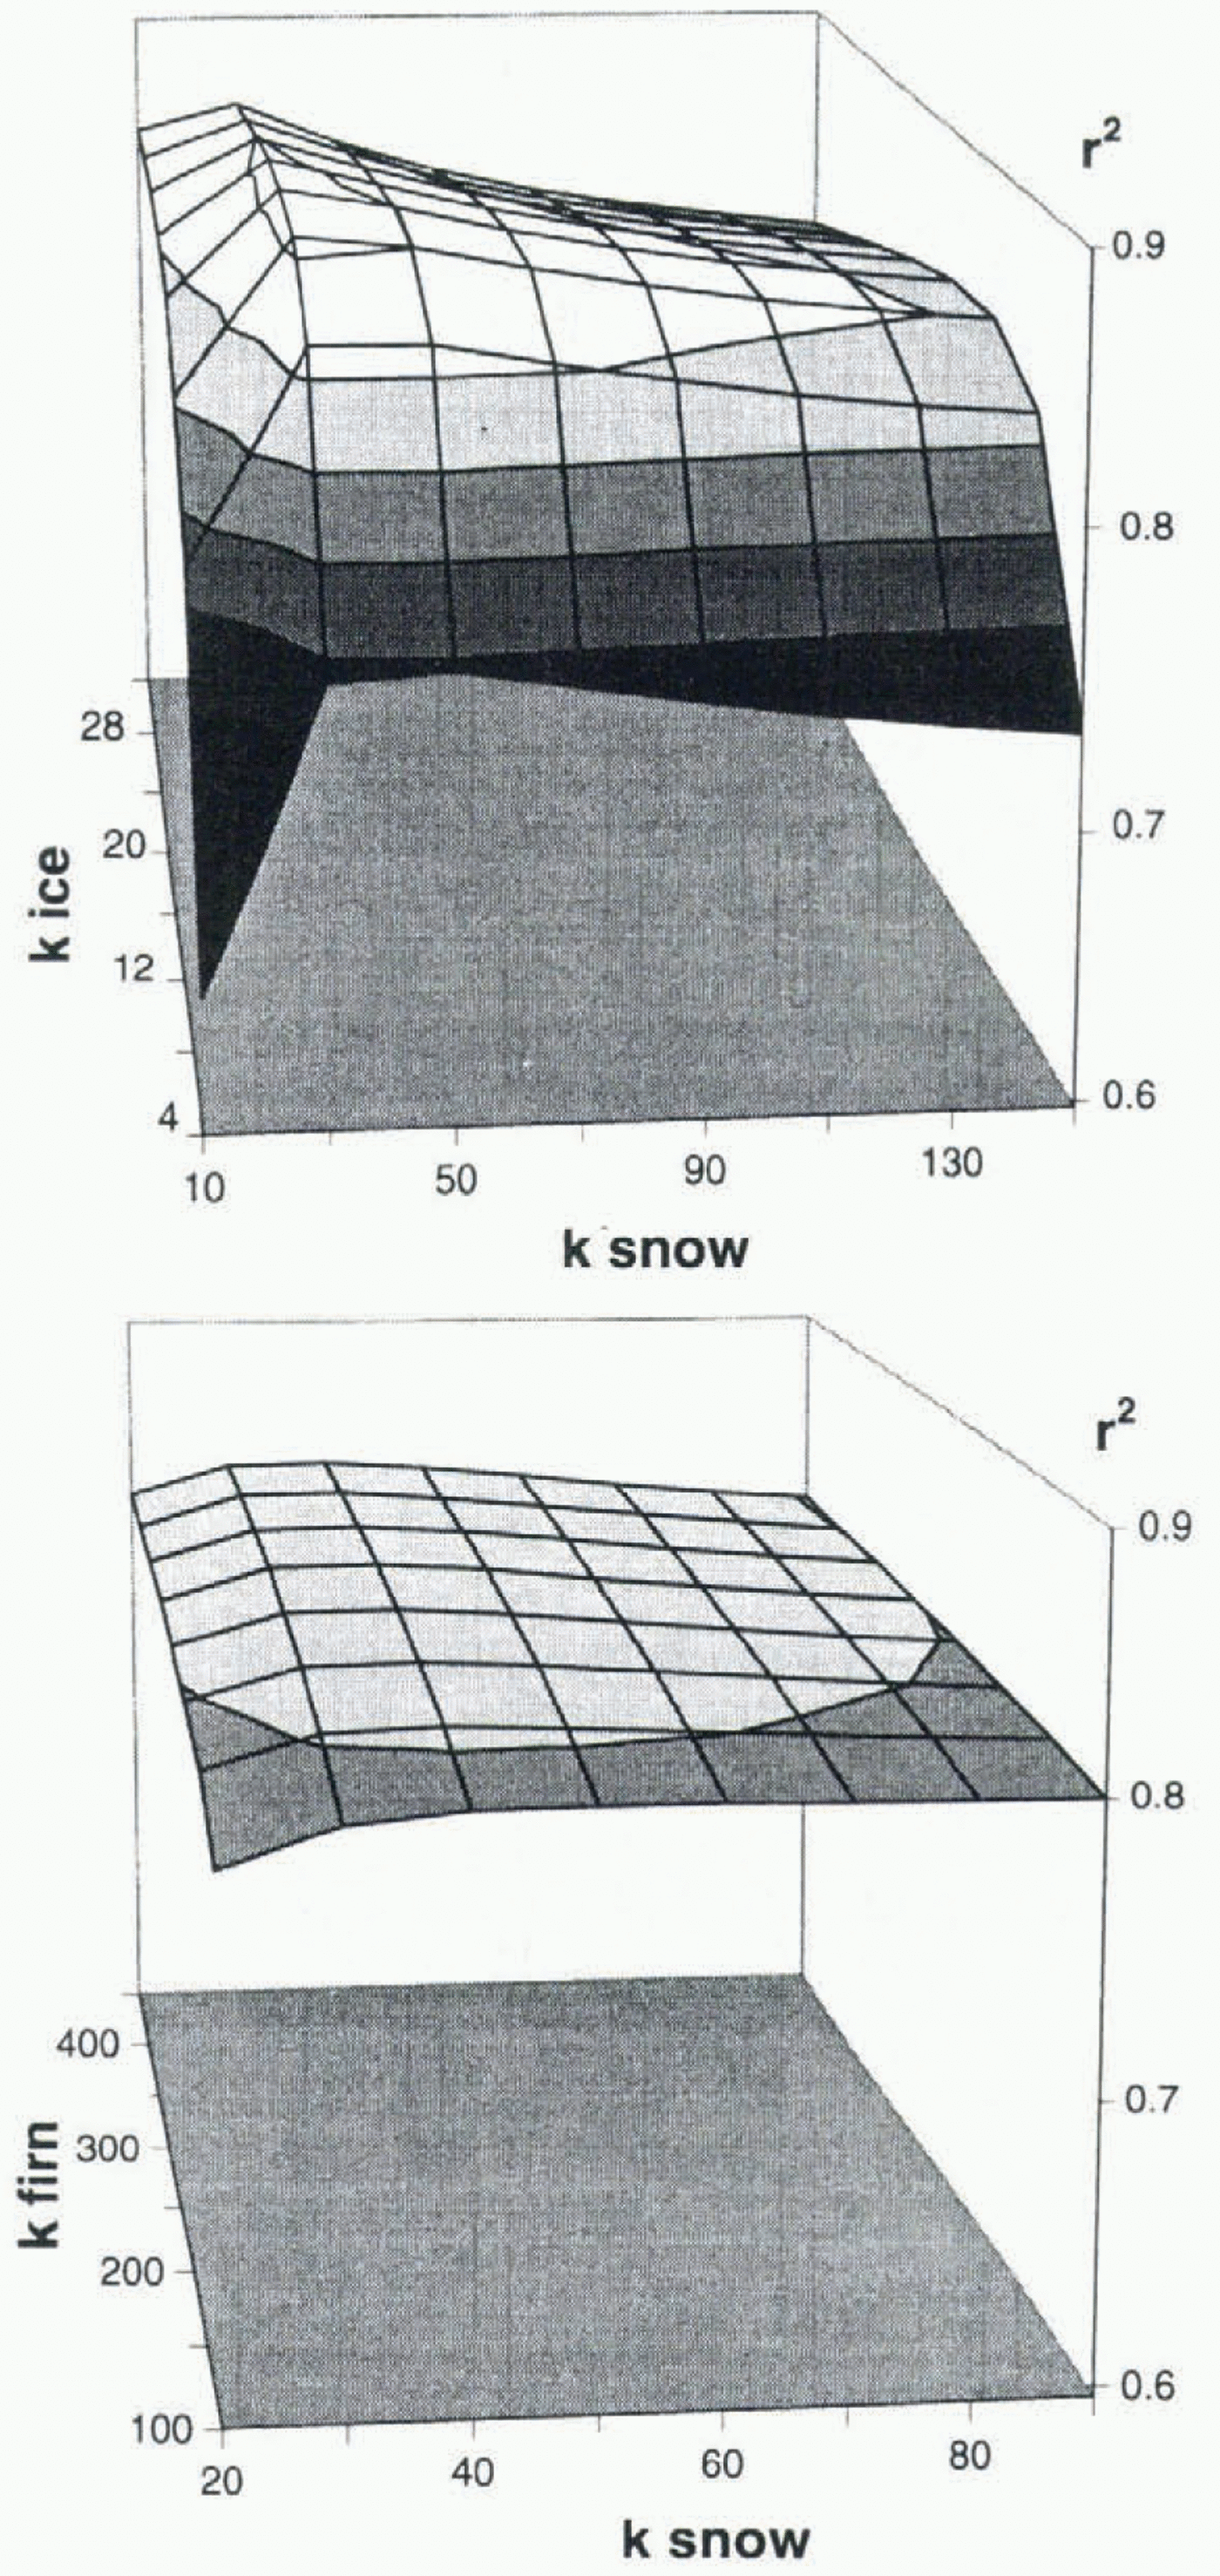
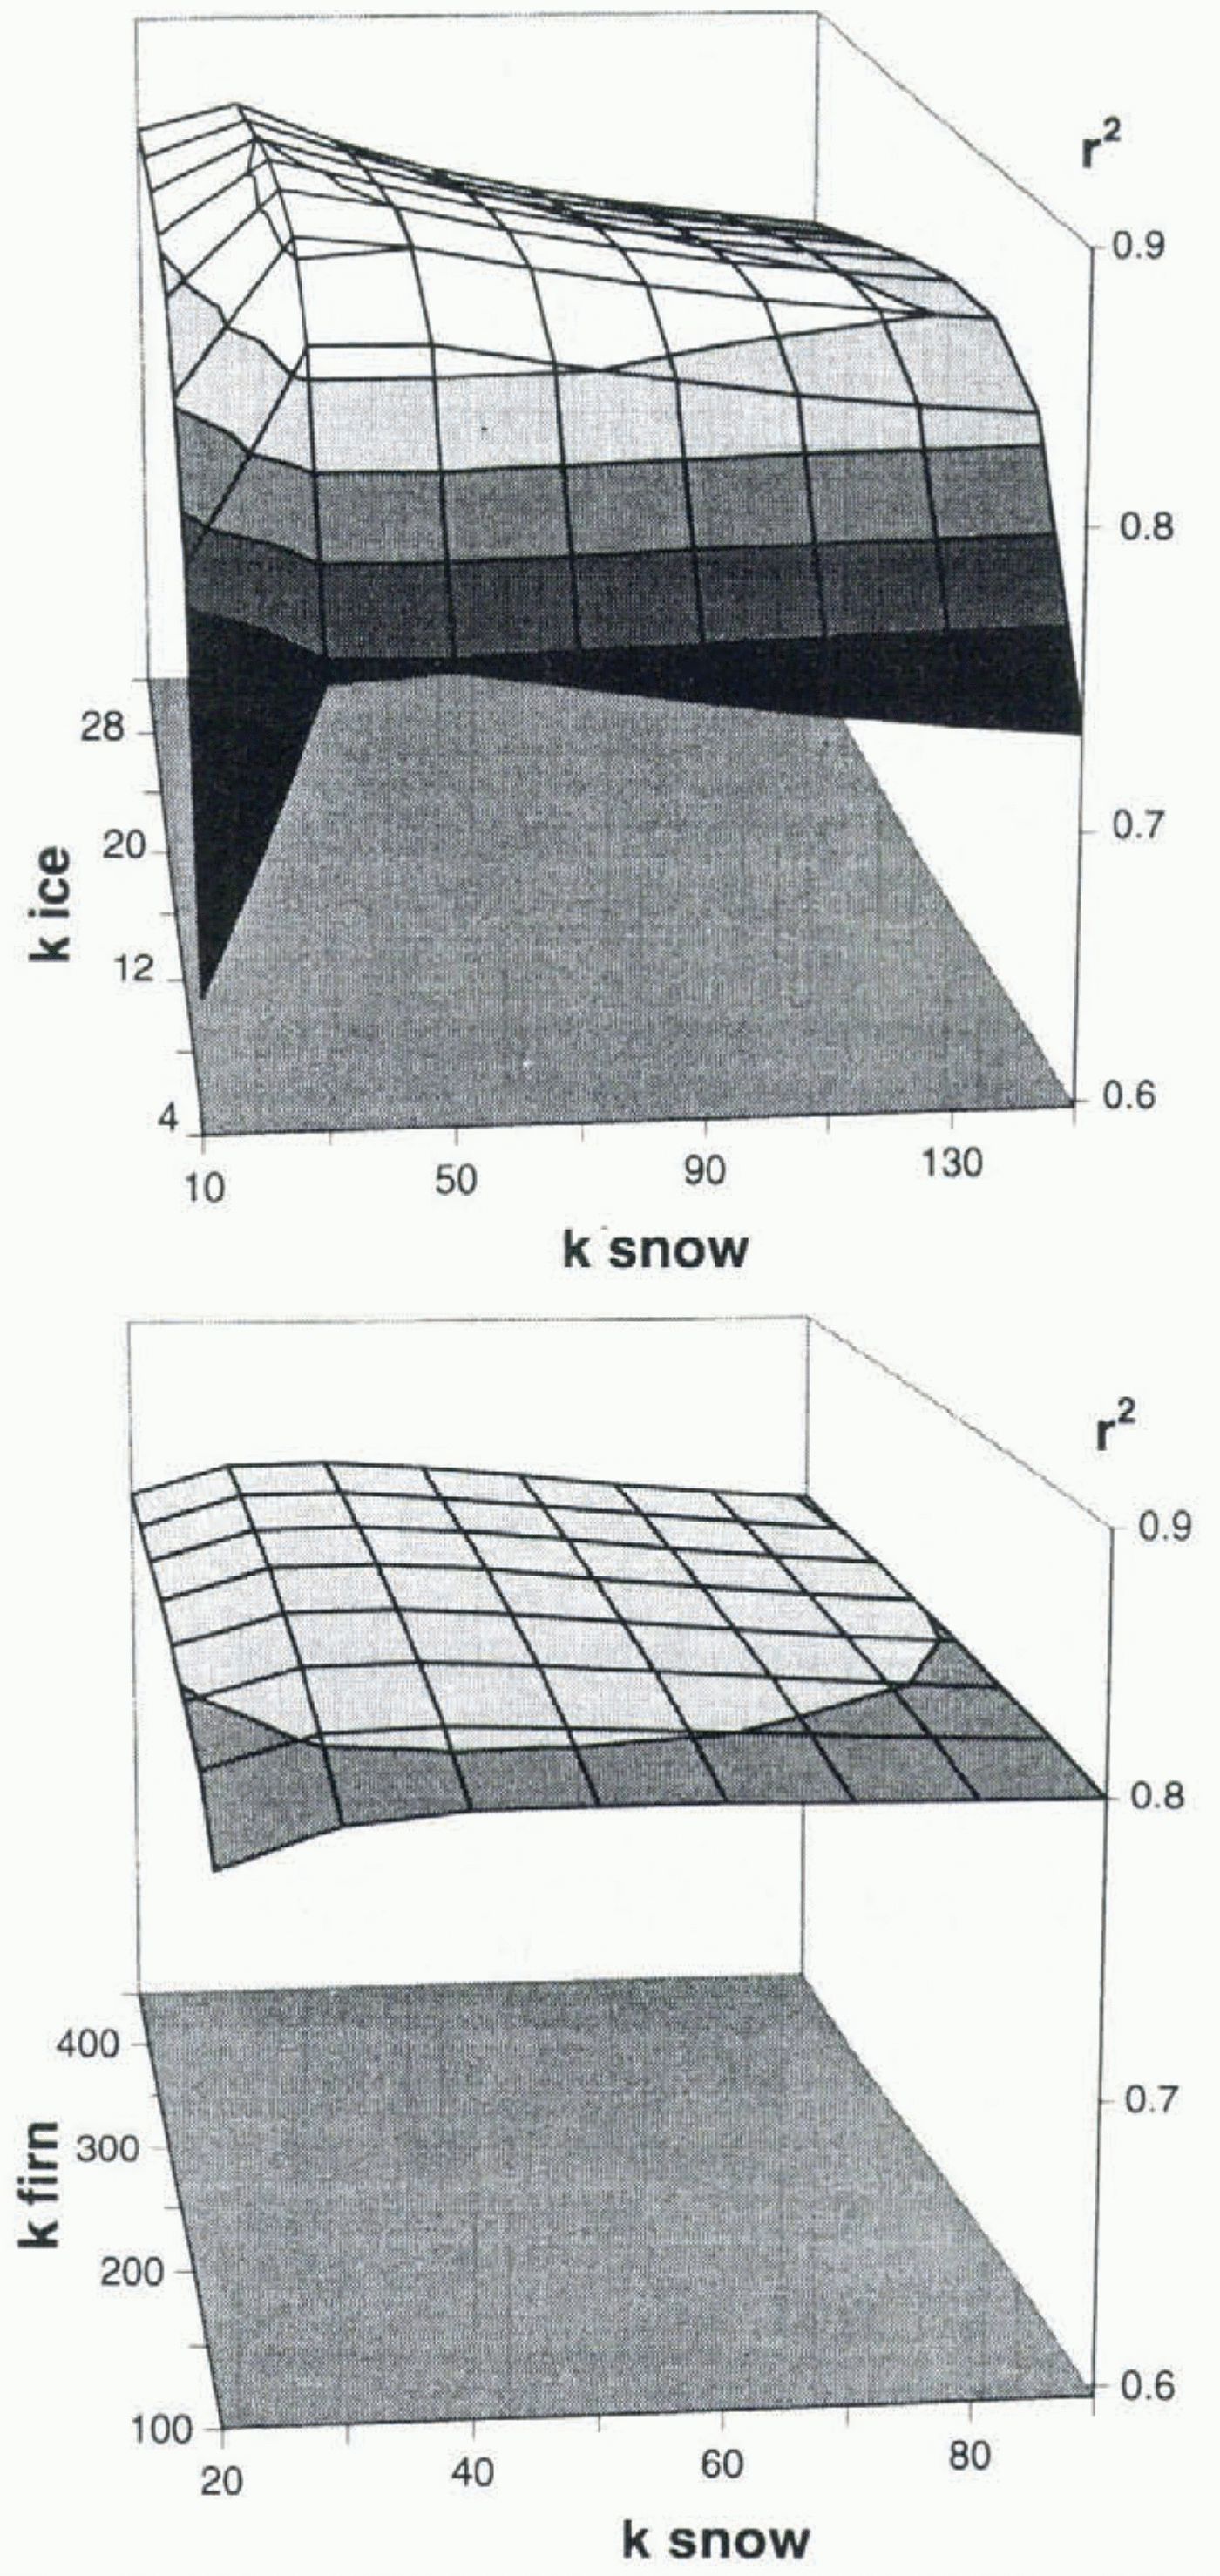
Sensitivity of r2 values between measured and calculated discharge to the assumption on the storage constants K of firn, snow and ice in hours (Noetzli, 1996).
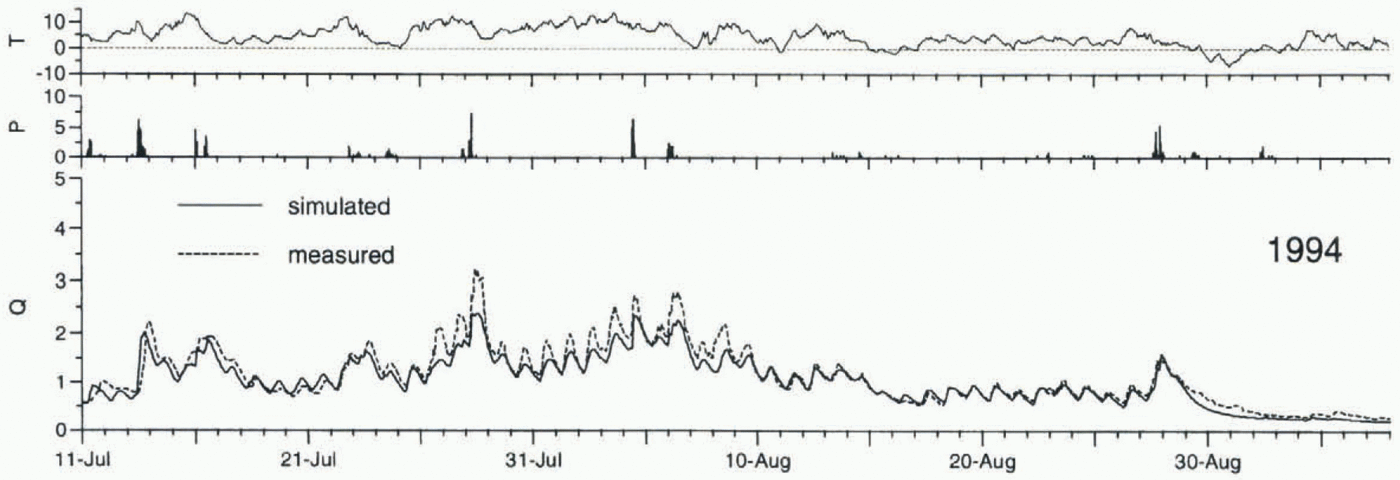
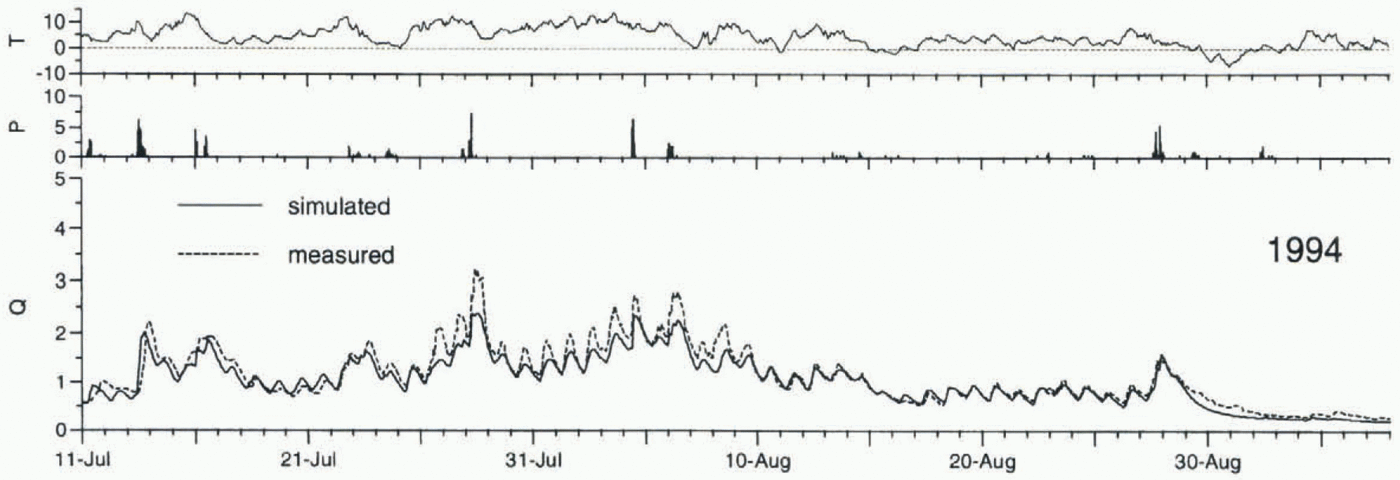
Hourly data of air temperature T (°C) and precipitation P (mm h–1) at station B, and simulated and measured hourly discharge Q (m3 s–1) of Storglaciären from 11 July to 6 September 1994 (optimization year), using Equations (4a) and (4b) to calculate the turbulent fluxes.
added to measured precipitation to account for the gauge undercatch error (Östling and Hooke, 1986). As discharge routing is restricted to the glacier (see below), precipitation failing on the unglaciated grid cells of the catchment is taken into account by spreading its volume across the glacier surface. A threshold temperature of 1.5°C was used to discriminate liquid from solid precipitation (Rohrer, 1989).
3.3. Discharge routing
Hourly sums of meltwater and rainfall are transformed into discharge using a linear reservoir model based on Baker and others (1982). The linear reservoir approach assumes that, at any time t, the reservoir’s volume V(t) is proportional to its discharge Q(t), the factor of proportionality being the storage constant k with the unit of time. Storage and continuity equations for the reservoir are given by

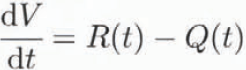
where R(t) is the rate of water inflow to the reservoir, here equivalent to the sum of meltwater and rain. Combining Equations (6) and (7) yields
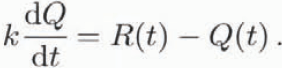
For hourly time intervals, the discharge Q is given by

The glacier is subdivided into three reservoirs, one each for firn, snow and ice, corresponding to their different hydraulic properties (Baker and others, 1982). Total discharge at the glacier snout is the sum of the discharges of each reservoir using Equation (9). The firn reservoir is defined as the area above the previous year’s equilibrium line. The ice reservoir covers the area of exposed ice, and the snow reservoir refers to the snow-covered area outside the firn reservoir. The maps used for the allocation of the albedo (Fig. 2) were also used to delimit the ice from the snow reservoir, thus taking into account the growth of the ice reservoir at the expense of the snow reservoir as the snowline propagates up-glacier. The reservoirs “overlap” within the glacier, as some water from the firn and snow reservoir will pass through ice.
4 Results And Discussion
The energy available for melt was calculated hourly for each glacierized grid cell, and discharge was computed from added melt- and rainwater for the periods 9 June–17 September 1993 and 11 July–6 September 1994. Simulated hourly discharges were then compared to the respective sums of Nordjåkk and Sydjåkk discharge. Summer 1993 was relatively wet and cloudy, whereas summer 1994 was exceptionally dry and warm. Consequently, the discharge pattern in 1994 was mainly characterized by melt-induced diurnal cycles, whereas in 1993 it was dominated by pronounced rain-induced discharge peaks superimposed on rather weak diurnal fluctuations.
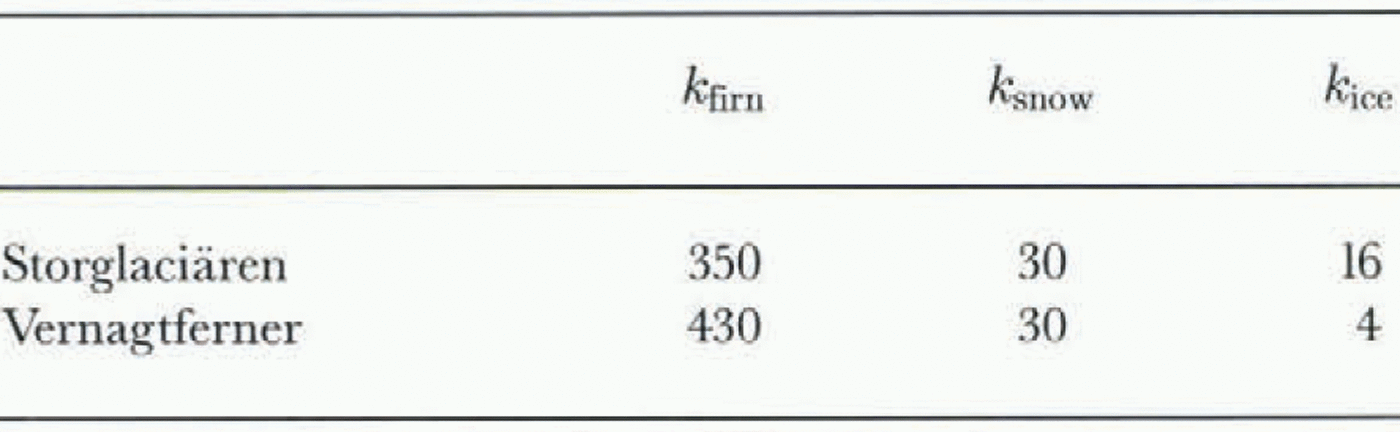
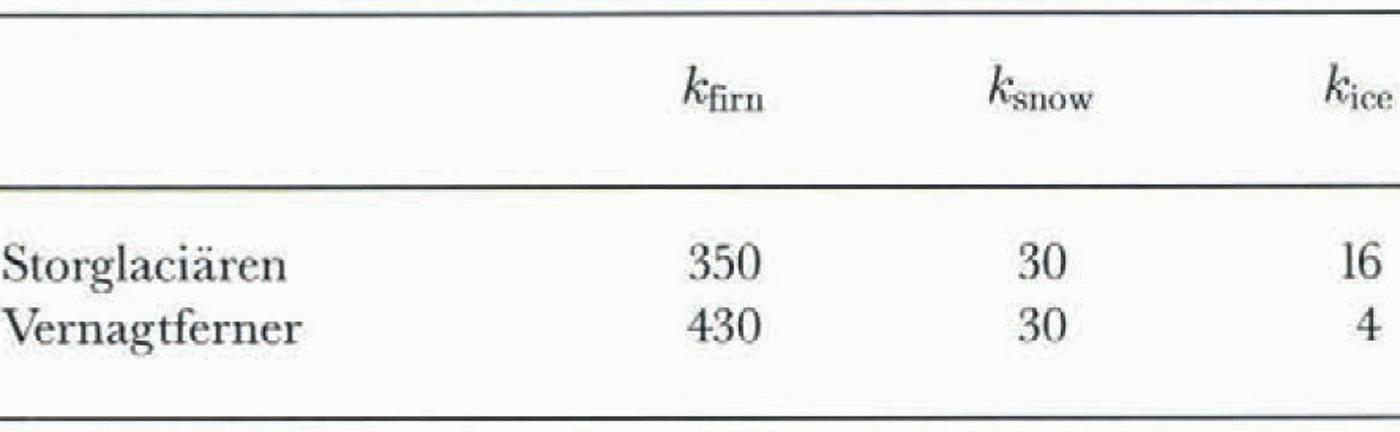
First, the turbulent fluxes were calculated using Equations (4a) and (4b). The 1994 data were used to tune the model. This year was chosen for tuning because the period of measured discharge exceeded that in 1993. The only model parameters tuned were the storage recession constants k of the three linear reservoirs. Optimized model parameters yielding the best agreement between calculated and observed discharge were obtained by maximizing the coefficient of determination r 2 and by visual inspection of the discharge plots. The r 2 values were mapped as a function of two model parameters to yield a so-called response function (Fig. 3). Results were relatively insensitive to the choice of the storage constants over a large range of k values. The recession constant for ice affected simulation results significantly only for small values. Beyond approximately 11 h, r 2 values hardly changed over a large range of k values, as indicated by a rather flat response function. Optimised k values are presented in Table 1 together with those used by Baker and others (1982) on Vernagtferner, a glacier approximately three times as large as Storglaciären.
In 1993, meteorological input data were available to cover the entire melt season, whereas in 1994 measurements
Storage constants k in hours for the linear reservoirs of firn, snow and ice for Storglaciären (this study) and Vernagtferner (Baker and others, 1982)
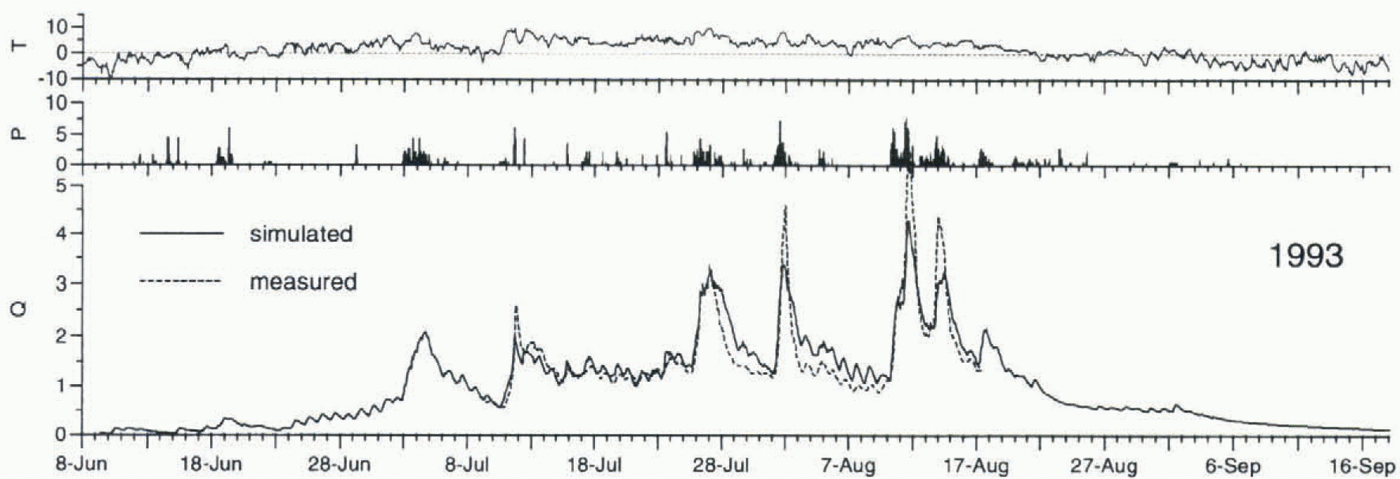
Hourly data of air temperature T (°C) and precipitation P (mm h–1) at station B, and simulated and measured hourly discharge Q (m3 s–1) of Storglaciären from 8 June to 17 September 1993 (verification year) using Equations (4a) and (4b) to calculate the turbulent fluxes.
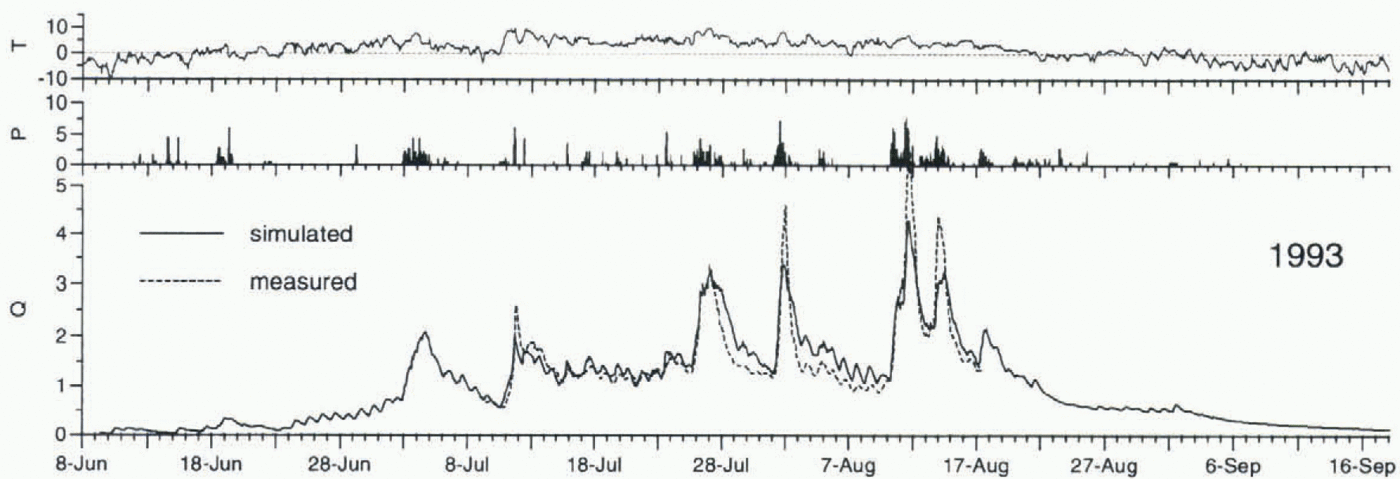
started after the onset of ablation. Simulated and measured discharge for the calibration year 1994 and for the verification year 1993 are shown in figures 4 and 5, respectively. Generally speaking, there was good agreement between calculated and observed discharge. In 1993, simulated discharge at the onset of measurements coincided well with measured discharge, r 2 values of 0.88 and 0.82 were obtained in 1994 and 1993, respectively. Total discharge was underestimated by 8% in 1994 and overestimated by 6% in 1993. Whereas the timing and the amplitudes of diurnal discharge cycles could be well modelled, peak flows tended to be underestimated during the main ablation period, in particular at high-water events. This may be mainly for three reasons: (1) meltwater production or precipitiation may have been underestimated; (2) measured discharges may have been overestimated during high-water events, since these were beyond the range of calibration of the gauging stations; (3) K values were assumed to be constant, although the K value for ice is expected to decrease as the internal drainage system develops throughout the ablation season. Temporal patterns of bulk water storage and release within the glacier are not considered in the model and may also have contributed to some of the discrepancies between simulated and observed discharge. However, in contrast to Mikkaglaciären (Stenborg, 1970) and South Cascade Glacier (Tangborn and others, 1975), significant water storage at the beginning of the melt season is assumed to be unlikely on Storglaciären (Östling and Hooke, 1986). Modelled declines of high-water peaks in 1993 were flatter than those measured, suggesting a smaller recession constant for ice than obtained from the tuning in 1994. As the internal and subglacial system may develop differently from year to year, K values will also change.
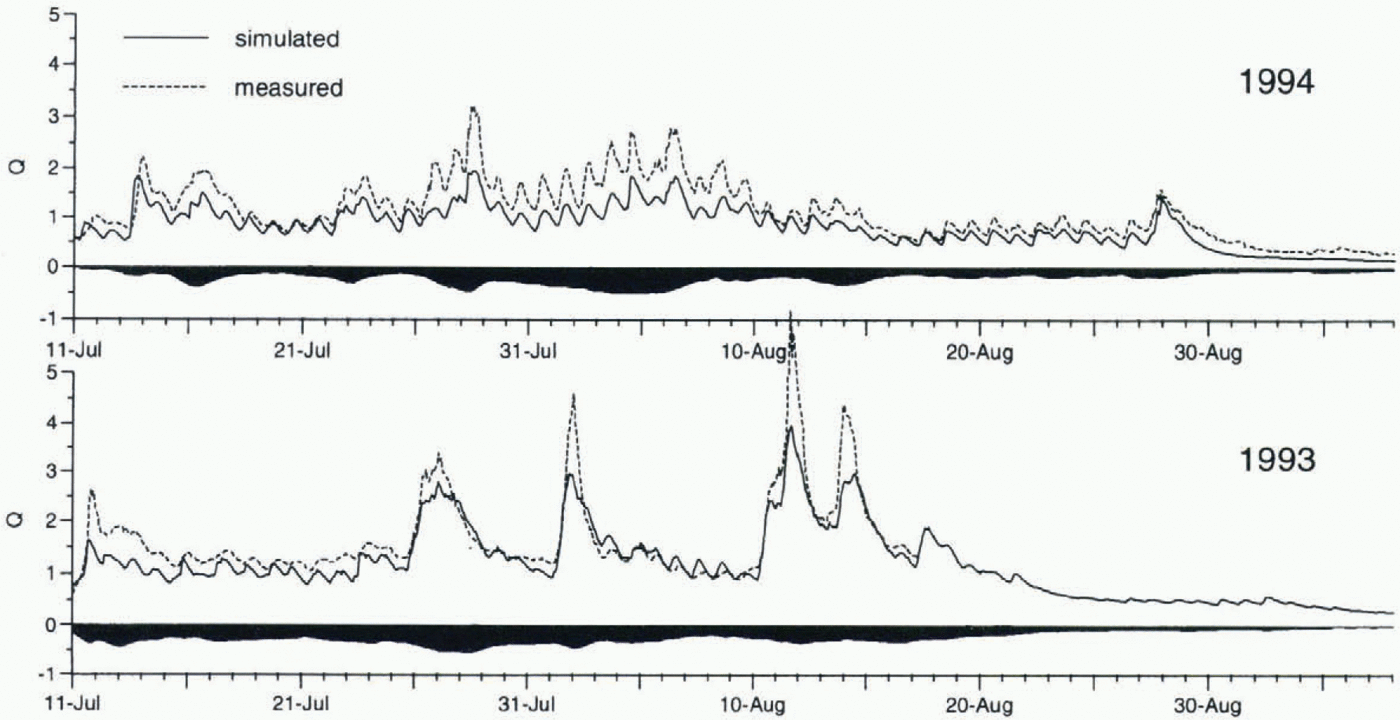
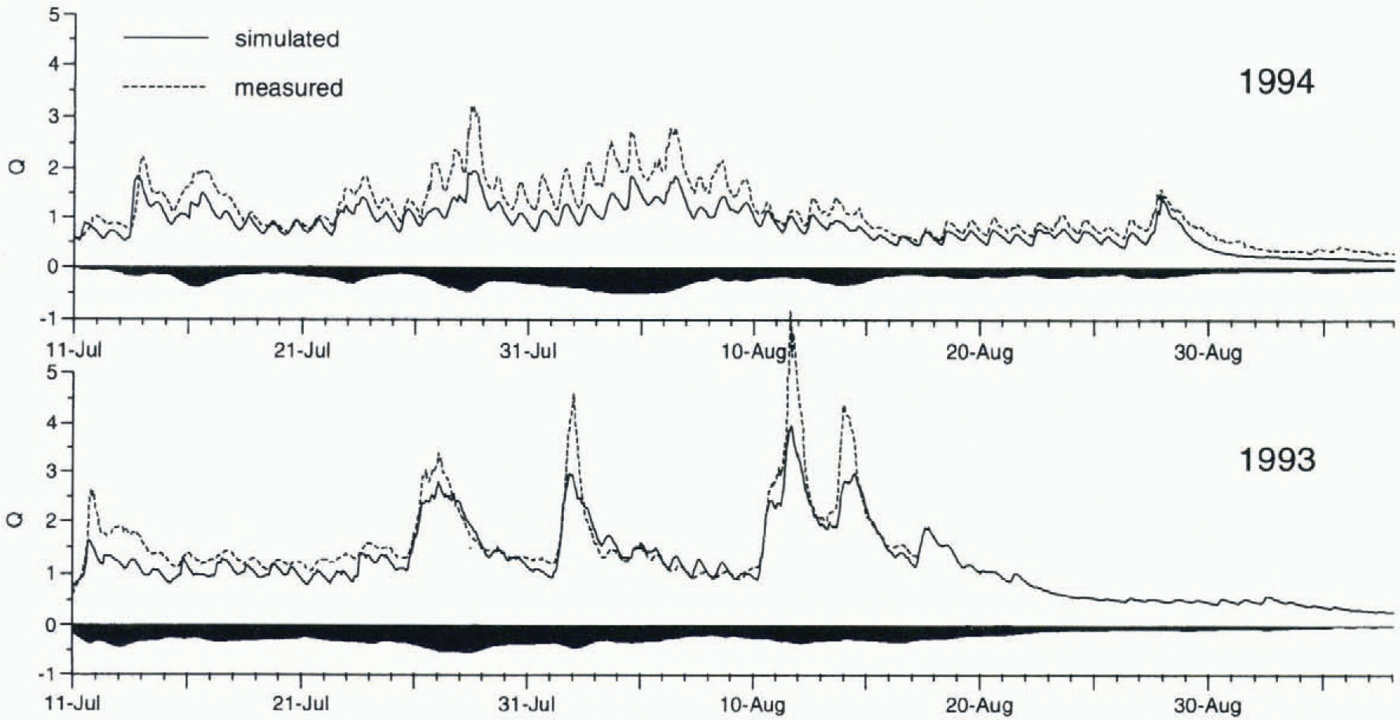
In a second run, the turbulent fluxes were parameterized using Equations (5a) and (5b) in order to assess the sensibility of results to the choice of the parameterizations used for the calculation of the turbulent fluxes. Despite their different weather characteristics, in both years the average turbulent fluxes reached only roughly half the amounts obtained before, and the resulting discharge totals were reduced significantly. The discharge simulations are shown in Figure 6. In 1994 the previous average underestimation of discharge of 8% was increased to 27%, and in 1993 the previous overestimation of 6% was transformed into an underestimation of discharge of 12%. The r 2 values were reduced to 0.53 and 0.77 in 1994 and 1993, respectively.
Simulated and measured hourly discharge Q (m3 s–1) of Storglaciären from 11 July to 6 September in 1993 and 1994, using Equations (5a) and (5b) to calculate the turbulent fluxes. The black areas refer to the difference between simulated discharges using Equations (5a) and (5b) and using Equations (4a) and (4b). Negative amounts indicate that simulated discharges are lower using the former equations than using the latter ones.
The difference in turbulent energy between the two bulk approaches may be for two reasons: (1) the difference in the relationship between the turbulent fluxes and wind speed, and (2) a difference in transfer coefficients. Equations (4a) and (4b) assume the turbulent fluxes to be proportional to the square root of wind speed, whereas Equations (5a) and (5b) assume them to be linearly proportional to wind speed. Consequently, during periods of extreme wind speeds the turbulent fluxes tended to be lower in the former case than in the latter. During periods of moderate or low wind speed, Equations (4a) and (4b) yielded considerably higher turbulent energy fluxes than Equations (5a) and (5b), indicating a difference in transfer coefficients. Although the empirically derived transfer coefficients in Equation (4b) were taken from a different study without any examination, simulation results were good. Considering the wide range of reported transfer coefficients on glaciers (e.g. Braithwaite, 1995), this may be considered a surprising coincidence. Application of Equations (5a) and (5b), including the roughness lengths obtained from profile measurements on Storglaciären, however, yielded worse simulation results. This may reflect the difficulties in determining and extrapolating transfer coefficients or roughness lengths. These quantities will vary in space and time according to the varying surface conditions on the glacier, which may lead to substantial errors in the calculation of meltwater production. Besides the uncertainty in surface roughness, a problem arises from the violation of assumptions. Generally, the assumptions of homogeneity, stationarity and constancy of fluxes are not fullfilled in the glacier environment, posing a problem for the application of bulk approaches in glacier energy-balance studies.
5 Conclusions
A grid-based surface energy-balance model was coupled to a linear reservoir model to predict hourly discharge of Storglaciären during two summers. Simulated discharge turned out to be insensitive to the storage constants K over a wide range of K values. This is favourable in terms of a transfer of the model to other glaciers, because the K values are usually not known. Only the K value of the ice reservoir was sensitive for small values. The concept of parallel linear reservoirs seems to be well suited for routing water through a valley glacier, provided meltwater amounts are determined accurately.
Two different bulk approaches were applied to calculate the turbulent fluxes, yielding considerably different meltwater estimates in both years. The results emphasize the significant role of the turbulent fluxes in determining meltwater and glacial discharge and the uncertainty in bulk aerodynamic methods.
Acknowledgements
The fieldwork in 1994 was supported by the Kommission für Reisestipendien der Schweizerischen Akademie der Naturwissenschaften. We thank P. Cutler, University of Minnesota, for sharing the fieldwork in 1993, and J. Schulla, ETH Zürich, for providing the shading routine. K. Schroff prepared the instrumentation. The staff at the Tarfala Research Station is gratefully acknowledged for field support. Thanks to B. Holmgren, A. Hubbard, T. Konzelmann and H. Lang for valuable comments.