I. INTRODUCTION
Hydrogen has been identified as a potential energy carrier in many low greenhouse gas energy scenarios due to its high energy capacity and environmental friendliness. Reference Muradov and Veziroğlu1–Reference Sand8 In hydrogen energy systems, potential sources of hydrogen include conversion from biomass or from electrolysis, photolysis, and thermolysis of water. It is well known that hydrogen produced from water does not present the challenge of unwanted emissions at the point of conversion, but energy must be supplied from an external resource. Reference Wang, Czernik, Montane, Mann and Chornet9 If this energy can be obtained from solar energy, hydrogen can then be considered a green energy alternative capable of powering everything from laptops to submarines.
Photocatalytic hydrogen production from water using a semiconductor catalyst has attracted a tremendous amount of interest since the discovery of water splitting on a TiO2 electrode. Reference Fujishima and Honda10–Reference Qu, Zhou, Xie, Jiang, Wang, Tian, Ren, Tian and Fu15 Thermodynamically, water splitting into H2 and O2 is an uphill reaction, accompanied by a large positive change in the Gibbs free energy. The efficiency of water splitting is determined by the band gap and band structure of the semiconductor and the electron transfer process. Over the past several decades, many photocatalysts have been found to have photocatalytic activities for photocatalytic hydrogen production. Reference Chen, Shen, Guo and Mao16–Reference Domen, Takata, Ikeda, Shinohara, Tanaka, Hara and Kondo22 In particular, interest has been directed toward nanostructures with high photocatalytic activity because of their large surface areas, unique photochemical and photophysical properties, and electron-transport properties. Reference Jitputti, Rattanavoravipa, Chuangchote, Pavasupree, Suzuki and Yoshikawa23–Reference Zhou, Liu, Li, Gao, Liu and Fang29 However, new and effective photocatalysts are still to be perfected owing to the fact that present photocatalysts are unstable, suffer from self-oxidization effect, are expensive, and involve fussy preparation methods and energy consumption.
Among various materials, layered perovskite-type oxides have attracted considerable attention due to their unique optical properties and excellent photocatalytic activity. Especially, perovskite CaTiO3, has a band gap energy of 3.7 eV, which value is semiconductor-like and displays a suitable conduction/valence band positions as desirable for photocatalytic water splitting. Reference Mizoguchi, Ueda, Orita, Moon, Kajihara, Hiranl and Hosono30 However, nanosized CaTiO3 for photocatalytic hydrogen production has received scanty attention.
Herein, we successfully prepared MTiO3 (M = Ca, Ni, and Zn) nanocrystals by an ethylene glycol (EG)-mediated synthesis route followed by calcination in air. In comparison with NiTiO3 and ZnTiO3 nanocrystals, the CaTiO3 nanocrystals exhibited a higher activity for water splitting into H2 under ultraviolet (UV) light irradiation.
II. EXPERIMENTAL
Preparation of MTiO3 (M = Ca, Ni, and Zn) nanocrystals: All of the chemicals used in this paper were analytical-grade and used without further purification. A typical synthesis of CaTiO3 nanocrystals was as follows: 0.01 mol calcium acetate (Ca(CH3COO)2·2H2O) and 3.4 mL tetra-n-butyltitanate (Ti(OC4H9)4) were dissolved in 60 mL EG, then the solution was stirred at room temperature for about 30 min. After aging in air at 180 °C for 24 h, the obtained products were collected by means of centrifugation, washed with deionized water and ethanol, and dried in vacuum at 80 °C for 4 h, and finally sintering at 600–800 °C for 2 h. NiTiO3 and ZnTiO3 nanocrystals were prepared by almost the same procedure, except for the same being processed without aging in air at 180 °C for 24 h.
Characterization: The crystal structure was analyzed by a Rigaku (Japan) D/MAX-rA x-ray diffractometer equipped with graphite monochromatized Cu Kα radiation (γ = 1.541874 Å), keeping the operating voltage and current at 40 kV and 40 mA, respectively. The size and morphology of the final products were determined by using JSM-6301F scanning electron microscope (Tokyo, Japan; SEM) and JEM-2010F transmission electron microscope (TEM, JEOL, Tokyo, Japan) operated at 200 kV.
Nitrogen adsorption–desorption isotherms were collected using an Autosorb-1 (Quantachrome Instruments, Boynton Beach, FL) nitrogen adsorption apparatus at 77 K. The pore size distribution plots were obtained by the Barrett–Joyner–Halenda (BJH) model. UV-vis absorption spectra were determined by a UV-vis spectrophotometer (Shimadzu UV-2550, Tokyo, Japan). Raman spectra were taken by using Renishaw 1000 Micro-Raman spectrometer (London, UK). X-ray photoelectron spectroscopy (XPS) analysis was performed on a VG ESCALAB MKII (London, UK) with a Mg KR (1253.6 eV) achromatic x-ray source (the laser wavelength is 633 nm).
The photocatalytic H2 evolution from water was conducted in an online photocatalytic hydrogen production system (CEL-SPH2N, AuLight, Beijing, China). A powder sample of the catalyst (0.1 g) was suspended in a mixture of 80 mL distilled water and 20 mL methanol in the cell by using a magnetic stirrer. Pt-loaded photocatalysts were prepared by known standard method of in situ photodeposition method. For this, the photocatalyst powder was added to an aqueous methanol solution containing a required amount (0.1 wt.%) of H2PtCl6. The solution was illuminated for 2 h under simulated solar light, filtered, and then dried in a static oven at 80–100 °C. Before the reaction, the mixture was deaerated by evacuation to remove O2 and CO2 dissolved in water. The reaction was carried out by irradiating the mixture with UV light from a 300 W Xe lamp with a 320–390 nm reflection filter which means the wavelength of light is approximately 320–390 nm. Gas evolution was observed only under photoirradiation, being analyzed by an online gas chromatograph [SP7800, thermal conductivity detector, molecular sieve 5 Å, N2 carrier, Beijing Keruida Limited, Beijing, China].
III. RESULTS AND DISCUSSION
A. Crystal structure and morphology
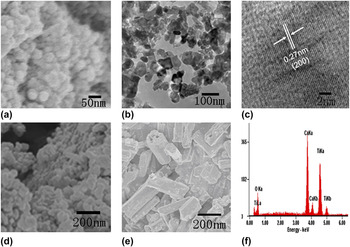
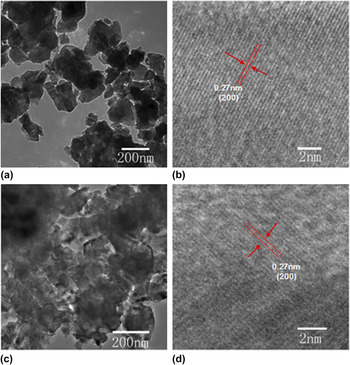
Figures 1(a) and 1(b) show the representative SEM and TEM images of CaTiO3 nanocrystals sintering at 600 °C for 2 h. The average size of CaTiO3 nanocrystals is less than 100 nm. The high-resolution transmission electron microscopy (HRTEM) image of a single nanoparticle is shown in Fig. 1(c). The measured lattice spacing is about 0.27 nm, corresponding to the distance of the {200} planes of CaTiO3. This image also reveals the single-crystal nature of the product. The corresponding SEM images of NiTiO3 and ZnTiO3 nanocrystals sintering at 600 °C for 2 h are shown in Figs. 1(d) and 1(e). During the SEM measurement, the elemental components of the CaTiO3 nanocrystals were detected by energy-dispersive x-ray (EDX) analysis, as shown in Fig. 1(f). The results indicated that Ca, Ti, and O elements coexist in CaTiO3 nanocrystals. Figure 2 shows the TEM images of CaTiO3 nanocrystals sintering at 700 and 800 °C for 2 h. The average particle size of CaTiO3 nanocrystals increased with increasing sintering temperature. The results of the HRTEM image of CaTiO3 nanocrystals sintering at 700 and 800 °C indicated that the measured lattice spacing is ∼0.27 nm, corresponding to the distance of the {200} planes of CaTiO3.
SEM and TEM images of (a–c) CaTiO3, (d) NiTiO3, and (e) ZnTiO3 nanocrystals sintering at 600 °C for 2 h. (f) The EDX analysis result of CaTiO3 nanocrystals sintering at 600 °C for 2 h.

TEM images of CaTiO3 nanocrystals sintering at (a, b) 700 °C and (c, d) 800 °C for 2 h.

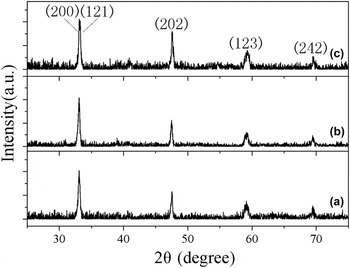
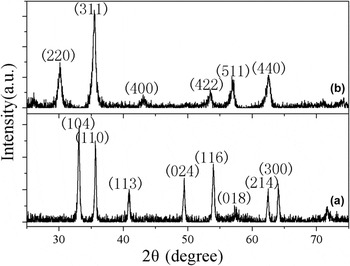
The crystal structure and particle size of products were obtained by x-ray diffraction (XRD) patterns. Figure 3 shows the XRD patterns of CaTiO3 nanocrystals sintering at different temperatures. All the diffraction peaks can be indexed to the pure orthorhombic phase CaTiO3 (Joint Committee on Powder Diffraction Standards (JCPDS) 42-0423). No other impurity peaks were detected. It is noted that CaTiO3 cannot be obtained when the sintering temperature was 500 °C. The XRD patterns of NiTiO3 and ZnTiO3 nanocrystals are shown in Fig. 4. The diffraction peaks can be indexed to the pure orthorhombic phase NiTiO3 (JCPDS 33-0960) and cubic phase ZnTiO3 (JCPDS 39-0190), respectively.
XRD patterns of CaTiO3 nanocrystals sintering at (a) 600 °C, (b) 700 °C, and (c) 800 °C for 2 h.

XRD patterns of (a) NiTiO3 and (b) ZnTiO3 nanocrystals sintering at 600 °C for 2 h.

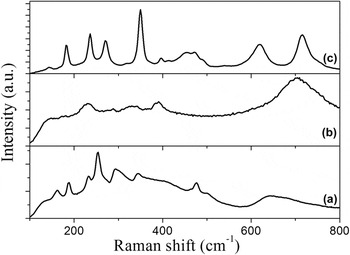
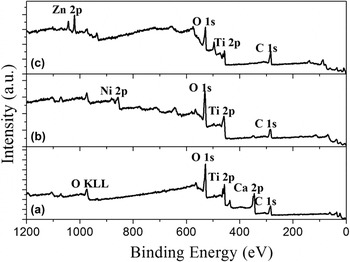
Figure 5(a) shows the Raman spectrum of CaTiO3 in the frequency range of 100–800 cm−1. The Raman spectrum shows a number of sharp peaks superimposed on a broad feature between 100 and 600 cm−1, and a second broad band between 600 and 800 cm−1. It is well known that the Raman peaks in the region of 100–400 cm−1 could be assigned to the modes associated with rotations of oxygen cages. The Raman peaks centered at 477 and 500 cm−1 could be assigned to Ti–O torsional modes. The band observed at 643 cm−1 may be assigned to the Ti–O symmetric stretching vibration. Figure 5(b) shows the Raman spectrum of NiTiO3. These Raman active modes are in agreement with the results reported by Cavalcante et al. Reference Lopes, Cavalcante, Simões, Varela, Longo and Leite31 The corresponding Raman spectrum of ZnTiO3 nanocrystals is shown in Fig. 5(c). Figures 6(a)–6(c) show the XPS spectra of CaTiO3, NiTiO3, and ZnTiO3 nanocrystals.
Raman spectra of (a) CaTiO3, (b) NiTiO3, and (c) ZnTiO3 nanocrystals sintering at 600 °C for 2 h.

Survey XPS spectra of (a) CaTiO3, (b) NiTiO3, and (c) ZnTiO3 nanocrystals sintering at 600 °C for 2 h.

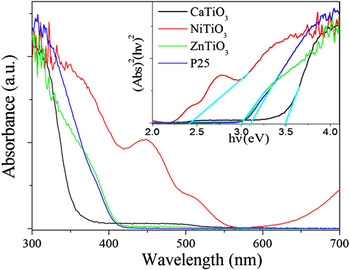
The optical absorptions of the CaTiO3, NiTiO3, and ZnTiO3 nanocrystals were conducted with a UV-vis absorption spectrometer, as shown in Fig. 7. For a crystalline semiconductor, the optical absorption near the band edge follows the equation ahv A(hv − E g) n/2, where a, v, E g, and A are the absorption coefficient, the light frequency, the band gap, and a constant, respectively. Among them, n decides the characteristics of the transition in a semiconductor. The band gaps (E g) of the CaTiO3, NiTiO3, and ZnTiO3 nanocrystals are calculated to be about 3.48, 2.42, and 3.01 eV, respectively.
UV-vis absorption spectra of CaTiO3, NiTiO3, and ZnTiO3 nanocrystals sintering at 600 °C for 2 h.

B. Photocatalytic activity of nanocrystals
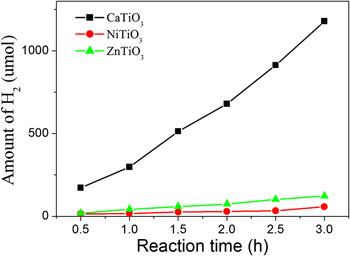
For evaluating whether CaTiO3 nanocrystal is an efficient catalyst, the photocatalytic performance of CaTiO3 nanocrystals was compared with those of NiTiO3 and ZnTiO3 nanocrystals. Figure 8 shows the reaction time depended H2 evolution over CaTiO3, NiTiO3, and ZnTiO3 nanocrystals under UV light irradiation. The results indicated that the activity of CaTiO3 is much better than those of NiTiO3 and ZnTiO3 nanocrystals, indicating that CaTiO3 is a promising catalyst for water splitting into H2. It is well known that the activity for H2 production is related to the conduction band position. The absolute energy positions of conduction band edges were −4.70 and −4.27 for NiTiO3 and ZnTiO3, respectively. Reference Xu and Schoonen32 However, the conduction band position of CaTiO3 was more negative than those of NiTiO3 and ZnTiO3, Reference Jang, Borse, Lee, Lim, Jung, Jeong, Bae and Kim33 and thus, CaTiO3 shows much better performance than ZnTiO3 and NiTiO3.
H2 production activity of CaTiO3, NiTiO3, and ZnTiO3 nanocrystals sintering at 600 °C for 2 h.

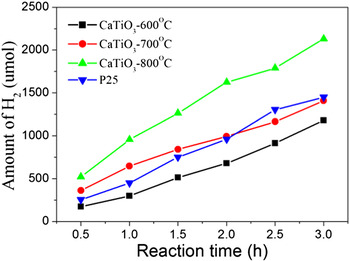
In addition, the rate of H2 evolution over CaTiO3 nanocrystals depends strongly on the sintering temperature of samples, as shown in Fig. 9. Obviously, the activity of CaTiO3 nanocrystals increased with increase in the sintering temperature. For comparison, the activity of commercial TiO2 (Degussa P25) for water splitting into H2 was also studied. The results indicated that the photocatalytic activity of CaTiO3 sintering at 800 °C was better than that of P25.
H2 production activity of CaTiO3 nanocrystals sintering at different temperatures.

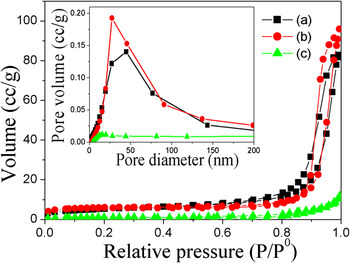
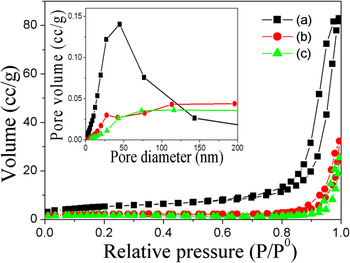
Figure 10 shows the N2 adsorption–desorption isotherms and the corresponding BJH pore size distribution plots of the as-obtained CaTiO3, NiTiO3, and ZnTiO3 nanocrystals sintering at 600 °C for 2 h. The results indicated that the BET surface areas of samples are 19.03, 21.13, and 4.17 m2/g for the CaTiO3, NiTiO3, and ZnTiO3 nanocrystals, respectively. Figure 11 shows the N2 adsorption–desorption isotherms and the corresponding BJH pore size distribution plots of the as-obtained CaTiO3 nanocrystals sintering at different temperatures. The BET surface areas of samples are 7.78 and 6.01 m2/g for 700 and 800 °C, respectively. For comparison, N2 adsorption–desorption isotherm curve and pore size distribution (inset) of CaTiO3 sintering at 600 °C is also shown in Fig. 11. Obviously, the BET surface area of the CaTiO3 nanocrystals decreased with increasing the sintering temperature. Of course, the activity is also relative to the exposed crystal facet of nanocrystals. Reference Hu, Peng and Li34
N2 adsorption–desorption isotherm curves and pore size distribution (inset) of (a) CaTiO3, (b) NiTiO3, and (c) ZnTiO3 nanocrystals sintering at 600 °C for 2 h.

N2 adsorption–desorption isotherm curves and pore size distribution (inset) of CaTiO3 nanocrystals sintering at (a) 600 °C, (b) 700 °C, and 800 °C.

IV. CONCLUSION
In summary, CaTiO3, NiTiO3, and ZnTiO3 nanocrystals were prepared via a facile EG-mediated synthesis route followed by calcination in air. XRD results reveal that CaTiO3 and NiTiO3 are orthorhombic phase, while the ZnTiO3 is orthorhombic phase. The photocatalytic activity of CaTiO3, NiTiO3, and ZnTiO3 nanocrystals for water splitting into H2 was studied. The activity of the CaTiO3 nanocrystals was obviously higher than those of the NiTiO3 and ZnTiO3 nanocrystals, indicating that CaTiO3 is a promising catalyst for water splitting into H2. The BET surface areas of samples are 19.03, 21.13, and 4.17 m2/g for CaTiO3, NiTiO3, and ZnTiO3 nanocrystals, respectively. In addition, the activity of the CaTiO3 nanocrystals increased with increasing the sintering temperature.
Supplementary Material
To view supplementary material for this article, please visit http://dx.doi.org/jmr.2014.110.
ACKNOWLEDGMENTS
This work was supported by the National Natural Science Foundation of China (21171052), the Program for New Century Excellent Talents in University of Ministry of Education of China (NCET-11-0959), the Postdoctoral Science Foundation of Heilongjiang Province (LBH-Q11009), Program for Innovative Research Team in University (IRT-1237), Innovation Team of Education Bureau of Heilongjiang Province (2013TD002), Heilongjiang Province Natural Science Foundation of Key Projects (ZD201301), and Harbin Technological Innovation Talent of Special Funds (RC2013QN017028).