Adult human beings routinely perform many actions, perhaps most, in their daily lives. The mental or physical actions we perform routinely do not require much of our attention; we perform them quickly, often in parallel with other routines. The acquisition of skills takes considerable time and requires much practice, whereas the attrition of skilled behavior among elderly people is a gradual process also (unless caused by sudden incidences like accidents or strokes). First (L1) and second language (L2) acquisition, both in the oral and written modalities, are prime examples of slow and gradual forms of skill acquisition. We become aware of this when we observe young children in struggling to master the production of clusters of speech sounds and, at a later age, learning to read written words. In addition, when we try to learn an L2, our experience is that the acquisition of L2 skills requires an investment of considerable time and effort.
The hallmark of skilled behavior is automaticity, a central notion in cognitive psychology. LaBerge and Samuels (Reference LaBerge and Samuels1974) considered obligatory execution as the prime characteristic of automaticity. Since their seminal study, many researchers have questioned the unitary notion of automaticity, defining it in different ways, including ballistic processing, parallel processing, attention-free processing, effortless processing, unconscious processing, and fast processing. These characteristics do not always coincide, however (Bargh, Reference Bargh1992; Segalowitz, Reference Segalowitz, Doughty and Long2003). There are various well-known theories of skill acquisition in the psychological literature. Among the theories best known are Anderson's adaptive control of thought theory (Anderson, Reference Anderson1983; Anderson & Lebiere, Reference Anderson and Lebiere1998) and Logan's (Reference Logan1988) instance theory. Anderson's theory, based on ideas laid down by Fitts and Posner (Reference Fitts and Posner1967), views automatization as a development starting with conscious, controlled processing of declarative knowledge (i.e., knowledge of facts and rules, such as knowledge of letter features, letter–sound correspondences, and the combination of groups of letters and sounds into larger units, in the case of word recognition), and ending, after much practice, with rapid, attention-free processing consisting largely of routines characterized by “chunks” of elementary operations and computations (Anderson & Lebiere, Reference Anderson and Lebiere1998, p. 5). According to Logan (Reference Logan1988), learners may start off with rules of thumb (e.g., in English, the letter “c” before the letter “e” corresponds to the phoneme /s/, “c” before “a” corresponds to /k/, and “cc” corresponds to /ks/). Each time they perceive a syllable, morpheme, or word in which such a rule is instantiated, they store that higher order unit as an “instance” in their memory. With increasing experience, these instances will become stronger in memory; in other words, their activation levels will rise. Eventually, retrieval of a stored instance will be faster than rule application, and rule application can, therefore, be bypassed. Both theories view automatic processing as effortless and fast, reflected in a decrease of latencies of the task at hand (i.e., word recognition latencies, in the case of a lexical decision task).
The most obvious empirical evidence of skill acquisition is reflected in the decrease of the time needed to perform an acquisition-related action, over the course of the acquisition period. In the study of language acquisition, the task perhaps most widely used, is the lexical decision task. In the written version of this task, on each trial participants see a series of letters that do or do not constitute a word of the language (e.g., book and koob, respectively, in English) and decide whether the letter series constitutes a word or not by pressing one of two buttons or keyboard keys, as quickly as possible. Typically, the stimuli in a lexical decision test comprise a number of word stimuli and a more or less equal number of nonword stimuli, presented in random order. Response performance is measured in terms of accuracy (the number of so-called hits, i.e., the number of yes responses to word stimuli) and speed (the time needed to press the yes key in response to word stimuli, called the reaction time [RT]). Thus, for each participant performing a lexical decision task, a mean RT score can be computed over all hits.
Distributions of RT scores are known to have three characteristics (Wagenmakers & Brown, Reference Wagenmakers and Brown2007, p. 830). First, RT distributions are decidedly nonnormal; they are almost always skewed to the right. Second, this skew increases with task difficulty (e.g., when the stimulus word is a low-frequency word, participants need more time than when the stimulus is a high-frequency word). Third, the spread of the distribution increases with the mean. That is, for most tasks, and across participants (or within participants when the task is performed many times over a period of skill acquisition), the relationship between the mean RT and the standard deviation of the mean (SD RT) is linear. The linear relationship between RT and SD RT has been shown to obtain for a wide range of tasks, with few exceptions (see Wagenmakers & Brown, Reference Wagenmakers and Brown2007, and the literature reviewed there).
The linear relationship is also implied in a number of studies, especially in the domains of psychology and the health sciences, focusing on the variability in speed efficiency rather than on the variability of RT distributions per se. Some of these studies are concerned with variability in speech-segment duration, and were conducted with practical purposes in mind (e.g., speech pathology). Speed efficiency in these studies is expressed by the coefficient of variation (CV), computed by dividing the standard deviation of all responses of a given test taker by the mean RT (CV = SD RT/mean RT). The rationale for using the CV rather than the mean RT is that it is duration variability rather than duration itself that distinguishes people suffering from a pathological deficiency from people in a healthy control group. For example, the effectiveness of the treatment of dysphonia, a speech disorder attributable to a disorder in phonation (hoarseness), can be assessed by comparing the intrasubject variability in the production of sustained vowels, indexed by the CV, before, during and after treatment (e.g., Speyer, Wieneke, & Dejonckere, Reference Speyer, Wieneke and Dejonckere2004). A September 2007 search in the Linguistics and Language Behavior Abstracts database using “coefficient of variation” as a search term produced 32 hits, most in the realm of speech therapy. An identical search in the PsycInfo database produced over 400 hits, almost all pertaining to the study and treatment of psychological disorders. A small island in this sea of CV studies is formed by publications of Segalowitz and associates.
The psychological literature does not offer an empirical means to draw a borderline between slow and effortful RTs and fast and automatic RTs. RTs form a unidimensional scale (Ratcliff, Gomez, & McKoon, Reference Ratcliff, Gomez and McKoon2004). To our knowledge, neither Anderson nor Logan proposed a means to empirically distinguish between slow and effortful processing and fast and automatic processing. Segalowitz and Segalowitz (Reference Segalowitz and Segalowitz1993) proposed a breakthrough in the understanding of automatization in the realm of language skills, a breakthrough of great practical potential for the field of skill assessment. Segalowitz and Segalowitz (Reference Segalowitz and Segalowitz1993) distinguish between fast and automatic processing. Fast processing is the speeding up of essentially all component processes that make up the execution of a task in the earliest stage of skill acquisition. Automatic processing, in contrast, is characterized by a reorganization, routinization, or bypassing of serial execution of component processes. With respect to L2 word recognition in a lexical decision task, automatic processing would mean that word recognition proceeds directly from the printed word to meaning activation without passing through stages of phonological recoding or translation into the L1. Segalowitz and Segalowitz (Reference Segalowitz and Segalowitz1993) proposed the following way to distinguish empirically between speedup and automatization (see also Segalowitz, Segalowitz, & Wood, Reference Segalowitz, Segalowitz and Wood1998). Let us assume that a group of L2 learners is frequently exposed to a set of L2 words during a certain training period and that a lexical decision test is administered before, at various moments during, and after training. In the case of mere speedup, mean RT and its standard deviation (RTSD) will be reduced. However, there will not be a change in the relation between mean RT and RTSD. The index of this relationship, the CVRT, will not substantially drop even though means for RT and SD RT are reduced. In the case of true automatization, however, component processes become more routinized or are eliminated altogether. Hence, not only will mean RT and SD RT reduce, but so will CVRT. Given a set of mean RT and CVRT pairs for a group of participants in a training program, the correlation between mean RT and CVRT should be positive.
We deem the distinction between speedup and genuine automatization and the operationalization of these two constructs as proposed by Segalowitz and Segalowitz (Reference Segalowitz and Segalowitz1993) of great potential importance for the study of automatization and the acquisition of L2 skills in particular. Over the last 5 years or so, automatization of L2 skills has gained interest in the L2 acquisition literature. Recently published handbooks and textbooks pay attention to Segalowitz' views (DeKeyser, 2008, p. 110; Gass & Selinker, Reference Gass and Selinker2008, p. 232–234; Mitchell & Myles, Reference Mitchell and Myles2004, p. 108), whereas the seminal paper of Segalowitz and Segalowitz (Reference Segalowitz and Segalowitz1993) was quoted in 17 journal articles published from 2002 to 2007 (Web of Science, accessed on June 5, 2008). To our knowledge, no other scholars have proposed a distinction of this kind; the standard view is that speedup is just a manifestation of automatization (Ratcliff et al., Reference Ratcliff, Gomez and McKoon2004). Partial support for the distinction between speedup and automatization comes from a number of studies conducted by Segalowitz and associates, as well as from two other studies, reviewed below. Two L2 skill acquisition studies, which we conducted for purposes not directly related to testing the distinction between speedup and automatization, did produce data that lend themselves to testing the distinction. Below we report our findings, which, however, do not provide unequivocal evidence for the distinction between speedup and automatization. The final section of this paper discusses the contrasting findings in the studies by Segalowitz and colleagues and by us, proposing some explanations and offering suggestions for further research.
EVIDENCE INTERPRETED AS SUPPORTING THE DISTINCTION BETWEEN SPEEDUP AND AUTOMATIZATION
In this section we review seven previous studies using the CV in two types of RT tasks: lexical decision tasks (requiring word vs. nonword decisions) and semantic classification tasks (requiring living referent vs. nonliving referent decisions), performed by L2 learners (and sometimes also by native speaker controls). We do not review the aims or research questions of these studies, nor do we report the results of other data gathering measures than those of the lexical RT measures. We focus on the facts relevant in the present context: the reported mean RTs; their variability, expressed by the mean CV; and the correlations between mean RTs and mean CVs. The review may therefore seem give an out of context impression, not doing full justice to the authors' aims, but the CV data are relevant with respect to the question of whether and how support was found for the distinction between speedup and automatization, as proposed by Segalowitz and Segalowitz (Reference Segalowitz and Segalowitz1993).
Study 1: Segalowitz and Segalowitz
The study of L2 acquisition in which the CV was first used, was conducted by Segalowitz and Segalowitz (Reference Segalowitz and Segalowitz1993). Sixty-six French-speaking students, ranging “in English fluency from beginner to near fluent” (p. 278) participated in the study, comprising two experiments. The first one involved a simple, nonlinguistic signal detection task, “not likely to involve differential use of effortful processes” (p. 375). Participants pressed a key in response to visual stimuli appearing after a random interstimulus interval. The standard deviation correlated significantly with RT (r = .61), but CV did not, as expected. In Experiment 2, participants performed a visual lexical decision task with 284 English words and nonwords. The targets comprised, among others, 35 baseline words and 90 repetition items (15 words repeated six times). For the baseline items, the mean RT was 948 ms, the standard deviation was 324 ms, and the mean CV was .32. The standard deviation correlated significantly with RT (r = .90, p < .001), illustrating the linearity assumption mentioned at the beginning of this paper, and CV correlated significantly with RT (r = .72, p < .001), as the authors expected. “This result is consistent with the expectation that, for this complex task, faster subjects used fewer effortful processes that were slower acting or highly variable” (pp. 379–380).
With respect to the repetition word data, the authors report performance of 64 participants for the first and last (sixth) presentation of the 15 target words. Performance of initially fast students (N = 22) and initially slow students (N = 22) was analyzed separately. The mean RT and standard deviation are not reported. CV correlated significantly with RT for the initially fast students both at the first and last presentation (r = .67 and .68, respectively). This was expected. “Individual differences among skilled (faster) subjects at the time of first presentation should reflect a differential use of effortful processes, and therefore CV should correlate positively with RT for the same reasons we saw with the baseline word data from faster students” (Segalowitz & Segalowitz, Reference Segalowitz and Segalowitz1993, p. 381). “In contrast, individual differences among less skilled (slower) subjects that were evident at the time of first presentation should not reflect a differential use of effortful processes, since all subjects will be heavily dependent upon them, as was the case with baseline word data for slow subjects. Thus, CV should not correlate strongly with RT for first presentation words. This is exactly what we found: at first presentation, r = .176 (n = 22, ns). Later, however, these same subjects should show gains in perceptual fluency with repeated items, and so, at the time of the last presentation, there should be a positive correlation between CV and RT. This was indeed the case: at last presentation, r = .507 (n = 22, p < .02); Segalowitz & Segalowitz, Reference Segalowitz and Segalowitz1993, p. 381).
The authors do not report response accuracy for any of the experiments and analyses. Note, furthermore, that the participant sample consisted of students of a wide range of fluency. Finally, and crucially, the authors do not report whether the CV in the repetition data decreased from the first to the sixth response, nor whether the decrease, if obtained, was significant.
Study 2: Segalowitz, Watson, and Segalowitz
The second Segalowitz study (Segalowitz, Watson, & Segalowitz, Reference Segalowitz, Watson and Segalowitz1995) involved one 26-year-old Turkish learner of English, called G.S., “with moderate to high-level reading skill in English” (p. 125), and three native speakers of English, aged 19–23. Participants performed a visual lexical decision task, involving, among others, 120 “base words,” differing in frequency (four sets of 30 words each). G.S. performed the lexical decision task four times in a 3-week period. His error rate was 5%. The 16 CV values of G.S. (four sessions by four frequency bands) range from .14 to .33, showing an overall downward trend only in the band of the words with the lowest frequency (.23, .33, .18, and .19 over time). The lexical decision task also included 15 words, taken from a text that G.S. read several times over the 3-week period of the study, as well as 15 words not present in the text (presumably the other 90 words). RTs and CVs on the studied words showed a downward trend over time, although this was not the case with the control words. Separate analyses conducted on studied and control words revealed that the CV of studied words decreased significantly, whereas the CV of control words did not. Note, however, that these analyses were conducted on RTs of only 10 of the 15 studied words and only 12 of the control words. According to the authors, the result of the analyses on studied and control words by session “supports the idea that purposeful reading of selected words will change the nature of the underlying recognition process—making it more automatic. This conclusion must, of course, be treated as tentative since the different pattern for studied and control words did not reach statistical significance in the interaction term when the data were analysed together” (p. 134).
Study 3: Segalowitz, Segalowitz, and Wood
The third study was conducted by Segalowitz et al. (Reference Segalowitz, Segalowitz and Wood1998). The target language in this study was French, and the participants were 105 Canadian students with L1 English, ranging in French fluency “from beginner to near fluent as determined by a 5-point self-rating questionnaire” (p. 57). All students performed a visual lexical decision task in six sessions spread across 1 academic year, during which they studied French. Word stimuli included, among others, 210 “baseline words,” that students “would be expected to know from pre-university French language training” (such as aller, donner, mettre, and prendre).
Results are reported on responses to 35 base words. On the basis of RTs for the 35 baseline words (correct responses only) taken at the initial test, students were divided into an initially fast group (mean RT < 740 ms, n = 50) and an initially slow group (RT > 740 ms, n = 40).
Each subject's initial score was partialled out from his/her final score and the residuals were saved. The residual RT and the residual CV were correlated, yielding r = .59 (p < .001, n = 39) for the initially fast group, and r = .64 (p < .005, n = 32) for the initially slow group, suggesting that “across both groups, the change in RT was accompanied by a change in CVRT; that is, as subjects improved, they increased their stability of reaction time reflecting, we believe, their increase in automaticity” (Segalowitz et al., Reference Segalowitz, Segalowitz and Wood1998, p. 61). The authors ascribe the fact that there was “increased automaticity” in processing baseline words (“elementary French words for go, take, put, be, come, boy, girl, etc.”) by the end of the course to “the likely possibility they were encountered frequently in the normal course of events in using French.” The CV values of this group are .34 at the initial test (N = 40), .29 at the middle test (N = 33), and .30 at the final test (N = 32). Unfortunately, the authors do not report whether the CV values of the initially slow group decreased significantly.
Study 4: Segalowitz and Freed
The fourth study on the use of the CV measure as an index of L2 skill acquisition, was conducted by Segalowitz and Freed (Reference Segalowitz and Freed2004). Participants in this study were students at an American university (L1 English), studying L2 Spanish, divided into a study-abroad (SA) group (N = 22) and an at-home (AH) group (N = 18). This study involved a range of measures. Here, we report only on the lexical efficiency data. Measurement of lexical efficiency in this study differed in various ways from its measurement in the studies reported above. First, students did not make decisions with respect to whether a letter string represented a word. All stimuli were real words, that is, nouns referring to living (boy) and nonliving (boat) objects. Students responded by pressing one of two keys on a numeric keypad, using the right index finger for “living” and the left index finger for “nonliving.” Second, students performed this task not only in L2 Spanish but also in L1 English. They did so twice, before and after one semester (13 weeks), during which the SA group studied Spanish in Spain, whereas the AH group continued their study of Spanish in the United States. The frequency of the English words were “generally high in written English” (p. 180), such as bicycle, spoon, and comb. Most Spanish words were translations of the English words. Mean error rate across conditions was 5.39% in L1 and 10.53% in L2. Data from participants whose error rate was 21% or greater were not included in the analyses; this reduced the AH group to 14 and the SA group to 15 for some analyses. No information is given on what was done with outlier RTs. The mean RTs for correct responses in the English and Spanish pretest and posttest were submitted to a three-way mixed analysis of variance (ANOVA) with the between factor being context (AH, SA) and the within factors being language (L1, L2) and time (pretest, posttest) The highest order significant effect was a Language × Time interaction, indicating that the 185 ms improvement in response speed in the L2 was significantly greater than the 67 ms improvement in the L1, an overall gain over time in speed of L2 lexical access. A similar three-way mixed ANOVA was conducted on the CV data. The highest order effect was a significant Language × Time interaction, which indicated that the improvement of .084 in the L2 CV was significantly greater than the .018 improvement in the L1 CV, an overall gain in L2 processing efficiency. There was no main effect of context. Correlations between CV and mean RT are not reported.
Study 5: Phillips, Segalowitz, O'Brien, and Yamasaki
This study of Phillips, Segalowitz, O'Brien, and Yamasaki (Reference Phillips, Segalowitz, O'Brien and Yamasaki2004) consisted of two experiments in which 37 and 30 students with English L1 and French L2, respectively, participated, who were divided into more and less proficient users of L2 French. In both experiments, participants performed a semantic classification task (deciding on whether a stimulus word referred to a living or nonliving entity) in L1 and L2, similar to the one used in the study just reviewed (Segalowitz & Freed, Reference Segalowitz and Freed2004). We limit this summary to the RT and CV results. Participants made animacy decisions with respect to 118 filler words, 60 primed target words, and 60 unprimed target words. In Experiment 1, to test whether the high and low proficient bilinguals differed in their level of automaticity on primed and unprimed trials in their two languages, the authors submitted the CV data to a 2 × 2 × 2 mixed ANOVA with the within factors being priming (primed, unprimed) and language (L1, L2) and the between factor being proficiency group (high, low). The language effect was significant, indicating lower CVs (greater automaticity) in L1 than in L2. More important for the present topic was the significant Proficiency Group × Language interaction, indicating that the more proficient bilinguals had similar CVs in L1 (mean CV = .23) and L2 (mean CV = .24), whereas the less proficient bilinguals did not (mean CVs = .21 and .28 in L1 and L2, respectively). An identical pattern of results was obtained in Experiment 2. This result is consistent with the idea that higher levels of L2 proficiency involve, among other things, the ability to make semantic links in an automatic fashion.
Study 6: Harrington
Participants in this study (Harrington, Reference Harrington2006) were 32 intermediate English as an L2 (ESL) students, 36 advanced ESL students, and 42 native speakers of English studying at the English Language Institute of an Australian university. The nonnative participants were from mixed Asian L1s. Participants performed a visual English lexical decision task. Test stimuli were drawn from four frequency bands (18 items/frequency class). The intermediate ESL group was consistently less accurate and slower than the advanced ESL group, who in turn, were less accurate and slower than the English L1 controls. Correlations between CV and mean RT showed a linear relationship with proficiency and frequency. For the intermediate learners, CV–RT correlations did reach significance only in the most frequent word class but not in the three remaining frequency classes. For the advanced learners, CV–RT correlations were nonsignificant in the lowest frequency class but significant in the three remaining more frequent frequency classes. In the case of the native speakers, CV–RT correlations were significant in all four frequency classes.
Study 7: Akamatsu
Akamatsu (Reference Akamatsu2008) trained 47 Japanese first-year university students, who had at least 6 years of prior instruction in English, in seven weekly sessions, lasting only 90 s, to quickly recognize 150 English words. In each session, students had to draw separator lines as quickly and as accurately as possible between words that had been printed with no interword spaces. Before and after training, students took a computer-controlled visual lexical decision test. This test comprised 50 nonwords (25 high-frequency words, 25 low-frequency words); all 50 words had been part of the training set. Thus, the pre- and posttest did not comprise a set of word stimuli that had not been trained. Both accuracy and RT on correct trials improved significantly from pretest to posttest. CV values went down significantly from .19 to .15 in the case of the low-frequency words. CV values did not change significantly in the case of the high-frequency words. Individuals' CV and mean RT were not significantly correlated in the case of high-frequency words, either before or after training. CV and RT were significantly correlated in the processing of low-frequency words, both before and after training. However, the strength of the correlation decreased from .52 before training to .40 after training. This finding is at variance with Segalowitz's claim that, for true automatization, CV–RT correlations should increase. Nevertheless, Akamatsu speculated that, although students in this study had already passed the automatization phase in the case of high-frequency words and that training of these words had only resulted in speedup, training of the low-frequency words had produced a qualitative change, reflecting automatization.
Summary of findings in the seven studies that were reviewed
Participants in all seven studies were college students (age range = 18–30), and they were enrolled in L2 courses at an institution of higher education. Furthermore, students in all studies are described as differing widely in their L2 proficiency, from beginners to very fluent, although in none of the studies students' level of L2 proficiency was independently assessed. Several studies compared participants with themselves, in that participants took the test more than once, that is, before and after a period of L2 exposure (in the case of Studies 3 and 4) or compared RT repetition data within a single test session (in the case of Studies 1 and 2). The studies with within-subject analyses are of special interest because they allow us to determine whether, within subjects, the CV decreases while the CV–RT correlation increases, presumably as the result of L2 exposure and training (in the case of Studies 3 and 4), or as a result of within-test trial repetition (Studies 1 and 2).
The crucial test for whether there is a difference between speedup and automatization, as suggested by Segalowitz, is whether, longitudinally, a decrease in mean RT produces a significant decrease in CV with an accompanying increase in CV–RT correlation. To what extent did the studies reviewed above produce this kind of evidence? Let us examine all seven studies on this particular point. Study 1 (Segalowitz & Segalowitz, Reference Segalowitz and Segalowitz1993), in the analysis of the repetition data of the initially slow participants, does not report whether the CV decreased significantly. In Study 2, Segalowitz et al. (Reference Segalowitz, Watson and Segalowitz1995) analyzed the RTs of a single L2 learner in four sessions. The CV of the studied words (.20, .15, .13, and .13, respectively) decreased significantly, whereas the CV of the control words did not (.16, .15, .19, and .19, respectively), in two separate analyses. There was no significant word type interaction, however, when the CV data of studied and control words were analyzed together. In Study 3 (Segalowitz et al., Reference Segalowitz, Segalowitz and Wood1998), the CV values of the initially slow students who performed the lexical decision task at all three test sessions over the course of a college year, went down but it is not reported how much or whether the decrease was significant. (The CV values of all initially slow students who took the initial, middle, or final test are .34, .29, and .30, but these figures do not pertain to exactly the same individuals each time.) Study 4 (Segalowitz & Freed, Reference Segalowitz and Freed2004) showed that, in an animacy decision task performed twice, with an interval of 13 weeks, CV values in L2 Spanish decreased substantially and significantly (from .33 to .24 in the AH study group (N = 14), and from .32 to .25 in the SA group N = 15). Unfortunately, no information is given whether the accompanying CV–RT correlation increased. Furthermore, note that the error rates of some students were relatively high (data of students with error rates up to 21% were included) and that no information is given about treatment of outlier RTs. In Study 5, Phillips et al. (Reference Phillips, Segalowitz, O'Brien and Yamasaki2004) analyzed RT data of a semantic animacy decision task, performed by bilinguals differing in L2 proficiency. In two separate experiments, CV values of the more proficient L2 learners were significantly lower than those of less proficient learners. This study, however, did not collect RT data from the same individuals at different moments in time, and thus the data do not speak to any decreases in CV over time. Study 6, conducted by Harrington (Reference Harrington2006), produced cross-sectional data, and thus does not allow us to ascertain any within-subject decreases in CV values either. Study 7 (Akamatsu, Reference Akamatsu2008) showed a significant decrease of CV values in the case of low-frequency words (from .19 to .15) but the CV–RT correlation decreased rather than increased. Thus, although the author interprets the findings as evidence for automatization, only two of the three criteria for automatization were met (decrease of mean RT and decrease of CV).
In conclusion, none of the studies reviewed produced the complete, hard within-subject evidence that one would like to see in full support of the speedup versus automatization dissociation claim, consisting of a within-subject decrease of mean RT and a significant decrease in CV. We acknowledge, however, that it cannot be ruled out that, if information on all measures were available, the results of at least some of these studies might provide full support for the dissociation between speedup and automatization as proposed by Segalowitz and colleagues.
CV ANALYSES IN THE NELSON PROJECT
In this section we report on previously unpublished RT and CV analyses based on data collected in two studies, forming part of a project usually referred to with the (Dutch) acronym NELSON. In one study within the NELSON project, we investigated the role of components of L1 and L2 reading and writing proficiency among high school students in The Netherlands (L1 Dutch, and L2 English as a foreign language). We reported on this study in Schoonen et al. (Reference Schoonen, Van Gelderen, De Glopper, Hulstijn, Snellings, Simis, Ransdell and Barbier2002, Reference Schoonen, Van Gelderen, De Glopper, Hulstijn, Simis and Snellings2003) and in Van Gelderen et al. (Reference Van Gelderen, Schoonen, De Glopper, Hulstijn, Snellings and Simis2003, Reference Van Gelderen, Schoonen, De Glopper, Hulstijn, Simis and Snellings2004, Reference Van Gelderen, Schoonen, Stoel, De Glopper and Hulstijn2007). From this study, we here report CV analyses of RT data collected in four RT tasks, administered in L2 and L1, in a longitudinal design, comprising three rounds of measurement, spanning 48 months (see Study 1 subsection). The NELSON project also included an experimental study focusing on the potential effect of training in L2 word recognition on L2 reading (Fukkink, Hulstijn, & Simis, Reference Fukkink, Hulstijn and Simis2005). For other studies in the NELSON project, we refer the reader to the NELSON Website (see de Glopper et al., Reference de Glopper, van Gelderen, Schoonen, Hulstijn, Snellings and Stevenson2004). Here, we present the results of CV analyses, conducted on RT data collected in the first training experiment reported in Fukkink et al. (Reference Fukkink, Hulstijn and Simis2005; see Study 2 subsection). As in the review above, we do not present detailed information concerning the aims, method, or results of our studies; we only describe the RT tasks and present the results concerning the CV. We point out in advance that the participants in the studies reviewed above were college students, but the participants in our studies were secondary-school students in Grades 8, 9, and 10 (Van Gelderen et al., Reference Van Gelderen, Schoonen, Stoel, De Glopper and Hulstijn2007) and Grade 8 (Fukkink et al., Reference Fukkink, Hulstijn and Simis2005).
Study 1. The nonexperimental longitudinal study
Data reported here were collected in a large longitudinal study reported in Van Gelderen et al. (Reference Van Gelderen, Schoonen, Stoel, De Glopper and Hulstijn2007) on receptive skills and in Schoonen, Van Gelderen, Stoel, Hulstijn, and De Glopper (Reference Schoonen, Gelderen, Stoel, Hulstijn and De Glopper2009) on productive skills.
Participants. Participants in this study were 397 students of four lower track and four higher track schools in the secondary school system (ranging from prevocational to preacademic), in and around the cities of Amsterdam, Rotterdam, and The Hague. Half of the schools had a large population of bilingual or nonnative students, most of them from Moroccan, Turkish, or Surinam backgrounds. Across schools and tracks, an average of 29% of the students reported to come from a bilingual home. Despite this incidence of bilingualism among the students, we use the labels L1 for Dutch and L2 for English to refer to Dutch as the dominant language (but not necessarily the L1) and English as the most important foreign language (but not necessarily the L2) for all participants. At the first round of data collection, students were in Grade 8 (age 13–14 years) and had received on average 2 years of English instruction in elementary school (1 hr/week) and 1.5 years in secondary school (2–3 hr/week). All tests were administered three times, when students were in Grades 8, 9, and 10. Not all students were present when the tests were administered. The analyses reported here therefore differ with respect to the number of subjects (range = 191–215).
Tasks. Each year, students took a test battery of 21 tests, 9 of which were computer-administered RT tests. We focus here on these RT tests (four tasks administered in L1 and L2, and one language-neutral task [typing fluency]). The four language tasks were designed to cross word and sentence levels with reception and production, as illustrated in Table 1. Tests were identical across time, comprising the same items each year.
The four reaction time tasks in the longitudinal study

LEXICAL DECISION. The L1 Dutch lexical decision task comprised 120 strings of three to eight letters, 60 common words (such as the equivalents of kiss, car, animal, crown, anchor, flute, palace) that students were expected to be familiar with, and 60 nonwords. The L2 English lexical decision task also comprised 120 strings of three to eight letters, 60 monosyllabic words (nouns, verbs, adjectives, adverbs), and 60 nonwords.
LEXICAL RETRIEVAL (PICTURE NAMING). Students saw pictures one at a time (e.g., of a cheese) and typed the first letter of the corresponding word (c [for cheese] in the L2 English test, or k [for kaas] in the L1 Dutch test). Examples of L2 English items are cheese, flag, car, flowers, key. The L1 and L2 tests comprised 39 and 38 items, respectively.
SENTENCE VERIFICATION. Sentence verification was tested with a format analogous to the visual lexical decision task. The stimuli consisted of one or two sentences. The meaning of half of the stimuli made sense (the sensible items), whereas the meaning of the other half did not (the nonsense items). Students had to decide as fast as they could whether or not an item made sense by pressing a yes or no key. An example of a sensible item in L2 is The man went to bed because he wanted to sleep. An example of a nonsensical item is Most bicycles have seven wheels. Items were construed in such a way that students needed not more than common everyday knowledge for providing a correct answer. The L1 and L2 tests contained 36 and 24 identical items across years.
SENTENCE PRODUCTION. In this computer-administered task, students were presented with the beginning of a sentence (e.g., After some time . . .). They then had to choose, as quickly as possible, by pressing the corresponding key, which of two constituents, also shown on the screen (e.g., 1. woke up and 2. she), would best continue the sentence's beginning. One option met the criterion of grammaticality (option 2 in this example: After some time she woke up), while the other did not (option 1 in this example: After some time woke up she). Although this task is not productive in the sense that students were entirely free in sentence production, they had to mentally construct or generate the sentence to select the correct response alternative. The L1 and L2 tests contained 43 and 44 items, respectively.
Data cleaning. For all L1 and L2 tests, we calculated mean RTs of correct answers (hits). To obtain valid speed measures, we carried out the following scoring procedure. First, the data were screened for outlier RTs on individual items. The RTs of a group of six “experts” (adult native speakers of Dutch who were also advanced L2 speakers of English and an adult native speaker of English who was also an advanced L2 speaker of Dutch) provided the fastest possible RTs in each test. RTs faster than the fastest reactions in this expert group were regarded as outliers, because it was considered highly unlikely that such fast reactions were based on genuine processing of the items. At the other (slow) extreme, RTs of more than 3 SD above the mean of each item were also defined as outliers. All outlier reactions and incorrect answers (called misses) were transformed into missing values. Second, because the speed tests were intended to measure speed of processing and should not be confounded with accuracy of linguistic knowledge, we included in the analyses only responses on the items with high hit rates. In the lexical decision, sentence construction and sentence-meaning verification tasks, the cutoff point was set on .875 (a 75% correct score, with the chance level for guessing added). In the lexical retrieval task, having a much lower chance of guessing, the cutoff point was set at 75%. This procedure resulted in the exclusion of a substantial number of items. Table 2 shows the number of items included in the analyses, for each of the eight tasks. Third, to prevent estimates of a students' ability from being based on too few observations, we regarded students scoring less than 62.5% hits on a speed test as missing for the whole test. Fourth and finally, all missing values in the speed tests were estimated according to the expectation maximization (EM) algorithm (cf. Acock, Reference Acock1997).
Descriptive statistics in the longitudinal study and results of repeated measures ANOVAs for each variable

Note: ANOVAs, analyses of variance; RT, reaction time; SD, standard deviation; CV, coefficient of variation; L2, second language; L1, first language.
Results
Students became faster over time (Years 1, 2, and 3) in all four language tasks in both L2 and L1, as illustrated in Table 2. In all tasks, a significant decrease of mean RT and mean standard deviation over the years was found in ANOVAs with time as the within-subject factor (Years 1, 2, and 3) conducted on mean RT and mean standard deviation of those students who performed the task each year. Additional analyses with home language as a between-subject variable (Dutch versus non-Dutch/ bilingual) showed that this was true for both the majority of Dutch and the minority of non-Dutch/bilingual students. We did not obtain a significant interaction between time and home language. As expected in a study on skill acquisition, the skewness of the distributions in all tests increases from Year 1 to Year 3, except in the case of L1 lexical decision (producing the fastest RTs of all tests). In that case, skewness does hardly increase although mean RT decreases significantly.
However, the crucial finding is that, in contrast to what was expected on the basis of Segalowitz's work, we found a significant decrease in CV (lexical retrieval in L2 and L1) in only two tasks. In three tasks (sentence construction in L1 and sentence verification in L2 and L1) a significant increase in CV was obtained; in the three remaining tasks, the CV did not change significantly. Note that although the CV changed significantly in five tasks (going down or up), the changes were extremely small. Given the low values of partial eta squared, we conclude that in all eight tasks the CV remained more or less constant. Across tasks the CV–RT correlation remained low (range = −.34 to .32), although sometimes significant (probably because of the large sample size), whereas the RT and standard deviation correlation remained high (between .54 and .73), in line with the linearity assumption referred to in the introduction of this paper (Wagenmakers & Brown, Reference Wagenmakers and Brown2007).
Although not pertinent to the issue of this paper, we report some more results, showing how surprisingly consistent the pattern of results is across tasks and student groups. Within tasks, we always obtained significant, positive speed correlations, first, between L2 and L1 each year (r = .19–.54); second, among Years 1, 2, and 3 in L2 (range = .58–.73); and third, among Years 1, 2, and 3 in L1 (range = .51–.83).Footnote 1
Study 2. The experimental training study
We now present the results of extra analyses conducted on the RT data of a small training study, reported by Fukkink et al. (Reference Fukkink, Hulstijn and Simis2005).
Participants. Participants in this experiment were students from two intact Grade 8 groups (ages 13–14) of a secondary school in Amsterdam. The students had received English instruction for a period of 3.5 years on average (2 years in elementary school) when the experiment took place. We have complete data for 41 students.
Task and design. Students performed a visual lexical decision task before and after a training aimed at speeding up the mapping of word forms with their meanings. The selected English words came from a list of approximately 1,000 words compiled by Willems and Oud-de Glas (Reference Willems and Oud-de Glas1990) that consisted of words occurring in the seven most frequently used English textbooks in Dutch secondary schools. By selecting words from this list, we intended to maximize the likelihood that the students were familiar with the lexical material. Pseudowords came from Woutersen (Reference Woutersen1997). The pre- and posttest contained 100 word stimuli and 90 pseudoword stimuli in random order. Examples of word stimuli are afraid, bad, calm, day, say, and street; examples of pseudowords are brack, jemmery, shover, tead, and whire. The set of 100 target words was subdivided into 40 words for training, 40 control words (which only appeared in the pre- and posttest), and 20 so-called “context words,” occurring in the carrier sentences of the second exercise type of the training (described below). The context words were not the target of the training, but, in contrast to the control words, they did appear in the exercises at least once.
Training. The training aimed at automatization of word recognition by means of a consistent mapping of the L2 word form with the corresponding meaning (L1 translation). During two 40-min class periods, students completed exercises with the aid of laptop computers, under increasing time pressure. In the two training sessions together, each word of the training set appeared 11 times (details are given in Fukkink et al., Reference Fukkink, Hulstijn and Simis2005).
We believe that these data lend themselves particularly well for an investigation into CV reduction because of their ecological validity. First, target words were chosen that students were likely to be familiar with before training. This expectation was borne out, as pretest performance on the trained words was highly accurate (94.3% correct). Thus, following the conventional distinction between declarative and procedural knowledge, one could argue that the students in this study did already possess declarative knowledge before training. In other words, the training was not aimed at establishing declarative knowledge, but rather at proceduralizing it. Thus, our data are particularly suited to test whether the training produced automatization or only speedup, as distinguished by Segalowitz and Segalowitz (Reference Segalowitz and Segalowitz1993). Second, the purpose of the training was to reinforce word knowledge and increase word retrieval speed. Target words were presented in the context of meaningful sentences, reinforcing the processing of form–meaning links essential for meaningful language use, and this was done repeatedly under instruction to perform both accurately and fast. The computer tests gave students feedback with respect to the accuracy and speed of their performance after every set of 10 responses. The speed feedback showed the picture of a rocket when the mean speed in the current set was faster than in the previous one, or a rowing boat in the reverse case, accompanied with verbal encouragements to try to respond (even) faster. Third, the 40 target-word items were appropriately “hidden” in the pre- and postlexical decision test, containing 190 items, 90 pseudoword (nonword) items, and 100 word items, the latter group divided into three categories: 40 trained words, 40 control words, and 20 so-called context words, occurring in the carrier sentences that were part of the training materials. For these reasons, the setting was particularly suitable for producing automatization as defined by Segalowitz to be reflected by a significant reduction in CV values from pretest to posttest.
Results
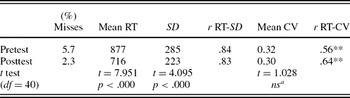
First analysis. We first conducted an analysis on the raw RTs (ms) of the correct responses. (RTs of misses, i.e., no responses to real words, were recoded as missing value.) Table 3 gives the results of this first analysis, conducted on the RTs of all hits, with outliers included. Pretest RTs ranged from 174 to 2888 ms. Posttest RTs ranged from 92 to 2548 ms. RTs faster than 300 ms, which can be considered of doubtful validity, were hardly obtained (three RTs in the pretest and seven RTs in the posttest).
Reaction times on 40 trained words in pre- and posttest (N = 41) for descriptives and t tests

Note: RT, reaction time; SD, standard deviation; CV, coefficient of variation.
aIn Fukkink, Hulstijn, and Simis (Reference Fukkink, Hulstijn and Simis2005), we reported a significant CV decrease (table 1, p. 60). The results reported in that table, however, are incorrect because of an error in data cleaning before statistical analysis.
**The correlation is significant at the .01 level (two tailed).
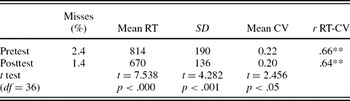
As expected, participants performed more accurately after than before training. There were 94 (5.7%) and 42 (2.3%) misses in pre- and posttest, respectively. A breakdown of misses by participant showed that, in the pretest, four participants had between five and seven misses and the remaining 37 participants had between zero and four misses. In the posttest, one participant had nine misses, one participant had five misses, and the remaining 39 participants had between zero and three misses. As predicted by the literature referred to in the introductory section, the relation between RT and RTSD is close to linear (r = .84 and .83 in pre- and posttest, respectively; the scatterplots do not reveal a curvilinear relationship). It is crucial in light of the purpose of the analysis however that, although we found a significant decrease in mean RTs and an increase in RT–CV correlation (albeit not significant), CV values did not decrease significantly. Thus, no evidence for automatization as defined by Segalowitz and Segalowitz (Reference Segalowitz and Segalowitz1993) was found.
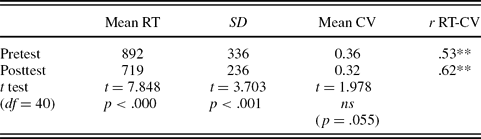
Second analysis. In the second analysis, all missing data (misses) were estimated. All zero values (misses) in the raw data set were estimated with EM. This was done for the pretest and posttest data separately. Outliers were left intact. This analysis did not produce a significant decrease of CV either (see Table 4).
Reaction times on 40 trained words in pre- and posttest (N = 41) for descriptives and t test
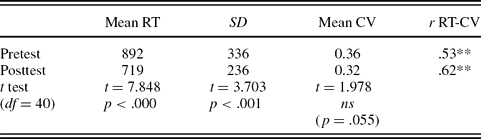
Note: RT, reaction time; SD, standard deviation; CV, coefficient of variation. All misses were estimated with expectation maximization. Outliers were left intact.
**The correlation is significant at the .01 level (two tailed).
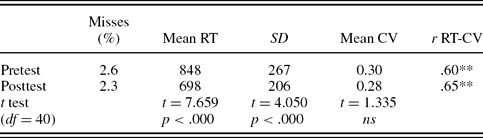
Third analysis. In studies of automatization, it is important that comparisons between pre- and posttest performance be conducted on words already known in the pretest. The reason for this is that one wants to investigate whether knowledge already present at one point of time, becomes more automatically available at a later point of time, as the result of frequent processing between these two points. In other words, if the pretest accuracy score is not close to 100%, although the posttest accuracy score does approach 100%, the researcher runs the risk of comparing pre and posttest RT and CV values not obtained on the same word items, even though RT values are computed on correct responses only (hits). Taking this consideration into account, we conducted an analysis on the responses on the 32 items that, in the pretest, had produced no more than three misses, and compared these responses with those on the same 32 items in the posttest. By excluding 8 items, the percentage of misses decreased to 2.6% in the pretest while remaining at 2.3% in the posttest, respectively. In the pretest, no participant had more than two misses, in the posttest, three participants had seven, four, and three misses, respectively, while the remaining 37 participants had between zero and two misses. Descriptives and t test results are shown in Table 5.
Reaction times on 32 trained words in pre- and posttest (N = 41) for descriptives and t tests
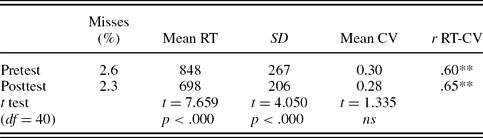
Note: RT, reaction time; SD, standard deviation; CV, coefficient of variation.
**The correlation is significant at the .01 level (two tailed).
Pretest RTs ranged from 174 to 2888 ms. Posttest RTs ranged from 117 to 2356 ms. A breakdown of misses by participant, showed that, in the pretest, one participant had four misses, whereas the remaining 40 participants had between zero and two misses. In the posttest, 1 participant had seven misses, 1 had four, 1 had three, while the remaining 38 participants had between zero and two misses. As in the previous analyses, CV values did not decrease significantly.
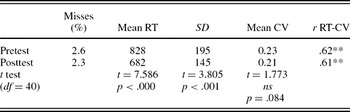
Fourth analysis. As recommended by Segalowitz (personal communication, May 30, 2007) and applied by Phillips et al. (Reference Phillips, Segalowitz, O'Brien and Yamasaki2004), we then winsorized the raw RTs on the 32 items in pre- and posttest in the following way: for the RTs of each individual participant, the three fastest and the three slowest RTs were replaced with the values of the next fastest and slowest trials, respectively, to remove the impact of outliers within each participant's data set. In the pretest, in the case of 10 participants, one of the three fastest RTs was shared by two responses. In these cases, we replaced not three, but four RTs. In the posttest, this occurred with five participants. After winsorizing, the fastest and slowest RTs were 398 and 2088 ms in the pretest and 342 and 1572 ms in the posttest. Descriptives and t test results are provided in Table 6. The mean CV did not drop significantly.
Reaction times, winsorized at 10%, on 32 trained words in pre- and posttest (N = 41) for descriptives and t tests

Note: RT, reaction time; SD, standard deviation; CV, coefficient of variation.
**The correlation is significant at the .01 level (two tailed).
Fifth analysis. As already mentioned, one participant had more than four misses in the pretest, and three participants had more than two misses in the posttest. To even more increase the validity of the data, we removed the responses of these four participants, so that no participant had more than two misses, in the pretest or in the posttest. We then conducted the same analysis as in the fourth analysis. The results are shown in Table 7. In this analysis, the CV reduction was found to be significant.
Reaction times, winsorized at 10%, on 32 trained words in pre- and posttest (N = 37) for descriptives and t tests

Note: RT, reaction time; SD, standard deviation; CV, coefficient of variation.
**The correlation is significant at the .01 level (two tailed).
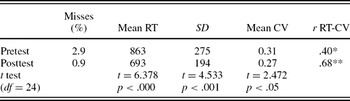
Sixth analysis. We then returned to our initial data set of raw RTs used for the first analysis and removed all cases (students) with more than two misses on either pre- or posttest, as in the fifth analysis. This resulted in a reduction of total numbers from 41 to 25. The results of the analyses are shown in Table 8. CV reduction was found to be significant.
Reaction times on 40 trained words in pre and posttest (N = 25) for descriptives and t tests

Note: RT, reaction time; SD, standard deviation; CV, coefficient of variation.
**The correlation is significant at the .01 level (two tailed).
In summary, for reasons mentioned above, the RT data of this experiment form an excellent ground for testing the prediction that CV values should significantly decrease as the result of a training aimed at routinizing word recognition skills. We conducted six analyses, using various methods of data cleaning. Only in two analyses did we obtain a significant reduction of the CV values from pretest to posttest, that is, when we excluded responses of students with more than two misses. The application of this stringent filter on correct knowledge of the words used in the lexical decision task resulted in a reduction from 41 students in the original sample to 37 in the case of winsorized RTs (fifth analysis) and from 41 to 25 students in the case of the raw RTs (sixth analysis). However, with none of the other data handling methods (Analyses 1–4), did t tests produce a significant CV reduction. We thus failed to find evidence for automatization as defined by Segalowitz and Segalowitz (Reference Segalowitz and Segalowitz1993) in four analyses and did find evidence in two analyses.
DISCUSSION
We first reviewed seven studies in the realm of L2 and L1 use, five of which were coauthored by Segalowitz. These studies failed to produce complete, hard evidence of significant CV reduction with a significant RT reduction, in within-subject designs. We then reported on two studies of ourselves. In the first study, a large longitudinal study involving eight tasks administered three times over a 2-year period, we obtained a CV decrease only in two of eight analyses (lexical retrieval in L2 and L1). Using a more manageable dataset than the one of Study 1, we then conducted an in-depth investigation, ideally suited for proving Segalowitz's CV proposals right (Study 2). This study adopted a pretest–training–posttest design. In two of six analyses we obtained support for Segalowitz's automatization proposal.
In this section, we first discuss several conceptual and mathematical issues concerning the use of the CV. We then address the nature of the elicitation tasks used in our Study 1 (sentence vs. word tasks, receptive vs. productive tasks, task conducted in L1 vs. tasks conducted in L2) and several procedures of data cleaning. We then draw conclusions with respect to the alleged preference of the CV over the mean RT as an index of skill acquisition, adding some recommendations for data cleaning before statistical analysis. We round the Discussion section off with some reflections on the essence of automaticity in terms of processing duration (and its variability, as expressed by the CV) and processing effort.
Disproportional and proportional reduction of variability
Segalowitz and Segalowitz (Reference Segalowitz and Segalowitz1993) argue that a CV reduction reflects a decrease in variability relative to the mean RTs, that is, an increase in performance stability. They are right. However, note that a decrease in variability as indicated by the CV can be the result of a speedup as well. When in a set of responses only the slower responses speed up, or the slower responses speed up more than the fast responses, the CV will decrease but this does not necessarily mean that some subprocesses became automatized. When all response times decrease to the same proportion, the CV does not decrease, however. This is what happened in our Study 1, in which several hundreds of L2 learners performed eight tasks, each three times, with 1-year intervals (Table 2). Mean RTs and mean standard deviations went down by roughly the same proportion, implying that, in absolute terms, initially slower RTs accelerated more than initially faster RTs, leaving mean CVs at roughly the same level (two small decreases, three small increases, and three unchanged CVs). Segalowitz and Segalowitz might call this speedup. We do not object to using this label, but we emphasize that not only in the case of automatization, marked by CV reduction, but also in the case of speedup, in which the CVs remain at the same level, initially slower responses accelerate more than initially faster responses.
Furthermore, one may wonder whether the fastest responses have not reached the state of being automatic responses. Conversely, if we think of a response as consisting of three subprocesses and when, in restructuring the response process (i.e., during the period of automatization), the most stable of the three subprocesses gets skipped and the response thus remains to consist of the two less stable subprocess, the CV of the total response will actually increase.
Improvement of knowledge as a confounding factor in assessing improvement of processing efficiency
The six data cleaning methods in Study 2 produced different outcomes. The true cause of this is that real RT data are always “noisy” to some extent. This noise is caused by, among other things, performance lapses (e.g., a participant who correctly recognized a word stimulus but inadvertently pressed the NO key, producing a miss) or insufficient word knowledge (when a participant does not recognize a letter string as representing a genuine word and presses NO, also producing a miss).
Of the seven studies reviewed above, Study 1 (Segalowitz & Segalowitz, Reference Segalowitz and Segalowitz1993) does not report response accuracy. In Study 2 (Segalowitz et al., Reference Segalowitz, Watson and Segalowitz1995) the error rates of the L2 learner G.S. on studied words was 2% overall, but no figures are given for all four test sessions separately. Thus, it cannot be ruled out that error rates decreased over time. In Study 3 (Segalowitz et al., Reference Segalowitz, Segalowitz and Wood1998) the error rates were below 3% overall, but no separate figures are given of the three testing rounds over time. Study 4 (Segalowitz & Freed, Reference Segalowitz and Freed2004) reports high error rates in L2. Analyses were performed on data of participants with up to 21% errors. In Study 5 (Phillips et al., Reference Phillips, Segalowitz, O'Brien and Yamasaki2004) the error rates are again reported across conditions and time (5.5% and 5.3% in L2 learners in Experiments 1 and 2, respectively). Study 6 (Harrington, Reference Harrington2006), adopting a cross sectional design, clearly showed that performance accuracy and speed were both affected by L2 proficiency and word frequency. Study 7 (Akamatsu, Reference Akamatsu2008) found a significant CV reduction of the low-frequency words (from .19 to .15), but this was accompanied by an increase of performance accuracy (from 84% to 94%). Thus, to the extent that these seven studies report on longitudinal data, none of them found that the decrease in RT and CV was observed on the basis of correct responses to the same word stimuli.
The participants in our Studies 1 and 2 had all been exposed to the words used as stimuli. Yet their performance was not fully accurate. Only three of the 41 students in Study 2 did not make any errors (i.e., production without misses) in the pretest. For the sample as a whole, the percentage of misses decreased from 5.7% to 2.3% (Table 3). Thus, CV computations tend to be confounded with differences in accuracy.Footnote 2 This suggests that improvement in processing efficiency coincides with improvement in declarative knowledge.
There are two mathematical methods of escaping this confound problem. One is to limit analyses to data produced by participants who made very few or even no errors at all or limit analyses to test items that produced few erroneous responses. This is what we did in the third analysis compared to the second (Tables 5 and 4), in the fifth analysis compared to the fourth (Tables 7 and 6), and in the sixth analysis compared to the first (Tables 8 and 3). Two of these three attempts resulted in significant CV reductions (Tables 7 and 8). It is difficult to evaluate the appropriateness of the method of leaving out the data of items or participants with low accuracy. We might say that this method increases the validity of the processing efficiency measure (CV) because it removes the confounding knowledge dimension, or we could say that the method decreases the validity of the processing efficiency measure because it throws away a substantial proportion of the data.
The second escape method is to define all misses as missing data and let the statistical program produce estimations of the missing data. The resulting data matrix does not show inaccurate responses anymore. It is as if all participants recognized all word stimuli correctly. We applied this procedure in all eight tasks of our Study 1 and in the second analysis of Study 2 (Table 4), obtaining no significant CV reductions. A discussion of the pros and cons of various estimation methods is beyond the scope of the present article (Rubin, Reference Rubin1996), but it is important to be aware of the potential dangers of applying estimation methods on data with a large proportion of missing data.
Let us return to the question of finding an appropriate account of the findings. Segalowitz and Segalowitz (Reference Segalowitz and Segalowitz1993) conceive of genuine automatization as the reduction or elimination of relatively variable component processes, bringing about a reduction of the mean CV. We acknowledge that the findings of the seven studies reviewed and of the two studies reported do not falsify this account. Thus, Segalowitz and Segalowitz' challenging hypothesis remains on the table of the research community. However, gains in knowledge itself and gains in processing it cannot be adequately disentangled in the RT tasks used in the studies reviewed and reported. This may not just be an unfortunate feature of the RT tasks but may be an inherent characteristic of language learning. Although conceptually skill acquisition can be distinguished from knowledge accumulation, in reality, knowledge accumulation forms part of skill acquisition because, in real L2 learning, exposure to new words goes hand in hand with exposure to words encountered before. L2 learning is both a matter of knowledge accumulation and of an increase in the efficiency with which that knowledge can be processed in knowledge-access tasks (listening and reading) and in knowledge-retrieval tasks (speaking and writing).
The nature of the task
Our Study 1 produced RT data in word tasks (lexical decision and lexical retrieval) as well as data in sentence tasks (sentence verification and sentence production). In contrast, all other studies mentioned in this article produced data of receptive word tasks only (lexical decision or animacy decision). Obviously, in the case of the sentence tasks, RTs are much longer than in the case of the word tasks and productive tasks produce longer RTs than receptive tasks (Table 2). One might argue that RTs substantially longer than 1000 ms cannot capture automatic processes because the notion of automaticity is associated with very fast processes. We would disagree with such a claim. It seems to us that sentence tasks might give even more room for deletion or reduction of component processes over the course of skill acquisition than word tasks. In sentence processing, language users have to integrate a wide variety of linguistic information to arrive at the correct interpretation or production of a sentence, such as word order information, information with respect to free and bound grammatical morphemes, as well as prosodic information (in oral tasks), all this on top of lexical information contained in content words. Even information at the lexical level must be processed on more features in a sentence task than in a word task, because the grammatical features of content words must be processed in sentence tasks, although this is not necessary in word tasks such as lexical decision and animacy decision. We acknowledge that a RT in a RT task reflects more than the duration of the process or processes one wants to tap. RTs include a stage of sending response instructions to the motor system, and execution of the required motor response. Thus, RT measurement is relatively noisy. But there are no reasons to assume that the noise in sentence-task responses should be greater than the noise in word-task responses. On the contrary, a noise component X forms a smaller proportion of longer RTs in a sentence task than of shorter RTs in a word task.
L2 versus L1 tasks
For each of the four tasks in our Study 1, we measured performance not only in L2, the foreign language our students were acquiring, but also performance in students' L1. Recall that students were 13–14 years old in the first year of measurement. In all four tasks, performance in L1 decreased significantly over time (Table 2), showing that the acquisition of L1 skills for students at this age and at this level of education has not yet come to a halt (or to a decline). We believe that the L1 data reflect skill acquisition phenomena just as the L2 data do. The fact that performance in L1 was faster than in L2 (with the exception of sentence verification in Year 3, see Table 2) and that the increase in speed over time in L1 was smaller than the increase in speed in L2, can be simply accounted for by the well known power law of practice with performance reaching an asymptote after long practice (Newell & Rosenbloom, Reference Newell, Rosenbloom and Anderson1981).
Data cleaning
The earlier studies conducted by Segalowitz and colleagues do not report on data cleaning procedures. In the later studies, as well as in the studies conducted by Harrington (Reference Harrington2006) and Akamatsu (Reference Akamatsu2008), outlier RTs were replaced by values of 2 SD from the mean (Study 1, Segalowitz & Segalowitz, Reference Segalowitz and Segalowitz1993; Study 7, Akamatsu, Reference Akamatsu2008), 2.5 SD from the mean (Harrington, Reference Harrington2006), 3 SD from the mean (our first study reported above, only at the slow end of the RT distribution), or winsorized at the 10% level (Study 5, Phillips et al., Reference Phillips, Segalowitz, O'Brien and Yamasaki2004). No data cleaning information is given in Study 2 (Segalowitz et al., Reference Segalowitz, Watson and Segalowitz1995), Study 3 (Segalowitz et al., Reference Segalowitz, Segalowitz and Wood1998), or Study 4 (Segalowitz & Freed, Reference Segalowitz and Freed2004). The rationale of removing or replacing extremely long and extremely short RTs is, of course, the consideration that such RTs cannot be considered to be a valid measure of the processes under investigation. There is a risk, however, of excluding RTs at the ends of the distribution curves because the empirical evidence of investigations on CV reduction is formed by the standard deviation, which, first and foremost, is an index of variability. By cutting off the tails of the distribution, the researcher artificially reduces the variability in the raw data. Analyses 3 (Table 5) and 4 (Table 6) of our Study 2 reported above, illustrate what happens under winsorizing. Altghough mean RTs are hardly affected, the mean standard deviations are, which in turn, leads to a drastic reduction of the mean CVs. In retrospect, we deem the procedure that we adopted in Study 1 is the best one to recommend for future research for three reasons. First, by having experts perform the task, a lower bound of the RT for each stimulus is obtained, providing a valid fastest RT for the population under investigation. Second, at the slow end, a value of 3 SD above the mean excludes the risk of including invalid RT data in the analysis. Third, and most importantly, we do not recommend replacing scores higher than 3 SD from the mean by the value of 3 SD because this causes an artificial reduction of the variability of the data, potentially biasing the theoretically hypothezised reduction of variability. Instead, we recommend replacing the extreme scores, thus defined by missing values and subsequently dealing with these missing values using generally accepted methods (see Rubin, Reference Rubin1996).
CV or RT as an index of skill?
As Harrington (Reference Harrington2006) put it, “Unlike a comparison of the separate mean RTs and SDs, the CV provides a single index of variability that is independent of absolute differences in RTs. It thus can be used to compare individual and group performance independent of mean RT differences, as well as performance across tasks that make different response time demands” (p. 151). We agree. As we said at the beginning of this article, the CV has proven its worth in studies in various domains of psychology and the health sciences, focusing on the variability in speed efficiency rather than on the variability of RT distributions per se, such as speech-segment duration. Our call for cautiousness in the use of CV measures does not pertain to these efficiency studies, as they do not rest on claims with respect to a fundamental distinction between speedup and automatization. For the study of the development of a skill in a normal population not characterized by particular mental or physical disabilities or deficiencies, Segalowitz and Segalowitz (Reference Segalowitz and Segalowitz1993) made a challenging claim with respect to the distinction between speedup and genuine automatization, the latter being characterized by a disproportionate decrease in the variability of response latencies, the former by an absence of such a decrease. In principle, this hypothesis has great explanatory potential and thus deserves proper testing. In this article, we have reviewed the empirical evidence in its favor and found it rather meager. Furthermore, we discussed some psychometric features of CV computations. CV reduction marks reduction in response variability, but a decrease in mean RT and in accompanying mean standard deviation does as well. The difference is that the latter reflects a proportional reduction of variability, whereas the former reflects a more than proportional one. We wonder whether a mathematical distinction so subtle should be taken as forming the empirical litmus test for a conceptual distinction so important. Caution with respect to using the CV reduction as a criterion for the distinction between speedup and automatization is further warranted because of the fact that RT tests, as used in all studies reviewed and reported here, inherently suffer from confounding measuring improvement in response efficiency with measuring improvement in declarative knowledge. The methods presented and discussed cannot fully ameliorate this serious methodological problem.
However, if researchers choose to use the CVRT as an index of individual differences in proficiency, we recommend that they report in detail how the raw data were cleaned before applying statistical analyses, taking into account the following: (a) the number of test items to which participants responded with sufficient accuracy, (b) the treatment of missing data (no response and misses), and (c) the treatment of outliers (definition of outliers and method of score replacement).
Skill acquisition, manifested by increased processing efficiency, goes hand in hand with knowledge acquisition, manifested by increased response accuracy. With increasing L2 exposure and practice, L2 learners both encounter new words, establishing new form-meaning links in their mental lexicons, and they encounter old words, more firmly establishing form-meaning links already existing in their mental lexicons. The result of both these processes is that, in tasks requiring lexical access or lexical retrieval, lexical knowledge becomes available more quickly and with fewer errors.
In conclusion, the proposal of Segalowitz and Segalowitz (Reference Segalowitz and Segalowitz1993) that genuine automatization is characterized by a reduction or elimination of initially highly variable component processes, remains a viable hypothesis, although it is difficult to test. The studies reviewed and reported in this paper produced little evidence in its support. Analyses of CV reductions in responses in word and sentence processing tasks as reported in this paper, appear to be too indirect to serve this purpose. The challenge for future research is to design more sophisticated psycholinguistic tasks, capable of tapping component processes more directly.
Automaticity: Speed or effort?
As we said in the introduction of this paper, the literature has defined automaticity in different ways as obligatory, ballistic, parallel, attention-free, effortless, unconscious, and fast processing. The CV proposal of Segalowitz and Segalowitz (Reference Segalowitz and Segalowitz1993) is concerned with fast processing (or more precisely: with the variability of processing duration), that is, with the time aspect of automaticity. In this paper we have shown that the operationalization of automaticity along the time dimension is not without problems. Perhaps we should regard processing speed as only an epiphenomenon of automaticity and focus on other dimensions of automaticity in further research. Skilled, automatic reception, and production of language might be better seen as essentially effortless and (almost entirely) ballistic, rather than fast. It may be worthwhile to include such notions as levels of activation, cue competition, lateral inhibition, priming, and interaction activation in a theory of automatization and skill acquisition. The growing literature on processing of lexical information in monolinguals and bilinguals invariantly shows that activation of one unit (e.g., lexical item) is affected by the activation of neighboring units within languages in monolinguals (e.g., Balota, Yap, & Cortese, Reference Balota, Yap, Cortese, Traxler and Gernsbacher2006) and between languages in bilinguals (e.g., Costa, Reference Costa, Kroll and de2005; Schwartz & Kroll, Reference Schwartz, Kroll, Traxler and Gernsbacher2006), depending on a range of task and materials factors. Although the suppression of competing nontarget items has been shown to take its toll from skilled language users in terms of response time in experimental RT tasks, skilled language processing can be regarded as taking place rather effortlessly, requiring little or no attention, and almost unstoppable in most language-use situations outside the laboratory. Although the CV has potential for describing and assessing the course of (second) language development, it might be wise to assess the aformentioned characteristic features of automatic processing before drawing conclusions about automatization proper.
ACKNOWLEDGMENTS
This research was supported by Grant 575–36-001 from The Netherlands Organisation for Scientific Research (NWO). We thank Michael Harrington (University of Queensland) for his feedback on an earlier version of this text.