





Nomenclature
- AFRL
-
US Air Force Research Laboratory
- ASAK
-
ATJ and SAK
- ASTM
-
The American Society for Testing and Materials
- ATJ
-
alcohol-to-jet
- CO
-
carbon monoxide
-
CO
 $_{2}$
-
carbon dioxide
- EPA
-
US Environmental Protection Agency
- FSN
-
filter smoke number
- FT
-
Fischer-Tropsch
- FTIR
-
Fourier transform infrared spectroscopy
- GHG
-
greenhouse gases
- HEFA
-
hydroprocessed esters and fatty acids
- HRR
-
heat release rate
- HSAK
-
HEFA and SAK
- IATA
-
The International Air Transport Association
- ICAO
-
The International Civil Aviation Organization
- J50A50
-
Jet A 50% and ATJ 50%
- J50H50
-
Jet A 50% and HEFA 50%
-
N
$_{2}$
O
-
nitrous oxides
- NDIR
-
non dispersive infrared
- NHOC
-
net heat of combustion
- NO
-
nitric oxide
-
NO
$_{2}$
-
nitrogen dioxide
-
NO
$_{X}$
-
nitrogen oxides
- PAH
-
poly aromatic hydrocarbons
- PM
-
particulate matter
- PPM
-
parts per million
- QSPR
-
quantitative structure–property relationships
- RSE
-
relative standard error
- SAF
-
sustainable aviation fuel
- SAK
-
synthetic aromatic kerosene
- SE
-
standard error
- SMD
-
Sauter mean diameter
- SPK
-
synthetic paraffinic kerosene
- VOC
-
voltaile organic compounds


1.0 Introduction
In 2023, the aviation sector emitted 882 million tons of carbon dioxide, accounting for approximately 2.05% of total anthropogenic carbon emissions [1]. In addition to carbon dioxide, non-
 ${\rm{C}}{{\rm{O}}_2}$
effects, such as contrail formation and cirrus cloud enhancement, substantially contribute to the sector’s radiative forcing and overall warming impact [Reference Lee, Fahey, Skowron, Allen, Burkhardt, Chen, Doherty, Freeman, Forster, Fuglestvedt, Gettelman, De León, Lim, Lund, Millar, Owen, Penner, Pitari, Prather, Sausen and Wilcox2, Reference Undavalli and Khandelwal3]. If current trends persist, aviation emissions are projected to increase by a factor of four to six by 2050, underscoring the urgent need for decarbonisation strategies to achieve net-zero emissions by that year [4]. Due to the sector’s requirement for high energy density and operational constraints, liquid hydrocarbon fuels are expected to remain essential in the near term. Consequently, sustainable aviation fuels (SAFs) are regarded as the most viable approach for reducing aviation carbon emissions in the coming years. Historical data and future projections, as shown in Fig. 1, indicate that jet fuel demand is expected to reach 412 metric tons in 2025 and 830 metric tons by 2050 [5]. The development of SAFs represents a pivotal strategy for mitigating the environmental impacts of aviation, which remains a major source of greenhouse gas emissions and atmospheric pollutants. Achieving net-zero emission targets will require a substantial increase in SAF production, from 8 metric tons to 451 metric tons [Reference Undavalli, Olatunde, Boylu, Wei, Haeker, Hamilton and Khandelwal6]. Currently, production stands at only one metric ton, according to The International Air Transport Association (IATA) [7], which is significantly below the initial forecast of eight metric tons.
Jet fuel and SAF production capacities worldwide and projections until 2050 [Reference Undavalli and Khandelwal3].

Although advancements have been made in SAF production pathways and certification frameworks, several research gaps remain that must be addressed to facilitate further development, optimisation and implementation [Reference Undavalli, Olatunde, Boylu, Wei, Haeker, Hamilton and Khandelwal6]. A key gap involves understanding the behaviour of hydrocarbon mixtures within SAFs, especially their physicochemical properties and the effects of blending with conventional fuels on emissions. While quantitative structure–property relationships (QSPR) models are available for pure substances, their applicability to mixtures is limited, leading to uncertainty in predicting the behaviour and emissions profiles of blended aviation fuels [Reference Zhao, Huang, Zhong, Li, Song, Lu, Lu, Tang and Liang8]. This limitation highlights the need for comprehensive studies of chemical species interactions in fuel blends, particularly given that certification currently restricts blending ratios to ensure fuel performance and compatibility [Reference Faulhaber, Borland, Boehm and Heyne9, Reference Anuar, Undavalli, Khandelwal and Blakey10]. Existing studies [Reference Undavalli, Olatunde, Boylu, Wei, Haeker, Hamilton and Khandelwal6, Reference Anuar, Undavalli, Khandelwal and Blakey10–Reference Undavalli, Hamilton, Ubogu, Ahmed and Khandelwal13] demonstrate that SAFs typically yield lower soot and particulate matter (PM) emissions than conventional fuels. However, the impact of specific chemical properties, such as reduced aromatic content and varying combustion conditions, warrants further investigation [Reference Khandelwal, Wijesinghe, Sriraman, Runchal, Gupta, Kushari, De and Aggarwal14, Reference Smith, Harper, Durand, Crayford, Johnson, Coe and Williams15]. In particular, the mechanisms by which different fuel compositions affect unburned hydrocarbons (UHC) and other unregulated pollutants require additional clarification [Reference Song, Li and Liu16].
-
The current American Society for Testing and Materials (ASTM) D7566 standards authorise seven SAF production pathways as drop-in fuels for Jet A, with specified maximum blending limits relative to Jet A [17]. Among the approved pathways, hydroprocessed esters and fatty acids-synthetic paraffinic kerosene (HEFA-SPK) currently dominates large-scale commercial production, capturing approximately 87.5% of the market share, with Fischer-Tropsch SPK (FT-SPK) and alcohol-to-jet SPK (ATJ-SPK) following in prominence [18]. The present study selects the widely commercially available HEFA-SPK and the emerging pathway ATJ-SPK due to their practical relevance and growth potential. Both HEFA and ATJ are approved for blending with Jet A up to 50% by volume, a limitation largely attributed to engine compatibility and performance considerations [Reference Undavalli, Olatunde, Boylu, Wei, Haeker, Hamilton and Khandelwal6, 17]. Recent studies by Markl et al. [Reference Märkl, Voigt, Sauer, Dischl, Kaufmann, Harlaß, Hahn, Roiger, Weiß-Rehm, Burkhardt, Schumann, Marsing, Scheibe, Dörnbrack, Renard, Gauthier, Swann, Madden, Luff, Sallinen, Schripp and Le Clercq19] suggest that replacing conventional jet fuel with 100% SAF can reduce nonvolatile particle emissions by approximately 52% and decrease annual mean contrail radiative forcing by about 44%, resulting in combined
$C{O_2}$
and non-
$C{O_2}$
climate benefits.


Further 100% SAF [Reference Xu, Wang, Chang, Pan, Shen, Zhong, Xu, Liu, Li and Chen20, Reference Jarin, Champion-Réaud, Sallinen and Steenwinkel21] demonstrations were conducted, showing potential reductions in emissions compared to conventional fuels, but a comprehensive understanding of fuels remains a research gap. A compelling need exists to increase the permissible blending ratio of SAF under ASTM D7566 and ultimately enable 100% SAF utilisation to achieve aviation decarbonisation. This necessitates a systematic understanding of SAF’s effects on propulsion systems, with particular attention to SAF chemistry, including hydrogen and aromatic content. In general, the hydrogen content in SAF can range from 13.6% to 14.6% by mass [Reference Edwards22]. Aromatic content may vary from 8% to 25% by volume according to ASTM D7566 [17], whereas most commercial jet fuels have a nominal aromatic content of 15% to 20% by volume [Reference Edwards22]. It is equally critical to evaluate the interactions of these fuels with elastomeric seals and fuel system components, as well as their combustion and emission characteristics. In particular, seal compatibility [Reference Hamilton and Khandelwal23–Reference Hamilton, Khandelwal and Elliott25] and fuel thermal stability [Reference Wei and Khandelwal26, Reference Wei and Khandelwal27] are being rigorously investigated to enable the realisation of 100% SAF deployment. To move towards 100% SAF, one option is to design a blend of SPKs with synthetic aromatic kerosenes (SAKs) to meet the requirements of good combustion, high energy density, feedstock diversity, scalability and aromatic content needs. Essentially, these blends must meet ASTM D1655 [28] and D7566 [17] specifications while delivering large lifecycle greenhouse gas reductions. However, the current literature provides only limited evidence that SAK products can achieve regulatory approval for 100% SAF fleet operation, thereby highlighting a clear priority for future research.
This study addresses critical knowledge gaps hindering the adoption of 100% SAF by systematically evaluating the feasibility of neat SAF formulations, with a particular focus on combustion and emission characteristics. A structured blending strategy was employed using SAK and synthetic paraffinic kerosene (SPK), including HEFA and ATJ, to achieve controlled aromatic contents of 0, 4, 8, 17 and 25 vol%. These tailored blends are benchmarked against conventional aviation fuels (Jet A, JP 5 and JP 8) as well as currently certified 50% blend limits (Jet A/HEFA and Jet A/ATJ). The study further addresses a critical lack of understanding regarding chemical–kinetic interactions and compositional trade-offs in neat SPK-SAK fuel matrices. A comprehensive cross-validation framework is implemented across both HEFA-SPK and ATJ-SPK fuel families, including SAK blend formulations. Emphasis is placed on quantifying regulated emissions, including NOx, CO, UHC and PM. Additionally, in response to the limited literature on unregulated emissions from SAF, this work investigates volatile organic compound (VOC) emissions and their dependence on fuel composition. The study ultimately provides a cross-comparative analysis linking the molecular structure of fuels to combustion behaviour and emission characteristics, offering insights into the design of fully synthetic, drop-in aviation fuels.
2.0 Methodology
2.1 Fuel properties and composition
The research proposed focuses on the fuels listed in Table 1, including conventional jet fuels (CJFs), Jet A, JP 8 and JP 5, which serve as baseline reference points. The blends are designed to investigate the impact of aromatic content during testing. Our group’s earlier research on aromatic content has clearly demonstrated that not all SPKs and aromatic blends behave uniformly with respect to chemical reactivity, material compatibility or thermal characteristics. These findings highlight the need for a more nuanced understanding of aromatic composition that goes beyond total volumetric percentages. ASTM D1655 [28] and ASTM D7566 [17] specify a range of 8% to 25% aromatic content by volume for jet fuels, mainly to ensure adequate swelling of elastomer seals. As listed in Table 1, selected fuel samples include conventional jet fuels (Jet A, JP 8 and JP 5) and alternative SAFs such as HEFA and ATJ fuels. Each SAF is blended with synthetic aromatic kerosene to achieve total aromatic contents of 0%, 4%, 8%, 17% and 25% by volume. According to the ASTM D1655 [28] and ASTM D7566 [17], the maximum allowable aromatic content is 25% while the minimum allowable is 8% as per ASTM D7566 [17]. In general, the nominal aromatic content found in Jet A is 17% around the world and also matches the aromatic content of the Jet A used in this study. To further explore and evaluate the possibility of low-aromatic-content fuels, 4% is chosen.
Fuel blends physio-chemical properties and blend composition

Table 1 Long description
The table presents the physio-chemical properties and blend composition of various fuel blends. It includes 16 rows and 11 columns. The columns are labeled as follows: Fuel blend 1, Fuel blend 2, Fuel blend 1, Fuel blend 2, Fuel blend name, Density at 15 degrees C, Net heat of combustion, H content, Normal paraffins, Isoparaffins, Cycloparaffins, Aromatics, and Ref. Each row lists the specific properties and composition of different fuel blends. For example, Row 1: Fuel blend 1 is Jet A with 100.00 percent, Fuel blend 2 is not applicable, Fuel blend name is JetA, Density at 15 degrees C is 797.56 kilograms per cubic meter, Net heat of combustion is 43.318 megajoules per kilogram, H content is 14.01 percent, Normal paraffins is 19.98 percent, Isoparaffins is 29.69 percent, Cycloparaffins is 31.79 percent, Aromatics is 18.53 percent, and Ref is 22, 29.
 ${{\rm{\;}}^{{\rm{a}})}}$
Polynomial fit based on the blended fuels’ properties.
As shown in Fig. 2, samples labelled HEFA and ATJ, representative of SPK, exhibit a water-white appearance, signalling a near-total absence of sulphur and aromatic compounds that are the principal precursors to soot and PM in gas turbine combustors. By contrast, semi-synthetic and conventional jet fuels such as Jet A and JP-8 maintain high clarity while occupying a transitional chemistry zone between traditional jet fuels and fully synthetic alternatives. The high-aromatic end of the spectrum, the SAK, shows a distinct straw-to-yellow tint, a colouration historically associated with heavier poly aromatic hydrocarbons (PAHs). JP 5 exhibits a slightly more pronounced yellowish hue due to its higher aromatic content and additional additives.
Tested fuel samples.

The relationship between density, energy content and hydrogen mass fraction is illustrated in Fig. 3. An inverse correlation is evident between density and net heat of combustion. Bio-derived paraffinic fuels, including ATJ and HEFA, are grouped within the low-density range (approximately
 $760$
to
 $770{\rm{\;kg}}/{{\rm{m}}^3}$
). These fuels also occupy the high net heat of combustion region (approximately
 $43.4$
to
 $43.8{\rm{\;MJ}}/{\rm{kg}}$
). Their elevated hydrogen content (approximately
 $15.0$
to
 $15.5{\rm{wt}}.{\% }$
) contributes to superior gravimetric energy density. In contrast, fully aromatic SAK is a significant outlier, exhibiting the highest density (approximately
 $865{\rm{\;kg}}/{{\rm{m}}^3}$
) and the lowest hydrogen content (approximately
 $10.5{\rm{\;wt}}.{\% }$
). Blends in the ATJ-SAK (ASAK) and HEFA-SAK (HSAK) series display a linear progression in properties as the aromatic fraction (SAK) increases. This blending approach is essential for achieving ‘drop-in’ compatibility, enabling the fuel to satisfy minimum density requirements (
 $ \geq 775{\rm{\;kg}}/{{\rm{m}}^3}$
per ASTM D1655) while maintaining combustion characteristics near the minimum net heat of combustion requirement (
 $42.8{\rm{\;MJ}}/{\rm{kg}}$
per ASTM D1655) [28].
Correlation of tested fuels density, hydrogen content and net heat of combustion with respective to ASTM D1655 standard limits for aviation turbine fuels.

The underlying chemical drivers for the above-discussed physical properties are quantified in Fig. 4. Bio-derived paraffinic fuel ATJ is exclusively composed of isoparaffins, while HEFA contains small proportions of normal paraffins (n-paraffins) along with mostly isoparaffins. The near-zero concentration of cycloparaffins and aromatics in these fuels explains their low density and high hydrogen-to-carbon (
 $H/C$
) ratio. Conventional Jet A, JP 5 and JP 8 contain a significant fraction of cycloparaffins (
 $ \approx 22 - 48{\rm{\;wt}}.{\% }$
) and aromatics (
 $ \approx 13 - 21{\rm{wt}}.{\% }$
). To emulate these properties, the ASAK and HSAK blends utilise controlled additions of SAK to a paraffinic base, thereby modulating aromatic content to target practical property envelopes and hardware compatibility while enabling low-emission, high-variability exhaust characteristics. This viewpoint acknowledges that the total aromatic content does not conclusively determine performance. This is because the molecular composition and distribution of cycloparaffins, n-paraffins and PAHs can result in varied spray patterns, ignition properties and combustion behaviours across different engines and under diverse operating conditions. Therefore, thorough cross-engine validation is crucial for confirming the full effectiveness and safety of 100% SAF in actual flight operations.
Composition of fuel blends on weight percent.

2.2 Blend preparations
The fuel blends examined in this research, along with their corresponding abbreviations, are presented in Table 1. The nomenclature employed follows a volumetric percentage system; thus, J50A50 and J50H50 denote 50/50 vol percent blends of Jet A with ATJ and HEFA, respectively. Blends incorporating HEFA and ATJ, along with SAK, are identified by the base fuel and a numerical suffix that denotes the SAK volume percentage. For example, HSAK4 indicates HEFA blended with 4% SAK, whereas ASAK8 denotes ATJ blended with 8% SAK, with the remaining volume comprising the base fuel, summing to 100%.
Blends were formulated to achieve specific aromatic concentrations of 0, 4, 8, 17 and 25 vol percent using HEFA and ATJ as the SAF components. Additionally, J50H50 and J50A50 were prepared in accordance with ASTM D7566 specifications. Rigorous protocols were implemented to prevent cross-contamination during blending. All mixing containers and fuel tanks were thoroughly rinsed with n-heptane as a cleaning solvent and subsequently air-dried before the introduction of each new fuel batch.
2.3 Experimental rig
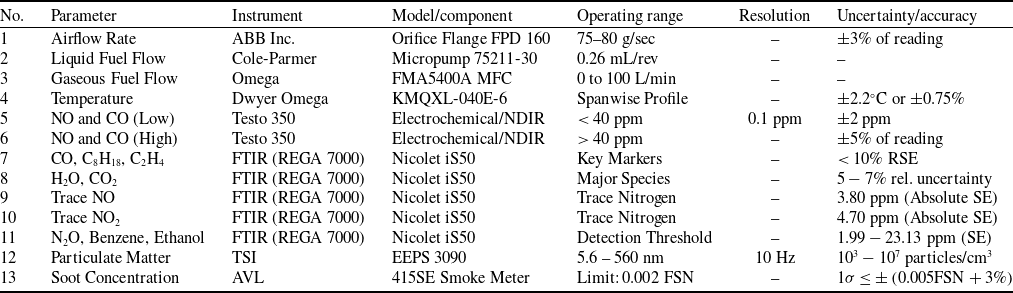
As shown in the schematic figure Fig. 5, combustion testing is carried out using a modular gas turbine combustor test bed-based single can of a can-annular combustor based on the Rolls-Royce Spey low-bypass turbofan engine to allow for detailed emissions measurements. The combustor rig comprises multiple subsystems for air and fuel supply and for emission characterisation. A summary of equipment is listed in Table 2 along with their uncertainties. The system accommodates fuel intake from multiple fuel sources. A liquid fuel tank (green) supplies liquid fuels such as jet fuel or biofuels. Additionally, an air cylinder (blue) provides the necessary atomising air for fuel atomisation, and a pressure of
 $2 - 5 \times {10^6}$
pascals is supplied during stable operation. Air requirements are met by the on-site high-pressure air compressor, which can deliver up to 200 PSI. Under atmospheric conditions, the compressor delivers an airflow rate of 75–80 g/sec. The orifice flange assembly FPD 160 by ABB Inc., certified to ISO 5167:2003, is integrated into the test rig to measure the airflow rate through the combustor in conjunction with a differential pressure transducer, allowing the airflow rate to be measured with an uncertainty of
 $ \pm 3{\% }$
of the reading. To achieve precise control of liquid fuel flow, the rig is equipped with a Cole-Parmer micropump 75211-30 paired with L20561 gear pump drives, which deliver 0.26 mL per revolution. For controlling gaseous fuel flow, we are using an Omega mass flow controller FMA5400A with a capacity of 0 to 100 liters per minute. All combustor control and data logging are performed using National Lab cDAQ systems and LabVIEW programmes.
Schematic of modular combustor test rig setup.

Summary of measurement instrumentation, operating ranges and associated uncertainties

The combustor is also equipped with a set of Dwyer Omega KMQXL-040E-6 thermocouples, spanwise on either side, to record temperature profiles with standard errors of
 $ \pm {2.2^ \circ }{\rm{C}}$
or
 $ \pm 0.75{\% }$
. The exhaust gases are collected from the stack and passed through a heated filter and sample lines maintained at 180oC for gaseous emissions and hydrocarbon species measurements. Gaseous emissions are measured through two independent systems to ensure high-fidelity data across a broad range of chemical species. One of them is the Testo 350 Emissions Analyzer, equipped with electrochemical and non-dispersive infrared (NDIR) sensors for high-accuracy detection and compliant with the US Environmental Protection Agency Method 19. Low-concentration NO and CO gas sensors provide a resolution of 0.1 ppm, maintaining an accuracy of
 $ \pm $
2 ppm at concentrations below 40 ppm and
 $ \pm $
5 ppm at higher concentrations.
The other instrument includes a Thermo Scientific Nicolet iS50 Fourier transform infrared (FTIR) spectrometer equipped with a REGA 7000 gas analyser module, which identifies hydrocarbons and nitrogen-based compounds at high resolution. The FTIR system facilitated the deconvolution of the intricate exhaust matrix into discrete species, which were subsequently quantified through spectral comparison with a calibrated library. Examination of the experimental data revealed that the system maintained a relative standard error (RSE) below 10% for key combustion markers and specific hydrocarbons, including carbon monoxide, iso-octane and ethene. Major constituents, such as water and carbon dioxide, exhibited relative uncertainties of 5–7%, consistent with the dynamic range of high-concentration exhaust components. The accuracy of the FTIR system for trace species was identified by absolute standard errors (SE) rather than percentages, as concentrations often approached the instrument’s lower quantification limits. For species reporting a mean concentration of zero, specifically nitrous oxide, benzene and ethanol, the absolute SE ranged from 1.99 to 23.13 ppm, defining the functional noise floor and detection threshold of the REGA 7000 module. Conversely, trace nitrogen species, specifically NO and
 ${\rm{N}}{{\rm{O}}_2}$
, exhibited consistent absolute errors of 3.80 ppm and 4.70 ppm, respectively. Although the Testo 350 yielded dependable total concentration values suitable for regulatory compliance, the FTIR system further refined this information by precisely delineating the non-methane hydrocarbon fraction, particularly alkenes and alkanes.
PM emissions are assessed using a TSI Engine Exhaust Particle Sizer 3090 (EEPS), which characterises size-resolved particle number and distribution with high temporal resolution (up to 10 Hz). The instrument covers a size range from approximately 5.6 to 560 nanometers, with number concentrations ranging from
 ${10^3}$
to
 ${10^7}$
particles/
 ${\rm{c}}{{\rm{m}}^3}$
. At the same time, soot or black carbon is quantified using an AVL415SE smoke meter that provides smoke opacity as filter smoke number (FSN) and also soot concentration, which conforms to ISO 10054, with a detection limit of 0.002 FSN or 0.02
 ${\rm{mg}}/{{\rm{m}}^3}$
, making it suitable for modern engines that emit very low soot concentrations and high repeatability of
 $(1\sigma \le \pm \left( {0.005FSN + 3{\% }} \right)$
.
3.0 Results and discussions
3.1 Combustor performance
The experimental evaluation of the fuels, as shown in Table 1, was conducted at five different heat release rates (HRRs) conditions: 41.5, 43.81, 46.11, 48.42 and 50.72 kJ/sec. Testing under these conditions demonstrates a complex interdependence among fuel physical properties, combustor temperature profiles, local oxygen concentration and operational stability. The above HRR conditions were constrained by the maximum air supply capabilities of the current lab-scale facility. However, previous cross-platform validation studies [Reference Zheng, Singh, Cronly, Ubogu, Ahmed, Ling, Zhang and Khandelwal30] conducted by our group confirm that the absolute magnitude of emissions changes with scale and operating conditions, the relative behavioural trends among the fuels remain remarkably consistent. Based on this established literature, we hypothesise that the relative behavioural trends of fuels observed in this study will hold when extrapolated to real-world engine conditions, even if the absolute operating parameters differ. Across all successful tests, a strong positive linear correlation exists between the energy input and the combustor temperature, with values rising from approximately
 ${\rm{\;\;}}{700^ \circ }{\rm{C}}$
to peak values exceeding
 ${\rm{\;\;}}{900^ \circ }{\rm{C}}$
with respect to increasing HRRs, as shown in Fig. 6. For the fuels that maintained a stable operating reaction rate and temperature at any given HRR condition, the temperature remained within a narrow range of about 3%. This indicates that once a stable flame is established, the thermodynamic behaviour of SAF blends closely mimics that of conventional Jet A. For example, at an HRR of 50.72 kJ/sec, the J50H50 blend exhibited the highest temperature (
 ${\rm{\;}}{912.2^ \circ }{\rm{C}}$
) corresponding to a net heat of combustion of 43.384 MJ/kg and a hydrogen mass fraction of 14.555%. In comparison, Jet A recorded a temperature of
 ${\rm{\;\;}}{904.03^ \circ }{\rm{C}}$
, with a net heat of combustion of 43.318 MJ/kg and a hydrogen mass fraction of 14.01%. Furthermore, Fig. 6 highlights the consistency of combustor temperatures among the fuel blends at specific HRRs, effectively validating the calculated fuel flow rates and confirming stable operation based on individual fuel properties.
Combustor temperatures of tested fuels at various heat release rates.

Oxygen content in the exhaust stack at various heat release rates of tested fuels.

The local oxygen concentration is also a key factor in this assessment, acting as an inverse measure of both combustion intensity and efficiency. Specifically, as the HRR increased from 41.5 to 50.72 kJ/sec, the oxygen concentration in the successful fuel group decreased, dropping from about 18.5% to 17.0% as shown in Fig. 7. This consistent decrease indicates a higher stoichiometric requirement during the more intense combustion stages, where a higher amount of oxygen is needed to oxidise the increased fuel mass flow. Also, for the same HRR, fuels with higher hydrogen content, like ATJ (15.1% H) and ASAK4 (15.192% H), consistently show reduced oxygen concentrations compared to Jet A (14.01% H). This suggests that the increased reactivity is associated with a higher hydrogen-to-carbon ratio, which promotes more complete consumption of the available oxygen. The increased hydrogen content raises the adiabatic flame temperature and enhances the rate of chemical reactions. This allows for more complete energy release within the combustor’s residence time, resulting in higher localised temperatures seen in these fuel blends Fig. 6.
However, the study identified significant operational limitations for certain fuel groups, mainly due to the interaction between their density and hydrogen content. The combustion rig failed to maintain stable operation for HEFA, HSAK4 and HSAK8 across the entire HRR spectrum. These fuels are characterised by relatively low densities (765.47 to 785.03
 ${\rm{kg}}/{{\rm{m}}^3}$
) and high hydrogen contents (up to 15.4%). While a high hydrogen content usually enhances flame propagation, the lower density of these fuels suggests a change in the primary zone mixing. When the density is lower, the fuel spray has less momentum, which could prevent it from reaching the main combustion zone. This prevents the formation of a stable, self-sustaining flame kernel, causing the flame to go out even when substantial heat is released. This indicates that the spray didn’t mix well with the air, leaving areas with unburned oxygen and preventing a stable release of heat.
The SAK fuel exhibited a unique failure pattern, specifically at the lower HRR settings of 41.5 and 43.81 kJ/sec. This instability is rooted in SAK’s outlier physical profile: it possesses the highest density (863.71
 ${\rm{kg}}/{m^3}$
) and the lowest hydrogen content (10.2%) of the test group. High density is a primary factor in poor atomisation quality. It resists the aerodynamic forces intended to break the liquid fuel into a fine spray, leading to significantly larger droplet sizes. According to the Sauter mean diameter (SMD) principle, high densities leading to larger droplets have a lower surface-area-to-volume ratio, which severely delays evaporation [Reference Wijesinghe and Khandelwal31, Reference Zheng, Wei, Zhang and Khandelwal32]. At low HRR conditions, where internal temperatures are at their minimum, the combination of slow evaporation and low hydrogen content, which inherently reduces the lean blowout limit, results in a fuel-starved primary zone. The oxygen levels at these failed points for SAK remained high (above 19%), confirming that the fuel was not vapourising quickly enough to consume the available oxygen to sustain a flame. As the HRR increased to 46.11 kJ/sec, the increased thermal energy finally provided enough energy to overcome these atomisation hurdles, allowing SAK to stabilise and its oxygen consumption to align with the rest of the group.
3.2 Regulated emissions
3.2.1 Carbon emissions
The gaseous emission profiles of carbon monoxide (
 $CO$
) and carbon dioxide (
 $C{O_2}$
) provide a comprehensive understanding of the combustion process efficiency relative to the fuel’s carbon content (
 $100 - H{\% }$
). As listed in Table 1, the highly refined SPKs, namely ATJ and HEFA, exhibit carbon mass fractions of 84.6% and 84.9%, respectively. The hydrocarbon group type analysis confirms that these low-carbon fuels are almost entirely devoid of aromatic compounds, with ATJ comprising 99.8% isoparaffins and HEFA comprising 89.4% isoparaffins. Jet A, JP 8 and JP 5 are characterised by an intermediate carbon content, ranging from 85.67% to 86.46%. These established fuels are composed of n-paraffins, isoparaffins and substantial cycloparaffin components, with JP-5 exhibiting a peak cycloparaffin content of 47.37%. Moreover, the aromatic components of these fuels vary, accounting for 13.56%–20.36% of the total composition. At the upper extreme of carbon density lies SAK, a pure blending component with a carbon mass fraction of 89.8% composed entirely of 100% aromatic ring structures.
Carbon monoxide emissions relative to baseline fuel Jet A at various heat release rates of tested fuels.

Figure 8. Long description
A bar graph comparing carbon monoxide emissions relative to Jet A at various heat release rates for different fuels. The horizontal axis represents the heat release rate in kilojoules per second (kJ/sec) with values at 41.5, 43.81, 46.11, 48.42, and 50.72. The vertical axis represents the carbon monoxide emissions relative to Jet A, ranging from 0.6 to 1.6. The graph includes multiple bars for each heat release rate, each representing a different fuel type. The fuels are color-coded as follows: JP8 (blue), JP5 (orange), ATJ (yellow), SAK (purple), J50A50 (green), J50H50 (light blue), ASA K4 (light green), ASA K8 (pink), ASA K17 (dark red), ASA K25 (dark blue), HSA K17 (brown), and HSA K25 (black). Notable trends include higher carbon monoxide emissions for SAK at heat release rates of 46.11 and 48.42 kJ/sec, and generally lower emissions for most other fuels across the heat release rates.
Carbon dioxide emissions relative to baseline fuel Jet A at various heat release rates of tested fuels.

The
 $CO$
and
 $C{O_2}$
, as shown in Figs 8 and 9, respectively, are quantified relative to a Jet A baseline across HRRs of 41.5 to 50.72 kJ/sec. The
 $CO$
emission data, presented in Fig. 8, shows a limited chemical reaction rate during the intermediate stages of hydrocarbon oxidation. The isoparaffin dominant ATJ and its highly paraffinic low-level blend, ASAK4, consistently exhibit the highest oxidation efficiency, yielding the lowest relative
 $CO$
across the testing matrix. At the peak HRR condition of 50.72 kJ/sec, the ASAK4 blend registered a
 $CO$
fraction of 0.704 relative to Jet A, which can be attributed to the molecular simplicity of the aliphatic chains [Reference Sarathy, Javed, Karsenty, Heufer, Wang, Park, Elwardany, Farooq, Westbrook, Pitz, Oehlschlaeger, Dayma, Curran and Dagaut33]. The high hydrogen content of these fuels guarantees the rapid generation of an abundant pool of hydroxyl (
 $O{H^ \bullet }$
) radicals. Because the primary conversion of intermediate carbon monoxide to fully oxidised carbon dioxide is governed by the highly specific elementary reaction
 $CO + O{H^ \bullet } \to C{O_2} + {H^ \bullet }$
[Reference Lachkov and Chin34], the radical-rich environment provided by the low-carbon paraffinic fuels could ensure that this reaction proceeds to completion rapidly, effectively depleting
 $CO$
concentrations before the exhaust gases exit the combustor.
In contrast, SAK (100% aromatic) from Fig. 8 demonstrates that maximising the carbon mass fraction induces extreme kinetic bottlenecking. SAK produced
 $CO$
about 1.232 times that of Jet A at 50.72 kJ/sec, which increased sharply to 1.462 at an HRR of 46.11 kJ/sec. The elevated carbon fraction of 89.8% in SAK is locked within benzene rings. The activation energy required to shatter these aromatic structures is substantially higher than the energy required to cleave paraffinic bonds. Consequently, these carbon-dense molecules resist early thermal degradation and tend to form highly stable radical intermediates, thereby limiting reaction rates. Furthermore, the severe hydrogen deficiency of SAK (10.2%) heavily restricts the formation of the necessary
 $O{H^ \bullet }$
radical pool. The combination of delayed carbon breakdown and radical deficiency effectively freezes the oxidation chain at the
 $CO$
intermediate stage, leading to massive accumulation of carbon monoxide. This kinetic penalty is clearly observable as a linear scaling function within the ‘drop-in’ blending series; increasing the SAK fraction in the ATJ base from 4% (ASAK4) to 25% (ASAK25) linearly drives the relative
 $CO$
from 0.704 up to 0.880 at peak HRR, reflecting the systematic stoichiometric substitution of highly reactive isoparaffins with kinetically resistant aromatics.
The
 $C{O_2}$
emission trends detailed in Fig. 9 represent the terminal stage of the hydrocarbon oxidation sequence and are a function of both the total carbon content and the efficiency of the aforementioned
 $CO$
to
 $C{O_2}$
conversion. Assuming complete combustion,
 $C{O_2}$
production for a constant HRR is theoretically proportional to the fuel’s carbon mass fraction and inversely proportional to its gravimetric energy density. Among the evaluated fuels, the HEFA-based approved drop-in blend J50H50 consistently yielded the highest relative
 $C{O_2}$
emissions across the varying HRRs. It was the only blend to frequently exceed the Jet A baseline, reaching a peak relative value of approximately 1.02. Conversely, the low-carbon, hydrogen-rich SAFs, such as ATJ and the ASAK blends, generally operate below the Jet A baseline. Because these fuels possess superior net heats of combustion (e.g. 43.8 MJ/kg for ATJ), a lower total fuel mass flow rate and therefore less absolute elemental carbon is required to achieve the target 50.72 kJ/sec heat release, fundamentally lowering the absolute
 $C{O_2}$
output.
However, a direct comparison between Figs 8 and 9 exposes a profound inverse kinetic relationship driven by incomplete combustion in the carbon-dense fuels. For SAK at an HRR of 46.11 kJ/sec, the massive
 $CO$
spike to 1.462 corresponds to a notably suppressed
 $C{O_2}$
value of 0.902. Despite introducing the highest concentration of elemental carbon into the combustor, SAK fails to produce a proportionately high
 $C{O_2}$
signature because its carbon is kinetically trapped as carbon monoxide. The
 $C{O_2}$
production is artificially stunted not by a lack of initial carbon mass, but by the kinetic inability to oxidise the intermediate
 $CO$
species due to the aromatics inducing
 $O{H^ \bullet }$
radical deficiency. The variation in HRRs further exacerbates this inverse relationship. Across the entire fuel test matrix, a systematic reduction in HRR from 50.72 down to 41.5 kJ/sec corresponds to a uniform rise in relative
 $CO$
emissions and a general decline or flattening of relative
 $C{O_2}$
emissions. As the fuel mass flow is throttled back, flame temperatures within the combustor drop. The critical
 $CO + O{H^ \bullet } \to C{O_2} + {H^ \bullet }$
conversion is a highly exothermic process that is exponentially dependent on localised temperatures. At lower HRRs, thermal decay exponentially slows the rate of the final oxidation step, leading to an unavoidable accumulation of intermediate
 $CO$
before exhaust. Ultimately, the chemical kinetic limitations imposed by extreme carbon mass fractions and low operating temperatures manifest as poor combustion stability. Pure SAK experienced a complete flame blowout at the 43.81 and 41.5 kJ/sec conditions. The reduction in thermal energy, combined with the extreme activation energy required for aromatic ring dissociation and severe radical depletion, led to the final oxidation step quenching entirely, rendering the flame impossible to sustain. Paradoxically, combustion failures were also universally observed for the pure HEFA pathway and the low-aromatic HSAK4 and HSAK8 blends across all tested HRR conditions. While these highly isoparaffinic fuels exhibit optimal chemical kinetics for minimising
 $CO$
emissions, their physical properties likely result in suboptimal spray atomisation in this specific combustor. Coupled with a lack of dense aromatic structures required to anchor the flame front spatially, this resulted in complete combustion failure. This stark dichotomy demonstrates that while minimising the
 $100 - H{\% }$
carbon mass fraction perfectly optimises gaseous emission kinetics, the strategic reintroduction of carbon via aromatic compounds, as seen in the stable ASAK25 blend, is a strict thermophysical requirement to ensure flame stability across the full operating envelope of the gas turbine.
For HRR 50.72 kJ/sec, the order of CO and CO
 $_{2}$
formation in fuels is as follows:
CO:
 $\,ASAK4 \lt ATJ \lt J50H50 \lt ASAK8 \lt J50A50 \lt JP8 \lt ASAK17 \lt HSAK25 \lt JP5 \lt HSAK17 \lt ASAK25 \lt SAK$
.
CO
 $_{2}$
:
 $HSAK17 \lt J50A50 \lt SA{K^{\rm{*}}} \lt HSAK25 \lt JP8 \lt ASAK25 \lt ASAK4 \lt ASAK17 \lt ASAK8 \lt ATJ \lt J50H50 \lt JP5$
.
*The low CO
 $_{2}$
value for SAK is an artifact of severe incomplete combustion (kinetic trapping as CO), rather than true oxidation efficiency.
When evaluating empirical data solely by absolute emission mitigation, the pure isoparaffinic ATJ pathway and its ultra-low-aromatic derivative, ASAK4 (96% ATJ, 4% SAK), are unequivocally the highest-performing fuels in the evaluated fuel matrix. These low-carbon, hydrogen-rich blends consistently achieved the highest oxidation efficiency, yielding the lowest relative
 $CO$
across the testing matrix. For ASAK4, the highest HRR is 0.704 relative to JetA. Simultaneously, their higher net heat of combustion ensures that
 $C{O_2}$
remains systematically suppressed below the conventional Jet A baseline. Their maximised generation of the hydroxyl (
 $O{H^ \bullet }$
) radical provides rapid, complete carbon conversion without the intermediate incomplete oxidation of the carbon-dense aromatic fuels. However, when fuel performance is considered through the necessary lens of gas turbine operability, specifically the thermophysical requirements for stable flame anchoring and ASTM D7566 density compliance, the ASAK25 blend (75% ATJ, 25% SAK) appears as the optimal holistic candidate in terms of carbon emissions. While ASAK25 incurs a quantifiable, linear penalty in
 $CO$
production relative to pure ATJ due to its 25% aromatic fraction, it successfully restricts both
 $CO$
and
 $C{O_2}$
emissions to levels that are highly competitive with, or superior to, the conventional JP-5 and JP-8 benchmarks. Most critically, ASAK25 achieves this emission profile while demonstrating absolute combustion stability across the entire HRR range, successfully avoiding lean blowout, which was observed in both the highly paraffinic HEFA, HSAK4, HSAK8 and the SAK.
3.2.2 NOx emissions
The measured nitrogen-based emission characteristics across the evaluated HRR reveal a profound thermochemical trade-off inherent in highly refined sustainable aviation fuels. In terms of nitrogenous species, only
 $N{O_x}$
(
 $NO$
and
 $N{O_2}$
) emissions were observed, while no
 ${N_2}O$
emissions were detected across any of the tested fuel pathways. As indicated in the experimental methodology, the uncertainty bounds for NOx measurements are 3.80–4.70 PPM on a wet basis
 $N{O_x}$
emissions before correction for 16% oxygen, as shown in Fig. 10. Across all evaluated fuels, the data demonstrate a strict positive correlation between increasing HRR, combustor temperature and
 $N{O_x}$
formation. As shown in Fig. 10, as the combustor HRR increases from 41.5 to 50.72 kJ/sec, the baseline Jet A combustor temperature increases from 726.1
 ${{\rm{\;}}^ \circ }$
C to 904.0
 ${{\rm{\;}}^ \circ }$
C as shown in Fig. 6, yielding a corresponding increase in
 $N{O_x}$
from 13.90 to 16.73 PPM. This overarching formation trend is fundamentally governed by the extended Zeldovich mechanism, which dictates that the formation of thermal
 $N{O_x}$
is exponentially dependent on peak localised flame temperatures and residence time [Reference Miller and Bowman35–Reference Xing, An, Zhang and Kurose37]. As thermal energy within the primary zone scales with HRR, the high activation energy required to dissociate diatomic atmospheric nitrogen (
 ${N_2}$
) is more readily exceeded, accelerating the oxidation process.
Dry NOx emissions corrected for 16%
 ${O_2}$
at various heat release rates of tested fuels.

Figure 10. Long description
A scatter plot representing the relationship between heat release rate and dry NOx emissions for various tested fuels. The horizontal axis represents the heat release rate in kilojoules per second (kJ/sec), ranging from 40 to 52. The vertical axis represents the dry NOx emissions in parts per million (PPM), ranging from 10 to 30. The plot includes data points for several fuels, each represented by different symbols and colors. The fuels include JetA, SAK, HSAK25, ASAK25, JP8, JP5, ATJ, J50A50, J50H50, HSAK17, ASAK4, ASAK8, and ASAK17. The data points show varying levels of NOx emissions at different heat release rates, with some clustering and patterns visible among the different fuels.
However, while the combustor temperatures remain remarkably similar across the fuel test matrix for a given HRR with Jet A and ATJ both registering approximately 904
 ${{\rm{\;}}^ \circ }$
C and 905
 ${{\rm{\;}}^ \circ }$
C at peak power, respectively, their specific
 $N{O_x}$
outputs diverge drastically. The pure synthetic pathway, ATJ, consistently produces the highest
 $N{O_x}$
emissions across the entire testing matrix, peaking at 23.44 PPM. This stark discrepancy between global temperature and pollutant production is driven by the fuel’s highly isoparaffinic chemical composition [Reference Xing, An, Zhang and Kurose37]. ATJ possesses the highest hydrogen content and a superior net heat of combustion. The rapid oxidation kinetics and high energy density of these simple branched alkanes create a localised, microscopic ‘hot spot’ within the primary combustion zone that may closely approach the fuel’s theoretical adiabatic flame temperature. It is within these intense, localised thermal regions that thermal
 $N{O_x}$
generation is profoundly accelerated, penalising the otherwise clean-burning synthetic fuel.
Conversely, the conventional jet fuels (Jet A, JP 8, JP 5) and the 100% aromatic SAK cluster at the lowest end of the emission spectrum, restricting
 $N{O_x}$
production to a range of approximately 14 to 16.7 PPM at the highest HRR. The empirical data from the fuel blends conclusively demonstrate that this suppression is chemically driven; with the introduction of aromatics, both the localised flame temperatures and the rapid oxidation kinetics of the base fuel are fundamentally altered. The substantial activation energy required to break the aromatic bonds acts as a chemical heat sink within the primary zone. By absorbing local thermal energy to drive endothermic aromatic ring dissociation, these cyclic structures effectively decelerate the overall oxidation rates and limit the peak localised temperatures. This thermal suppression limits the Zeldovich mechanism that requires intense heat to dissociate nitrogen.
Consequently, within the ASAK formulation series,
 $N{O_x}$
emissions scale inversely with the introduced aromatic fraction. The ultra-low aromatic ASAK4 blend closely mirrors the high emissions of the pure ATJ base (23.36 PPM at 50.72 kJ/sec). However, as the SAK is progressively added, the high-density ‘drop-in’ ASAK25 blend successfully suppresses the
 $N{O_x}$
signature down to 19.33 PPM at peak power. This mechanism underscores a fundamental compromise in modern aviation fuel design. While pure isoparaffinic SAFs eliminate intermediate carbon monoxide through rapid localised heat release, the strategic blending of aromatic molecules remains a critical requirement to temper localised flame temperatures, control oxidation rates and keep thermal
 $N{O_x}$
emissions within viable regulatory limits.
3.2.3 Total hydrocarbons (THC) emissions
Total unburned hydrocarbons (THC) measure macroscopic combustion inefficiency and represent fuel fragments escaping complete oxidation. For all fuels evaluated, data show an inverse, non-linear correlation between HRR and THC emissions, as shown in Fig. 11. As the HRR increases from 41.5 kJ/sec to 50.72 kJ/sec, the amounts of THC decrease. This change is due to physical and chemical improvements that occur at higher combustor temperatures. In general, the increased thermal energy speeds up heat transfer to the injected fuel, causing rapid fuel evaporation and reducing the droplet residence time. Higher temperatures also speed up hydrocarbon breakdown, so more vaporised fuel achieves complete oxidation within the combustor’s set residence time.
Total unburned hydrocarbons relative to baseline fuel Jet A at various heat release rates of tested fuels.

When controlling for HRR, the THC profiles show a clear difference in combustion completeness, driven entirely by fuel chemistry. Highly refined SPKs have much better oxidation efficiency than conventional jet fuels. The pure ATJ and ASAK4 produce the lowest THC across the entire operating range, with respective relative THC fractions of 0.251 and 0.237 at the highest HRR. Hydrocarbon group analysis shows why: ATJ has 99.8% isoparaffins. When injected, these branched aliphatic structures have low C–C bond dissociation energies, so they break down quickly by thermal cracking and beta-scission. This makes the original hydrocarbon mass turn almost instantly into a reactive pool of small alkyl radicals. As a result, the fuel bypasses slow initial breakdown steps, leaving little unburned in the exhaust.
Conversely, adding aromatics significantly constrains chemical reaction rates and increases unburned hydrocarbon levels. Aromatic benzene rings require much higher activation energy for breaking the aromatic rings than straight-chain or branched paraffins. As 100% aromatic SAK blends into pure ATJ, combustion completeness drops in direct proportion. At peak power, increasing SAK moves the relative THC from 0.237 for ASAK4 to 0.384 for ASAK25. Since more thermal energy is needed to break these aromatic structures, their degraded derivatives are more likely to survive the primary zone. The extreme of this kinetic resistance is observed in the pure SAK pathway, where slow ring breakdown starves the flame of reactive intermediates, leading to blowout at low thermal conditions.
JP 8 and JP 5 emit much higher THC emissions than synthetic blends, showing an important link between how these fuels act physically and chemically. Although JP 8’s aromatic content is lower (13.56%) than that of high blend synthetics like ASAK25, it still produces the highest relative THC among stable fuels. This is due to the highly mixed composition of conventional fuels, which includes n-paraffins, complex cycloparaffins and heavier aromatics. By contrast, highly synthesised SPKs have a narrow boiling point range, while conventional fuels have a broad, multicomponent boiling range. The heavier components in conventional fuels vaporise slowly, allowing high-boiling-point droplets to linger and potentially escape the primary combustion zone or persist into the quenching zone, leading to higher baseline THC emissions. Also, J50A50 and J50H50 show consistently similar behaviour across the HRR below the baseline Jet fuel.
This indicates fuels rich in branched isoparaffins maximise primary zone efficiency. They bypass kinetic bottlenecks and almost eliminate unburned hydrocarbon fragments across all conditions. In contrast, the structural resilience of aromatics works as a kinetic sink. This penalty is directly proportional to the volumetric aromatic fraction. Thermal energy in the combustor governs combustion completeness, making low power conditions critical for controlling unburned hydrocarbon emissions. Ultra-low aromatic blends are offering the highest overall oxidation efficiency.
3.2.4 Particulate matter and soot emissions
The PM emissions for the evaluated fuel test matrix were compared at the peak HRR of 50.72 kJ/sec. As demonstrated in Fig. 6, the combustor temperature profiles for all fuels exhibit minimal variation at this specific HRR compared to other HRRs, establishing it as the ideal baseline for an isolated comparison of emission characteristics and thus minimising any interference from thermal fluctuations. PM emissions are rigorously quantified through normalised particle number-size distributions in Fig. 12, aggregated number and mass concentrations in Fig. 13 and the optically derived FSN in Fig. 14. As illustrated in Fig. 12, the particulate profiles for all tested fuels exhibit a log-normal distribution heavily dominated by ultrafine ‘nucleation mode’ particles, with particle diameters generally peaking between 10 nm and 20 nm. The conventional Jet A baseline produces the most aggressive nucleation profile, yielding the highest peak amplitude and an overwhelming total particle number concentration of 3,179,670/scm
 ${^3}$
in Fig. 13. In stark contrast, highly refined isoparaffinic synthetic fuels drastically suppress this nucleation spike. The pure ATJ pathway and the ultra-low aromatic ASAK4 blend restrict their total number concentrations to 975,187/scm
 ${^3}$
and 932,266/scm
 ${^3}$
, respectively. This reduction demonstrates the superior, clean-burning nature of highly branched aliphatic chains, which crack efficiently into light gaseous intermediates rather than condensing into solid particulate nuclei.
Particulate matter normalised particle number–size distribution of various tested fuels at HRR 50.72 kJ/sec.

Figure 12. Long description
Panel A: A line graph showing the particle matter emissions for various tested fuels at a heat release rate of 50.72 kJ per second. The horizontal axis represents the particle diameter in nanometers, ranging from 10 to 600 nanometers. The vertical axis represents the normalized particle number size distribution in units of D N per D log D p, ranging from 0 to 7 times 10 to the power of 6. Multiple lines represent different fuels, each with distinct colors and line styles. The lines show various trends, with some peaking at different particle diameters and others showing more gradual changes.
Particulate matter number–mass concentrations of various tested fuels relative to fuel aromatic content at HRR 50.72 kJ/sec.

Figure 13. Long description
Panel A: A bar graph comparing particulate matter number-mass concentrations of various tested fuels relative to fuel aromatic content. The horizontal axis represents different fuel types, including Jet A, JP 8, JP 5, ATJ, SAK, J50A50, J50H50, HSAK17, HSAK25, ASAK4, ASAK8, ASAK17, and ASAK25. The vertical axis on the left represents PM number concentration in units of number per cubic centimeter, ranging from 0 to 3.5 times 10 to the power of 6. The vertical axis on the right represents PM mass concentration in milligrams per cubic centimeter, ranging from 0 to 160. Each bar represents a different fuel type, with colors indicating the aromatic content percentage, ranging from blue (low aromatic content) to red (high aromatic content). The PM mass concentration is also plotted as a line graph with circular markers. Notable trends include higher PM number concentrations for Jet A and SAK fuels, and lower concentrations for JP 5 and ASAK4 fuels. The PM mass concentration line graph shows varying levels across different fuel types, with peaks at Jet A and SAK fuels.
Filter smoke number for various tested fuels relative to their aromatic content at HRR 50.72 kJ/sec.

While particle number concentrations highlight primary nucleation phenomena, the overall PM mass concentration in Fig. 13 and FSN Fig. 14 serve as direct, corroborating metrics of total exhaust soot concentration. Both exhibit a profound, direct correlation with fuel aromaticity and cycloparaffinic content. Pure ATJ, consisting of 99.8% isoparaffins and a negligible 0.2% aromatics, produces the lowest soot signature of the suite, yielding a PM mass of just 12.07 mg/sm
 ${^3}$
and a baseline FSN near 0.2. Conversely, the introduction of aromatics results in a substantial increase in soot formation. Aromatic ring structures do not easily undergo beta-scission into smaller alkyl radicals [Reference Sarathy, Javed, Karsenty, Heufer, Wang, Park, Elwardany, Farooq, Westbrook, Pitz, Oehlschlaeger, Dayma, Curran and Dagaut33]; instead, they act as direct chemical precursors to PAHs [Reference Richter and Howard38]. Through hydrogen abstraction and sequential carbon addition, PAHs rapidly grow and condense into solid primary soot particles [Reference Calcote and Manos39]. This process fundamentally links the aromaticity of the fuel to the total soot mass concentration in the exhaust. Consequently, the 100% aromatic SAK produces an extreme PM mass of 154.92 mg/sm
 ${^3}$
and a corresponding FSN spike exceeding 2.6. This PAH-driven mechanism also explains the inherently elevated PM mass in complex conventional distillates like JP-5, which yields 98.41 mg/sm
 ${^3}$
due to its dense matrix of 20.36% aromatics and 47.37% cycloparaffins.
SAK data expose a critical physical divergence between particle number and particle mass, highlighting the mechanisms of soot agglomeration. Despite generating extreme mass and FSN measurements, SAK exhibits one of the lowest total particle number concentrations at just 749,841/scm
 ${^3}$
. Observing Fig. 12, the SAK size distribution is uniquely broad, flattened and shifted towards larger aerodynamic diameters compared to the sharp, narrow nucleation spike of Jet A. In highly aromatic, carbon-dense primary combustion zones, an overabundance of PAH precursors leads to massive initial soot inception [Reference Calcote and Manos39]. Because the spatial concentration of these primary particles is exceptionally high, their collision frequency increases exponentially. This causes the tiny nucleation particles to rapidly coagulate and agglomerate into much larger, heavier fractal aggregates before exiting the combustor. Consequently, the exhaust contains fewer individual particles, but those surviving aggregates are significantly denser, yielding the extreme mass and optical FSN readings.
Fuel blends confirm that PM mass and FSN scale predictably with aromatic addition while demonstrating the immediate mitigation benefits of SAF dilution. The J50A50 and J50H50 semi-synthetic formulations are a 50/50 volumetric blend of Jet A with ATJ and HEFA, respectively, effectively halving the complex aromatic matrix of the conventional baseline. This stoichiometric dilution proportionately disrupts early-stage soot inception, slashing the massive Jet A nucleation spike to 1,551,173/scm
 ${^3}$
for J50A50, significantly reducing the mass to 30.70 mg/sm
 ${^3}$
and dropping the FSN to approximately 0.45 and 0.3, respectively. Within the ‘drop-in’ formulation series, increasing the SAK fraction from 4% to 25% drives the PM mass from 17.98 mg/sm
 ${^3}$
(ASAK4) to 57.01 mg/sm
 ${^3}$
(ASAK25), with FSN scaling proportionally from roughly 0.25 to 0.85. A parallel PAH-driven trend is observed in the HEFA-based blends, where increasing aromaticity from 18.77% in HSAK17 to 27.33% in HSAK25 drives the total PM mass from 41.46 mg/sm
 ${^3}$
to 48.67 mg/sm
 ${^3}$
and pushes smoke numbers upward. Ultimately, while blends like ASAK25 and HSAK25 incur a measurable soot penalty relative to pure SAFs to satisfy hardware density requirements, they successfully bypass the extreme agglomeration regime of pure SAK and maintain ultrafine particle counts well below the conventional Jet A baseline.
3.3 Unregulated emissions
Unregulated VOCs, light hydrocarbons and oxygenated species in the exhaust, provide a detailed chemical profile of the localised thermal breakdown processes occurring within the combustor. The heatmap analysis is shown in Fig. 15. The emission species concentrations reveal that the molecular architecture and hydrocarbon group makeup of the initial fuel largely dictate the attributes of these unregulated emissions. Conventional jet fuels, which are complex and varied mixtures of normal paraffins, cycloparaffins and aromatics, show notably elevated concentrations of certain light alkanes and alkenes. Jet A, JP 8 and JP 5 are the main sources of n-pentane, with concentrations of 675.9, 681.0 and 626.1 PPM, respectively. They also contribute to the production of ethene, which is present at levels between 113.8 and 127.0 PPM. The prevalence of these particular species implies that the thermal cracking and beta-scission of straight-chain normal paraffins, along with the aromatic ring breakdown reactions of cycloparaffins, inherently promote the generation of these stable, low molecular-weight fragments before complete oxidation.
Unregulated emissions heat map of various tested fuels at HRR 50.72 kJ/sec.

Figure 15. Long description
A matrix showing species concentration levels of various emission species across different fuel types. The matrix has 13 rows representing different emission species and 13 columns representing different fuel types. Each cell in the matrix contains a numerical value indicating the species concentration in parts per million (PPM). The emission species include Methane, Ethane, Ethene, Acetylene, Propane, Propene, 1,3-Butadiene, IsoButylene, n-Pentane, Iso-octane, Formaldehyde, and Acetaldehyde. The fuel types include JetA, JP8, JP5, ATJ, SAK, J50A50, J50H50, HSAK17, HSAK25, ASAK4, ASAK8, ASAK17, and ASAK25. Notable trends include high concentrations of n-Pentane across most fuel types and varying concentrations of other species depending on the fuel type.
Conversely, HEFA and ATJ SPKs significantly modify the composition of exhaust gases, exhibiting chemical characteristics directly attributable to their unique production pathways. ATJ fuel, which is 99.8% isoparaffins, substantially diminishes the n-pentane and ethene emissions typically associated with conventional fuels, lowering them to 110.9 PPM and 43.88 PPM, respectively. However, the unique, highly branched structure of ATJ establishes a distinct emission fingerprint. ATJ is the only base fuel in the evaluated fuel matrix to produce significant concentrations of iso-octane (204.4 PPM), propane (59.96 PPM) and elevated levels of isobutylene (49.66 PPM). These specific intermediates are direct products of the thermal cracking of the highly branched isoparaffinic oligomers that constitute the ATJ matrix. The structural dependence is further confirmed by comparing the ATJ-based ASAK blends with the HEFA-based HSAK blends. While both base fuels are highly isoparaffinic, the HEFA-based formulations completely lack the iso-octane and propane signatures observed in the ATJ blends, reflecting differences in branch density and carbon-number distributions between the two sustainable synthesis pathways.
The introduction of aromatic carbon via the 100% aromatic SAK results in a strong dilution effect on these specific unregulated aliphatic emissions. Pure SAK yields some of the lowest concentrations across the measured spectrum, including minimal propene (2.34 PPM), isobutylene (1.22 PPM) and formaldehyde (7.62 PPM). Because SAK consists entirely of aromatic rings, its thermal degradation pathways favour the formation of heavier polycyclic precursors rather than the light, unburned aliphatic fragments and oxygenates captured in this speciation matrix. Consequently, within the ‘drop-in’ blending series, SAK acts as a chemical diluent for light VOCs. As the SAK fraction increases from 4% in ASAK4 to 25% in ASAK25, there is a systematic, near-linear reduction in the distinct ATJ blends; iso-octane falls from 199.4 PPM to 146.6 PPM, and propane drops from 57.06 PPM to 33.01 PPM.
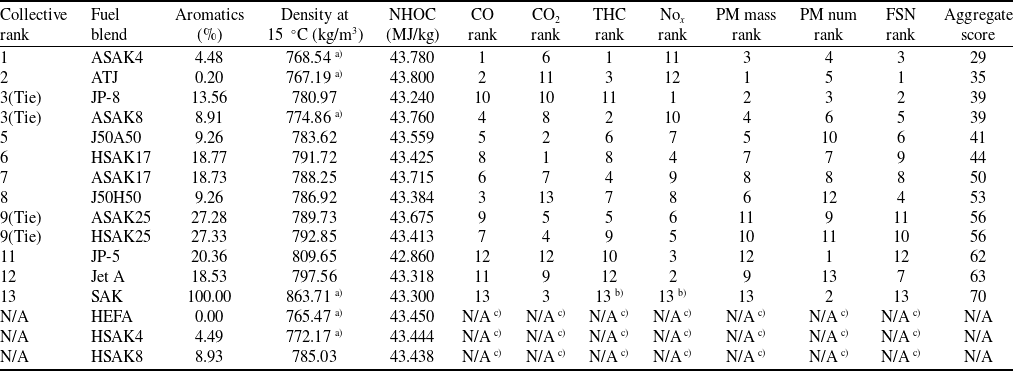
Comprehensive fuel evaluation and emission rankings at HRR (50.72 kJ/sec)

Table 3 Long description
The table presents a comprehensive evaluation of different fuel blends, focusing on their aromatic content, density at 15 degrees Celsius, net heat of combustion, and various emission rankings. It includes 13 rows and 14 columns, with column headers such as Collective rank, Fuel blend, Aromatics (percent), Density at 15 degrees Celsius (kg/m^3), NHOC (MJ/kg), CO rank, CO2 rank, THC rank, No_x rank, PM mass rank, PM num rank, FSN rank, and Aggregate score. Each row lists a specific fuel blend and its corresponding values across these categories. Notable trends include the ranking of ASAK4 as the top fuel blend with the lowest aggregate score of 29, and SAK with the highest aggregate score of 70. The table also notes specific failures to meet ASTM D1655 physical density limits and instances of complete combustion failure.
 ${{\rm{\;}}^{{\rm{a}})}}$
Denotes failure to meet ASTM D1655 physical density limits (775 – 840 kg/m
 $^{3}$
), with an exception to ASAK8, which only deviates by 0.14 kg/m
 $^{3}$
. All fuels meet the minimum net heat of combustion (NHOC) requirement;
 ${{\rm{\;}}^{{\rm{b}})}}$
Pure SAK experienced complete flame blowout at lower HRRs of 43.81 and 41.5 kJ/sec and is assigned the lowest rank for NO
 ${{\rm{\;}}_x}$
and THC to penalise instability;
 ${{\rm{\;}}^{{\rm{c}})}}$
Combustion failed completely for these blends; therefore, stable emission data could not be collected.
Finally, the generation of oxygenated species, particularly formaldehyde and acetaldehyde, shows complex dependencies on base-fuel chemistry. The pure ATJ pathway, in contrast to the conventional Jet A baseline, demonstrates a substantial reduction in acetaldehyde emissions (9.43 PPM versus 28.03 PPM). Nevertheless, it also results in a slight increase in formaldehyde emissions (38.59 PPM compared to 31.06 PPM). This suggests that the rapid oxidation of the prevalent methyl branches in ATJ isoparaffins facilitates a highly reactive mechanism for formaldehyde generation during the intermediate combustion phases. In contrast, when aromatics are added back into the ASAK and HSAK blending series, the concentrations of these aldehydes are effectively stabilised or reduced. This further supports the notion that blended SAFs can either match or surpass the unregulated emission profiles of conventional jet fuels.
4.0 Conclusion
An experimental investigation of the SAK and SPK blends against conventional aviation fuels (Jet A, JP 5 and JP 8), along with the currently certified 50% blend limits (Jet A/HEFA and Jet A/ATJ), has been conducted on the Rolls-Royce Spey combustor. Based on the evaluation of the combustion performance and emission profiles of the tested fuel matrix, the following conclusions are reached:
-
1. Isoparaffins enable maximum oxidation: Fuels with highly branched aliphatic chains, particularly those produced through the ATJ process, avoid the chemical kinetic reaction limitations of initial hydrocarbon breakdown. Their low carbon–carbon bond dissociation energies allow for rapid thermal cracking and the production of many hydroxyl (
$O{H^ \bullet }$
) radicals. This substantially reduces THC and reduces carbon monoxide (
$CO$
) emissions across all stable operating conditions. This demonstrates the better oxidation of low-carbon SAFs. -
2. The
$N{O_x}$
vs combustion efficiency trade-off: The rapid oxidation and high energy density of pure isoparaffins create localised thermal ‘hot spots’ in the main combustion zone, which can reach temperatures close to adiabatic flame temperatures. This drives the extended Zeldovich mechanism, leading ATJ to produce the highest thermal
$N{O_x}$
emissions among the evaluated fuel matrices. The addition of aromatic compounds (as seen in the ASAK and HSAK blends) acts as a chemical heat sink. The endothermic breakdown of aromatics effectively moderates localised temperatures, suppressing
$N{O_x}$
formation. -
3. Aromaticity controls PM and agglomeration: PM mass and the FSN scale linearly with the aromatic fraction of the fuel. Stable aromatic compounds serve as direct precursors to PAHs, thereby promoting the formation of solid primary soot. Although conventional Jet A fuel generates a substantial increase in ultrafine nucleation, pure 100% aromatic SAK induces an extreme agglomeration regime, resulting in low particle numbers but large, dense fractal aggregates. Diluting conventional fuels with 50% SAF (J50A50, J50H50) proportionately disrupts this initial soot inception phase, thus reducing the hazardous nucleation profile by more than half.
-
4. Fundamental fuel chemistry relates to the formation of unregulated emissions: The speciation of exhaust VOCs is strictly governed by the parent fuel’s hydrocarbon molecular structure, unlike conventional jet fuels, which mainly produce n-pentane and ethene. The ATJ pathway, known for its highly branched structure, uniquely emits iso-octane, propane and isobutylene as intermediate products. Adding aromatic SAK to these synthetic bases acts as a chemical diluent, helping reduce the formation of light, unregulated aliphatic fragments.
-
5. Mid-to-high aromatic blends represent the optimised ‘drop-in’ compromise: Low or zero aromatic content leads to poor combustion stability, as demonstrated by the complete flame blowout in pure HEFA at all HRRs and pure SAK at lower HRRs. While ultra-low-aromatic blends (e.g. pure ATJ and ASAK4) offer the highest absolute carbon oxidation efficiency and top the individual emission rankings as listed in Table 3, they fundamentally fail to meet the minimum physical density requirements of ASTM D1655. However, they showed sustained combustion and outperformed the baseline Jet A. Consequently, the results indicate that the mid-to-high blend formulations, specifically ASAK8, J50A50, HSAK17, ASAK17, J50H50, ASAK25 and HSAK25, in that respective order, exhibit progressively improved performance relative to the baseline Jet A fuel. Collectively, these functional blends surpass conventional commercial Jet A in overall emission characteristics, demonstrating superior aggregate emission profiles. These formulations successfully bridge the critical gap by providing the necessary aromatic carbon density to satisfy ASTM standards and maintain stable combustion. Furthermore, the targeted addition of aromatics to the neat SPKs is found to help meet density requirements, improve flame stability and suppress thermal
$N{O_x}$
through endothermic bond-breaking and heat-sink effects, all while restricting
$CO$
, UHC and particulate emissions to levels highly competitive with conventional baselines.


Acknowledgement
The authors acknowledge and thank the U.S. Air Force Research Laboratory (AFRL) and Virent for providing the fuel samples used in this research. These samples were supplied solely for testing purposes at no cost, and the supplier was not involved in the study design, data collection, analysis or the decision to publish. The authors declare no additional conflicts of interest. The findings and data presented are intended exclusively for research purposes and do not represent an endorsement of any commercial product. The results are specific to the experimental conditions described and are not intended as official industry benchmarks or standardised performance metrics.




 O2



 Open access

