Much has been written about the effects of anger on politics.Footnote 1 While anger's elevated role in politics is clear, capturing the experience of anger is less so. In political science anger is most commonly assessed via self-reports in which participants are asked if a candidate has ever made them angry. Using participants who respond in the affirmative as a marker for anger, researchers can then examine the correlation between the effects of the recalled state and the political behavior of interest. However, if the goal is to tease out the causal impact of anger on political outcomes, self-reported anger is not sufficient because it does not ensure the manipulation precedes the effect (Ekman Reference Ekman1992).
Increasingly political science research incorporates emotional induction techniques (Brader Reference Brader2006; Lodge and Taber Reference Lodge and Taber2005; Small and Lerner Reference Small and Lerner2008), such as asking participants to write about a campaign event that made them angry (Valentino et al. Reference Valentino, Brader, Groenendyk, Gregorowicz and Hutchings2011). Induction techniques have the advantage of directly invoking the emotional state of interest, allowing researchers to then explore the effects of emotional arousal on political attitudes. Use of induction techniques has a rich history in social psychology, where the study of emotion requires a high-impact experimental manipulation. While many studies show anger is central to understanding political behavior (Keltner et al. Reference Keltner, Ellsworth and Edwards1993; Moons and Mackie Reference Moons and Mackie2007), each uses a different method of induction, which is problematic considering that anger is the most difficult emotion to induce in the laboratory (Philippot Reference Philippot1993). Which method is the best for inducing anger?
As studies of emotion in politics proliferate, we argue that there is a practical need for reliable, standardized methods to induce emotion to facilitate comparison across studies. Essential to the effective study of emotional arousal is getting the experimental manipulation right—strongly inducing a primary affective state while minimizing co-occurring emotions to the extent possible. Furthermore, the aforementioned induction methods generally leverage the laboratory environment to employ a high-impact induction of emotion (Harmon-Jones et al. Reference Harmon-Jones, Amodio, Zinner, Coan and Allen2007). However, conducting an experiment in a laboratory setting is not realistic for all scholars. Alternatively, using a survey experiment featuring induction techniques is one way to balance concerns of accurate emotional recall and self-assessment with practical issues such as lack of lab space (Dovidio et al. Reference Dovidio, Kawakami, Beach, Brown and Gaertner2001; Engebretson et al. Reference Engebretson, Sitora, Niaura, Edwards and Brown1999).
With a mind towards standardizing induction techniques we present two studies. In Study 1, we compare three vetted induction methods from psychology. In Study 2, we focus mainly on scenario inductions, which we find to be the most promising and flexible of the techniques examined.
STUDY 1
We set up a between-subject design in which participants are exposed to one of three anger-induction techniques that are commonly used in psychology and amenable to adaption in political science research designs. We selected these inductions so that each draws on different sensory modalities, specifically audio (self-statements), visual (images), and memory (scenario). These modality differences are important to understanding variation in emotional states (Marin and Bhattacharya Reference Marin and Bhattacharya2009). We first focus on non-political inductions to establish a baseline of effect; in Study 2, we examine political inductions.
Inductions
-
1. Self-statements: The first induction condition asks participants to read aloud a series of 50 phrases in order of ascending anger intensity (Engebretson et al. Reference Engebretson, Sitora, Niaura, Edwards and Brown1999; Velten Reference Velten1968; Appendix B1).
-
2. Scenario: The second induction condition utilizes a common technique in which participants are asked to imagine themselves in a scenario which makes them angry (Bower et al. Reference Bower, Gilligan and Monteiro1981; Keltner et al. Reference Keltner, Ellsworth and Edwards1993; Lerner and Keltner Reference Lerner and Keltner2001; Valentino et al. Reference Valentino, Brader, Groenendyk, Gregorowicz and Hutchings2011). Participants are instructed to “imagine the following scenario,” in which a student wakes up late for an exam and has a parking spot stolen (Appendix B2).
-
3. Images: The third induction condition use images from the International Affective Picture System (Lang et al. Reference Lang, Bradley and Cuthbert1999), a database of static images which have been assigned a corresponding discrete emotional state (Mikels et al. Reference Mikels, Frederickson, Larkin, Lindberg, Maglio and Reuter-Lorenz2005). We selected five images with the highest mean anger response and lowest mean response on other emotions.
Procedures and Participants
We draw a student sample from the undergraduate population at Washington State University. Each treatment condition had about 85 respondents (N = 321, 55% male, age 22 ± 3.5 years). Forty percent identified as Democrats, and 30% each identified as Republicans and Independents. There were no significant differences between party identification and self-reported anger. Respondents were randomly assigned to one of the four treatments—either one of the three inductions or the control (no anger induction). Further details about procedures and subject recruitment are available in Appendix A.
Results
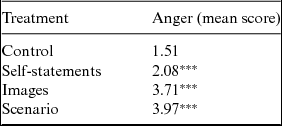
We first examine differences in self-reported anger. Table 1 reports the mean self-reported anger of the subjects for each of the treatments. Anger is measured on a scale ranging from 1 (not at all angry) to 5 (extremely angry). The control group, which did not receive any anger induction, reported very low levels of anger—only 1.51 (SE = 0.10). Using a means-comparison test (t-test) between the control group and the statement group, we found that each of the three inductions was effective in eliciting anger. The verbal self-statements induction had a significant though small effect on anger compared to the control with a mean anger level of 2.08 (SE = 0.10). Most striking, however, is the large difference in anger between the latter two inductions (scenario and images) and the control. Respondents who were shown the anger-inducing images self-reported anger levels of mean 3.71 (SE = 0.10), a marked difference from the control. Finally, the scenario induction—in which respondents were asked to imagine interactions with a rude driver—had the largest effect, resulting in a mean response of 3.97 (SE = 0.11).
Study 1 Mean Self-Assessed Anger, by Induction
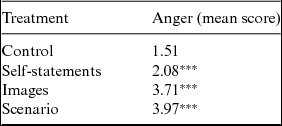
For the three induction treatments, * p < 0.1, ** p < 0.05, *** p < 0.001, using a t-test comparing anger in that treatment to anger for the control group.
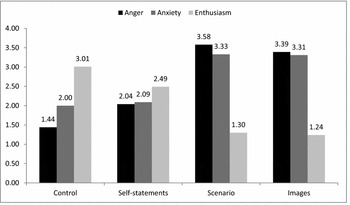
To further flesh out the validity of inductions’ effects on anger, we draw on additional emotional items to test the latent factor anger. Participants were asked on a five-point scale whether they felt angry, enthusiastic, upset, worried, uneasy, bitter, proud, hateful, and scared. We conduct a factor analysis on the nine items and find a three-factor model is the best fit.Footnote 2 By taking the average of the items we create equally-weighted measures for three scales of emotion: Anger (angry, hateful, bitter, upset), Anxiety (uneasy, worried, scared), and Enthusiasm (proud, enthusiastic). The Cronbach's alpha values for our three measures suggest high reliability including 0.92 (Anger), 0.81 (Anxiety), and 0.85 (Enthusiasm). Figure 1 shows the mean response for Anger, Anxiety, and Enthusiasm across each of the four conditions. Upon first glance it is clear that the inductions had a significant effect on the emotional scale of interest, Anger, and that these effects were of a larger magnitude for the scenario and images induction.
Effects of Inductions on Anger, Anxiety, Enthusiasm (Mean)

The average Anger response was lowest for the control group (M = 1.44, SE = 0.08) while progressively higher for participants in the self-statements (M = 2.04, SE = 0.11), images (M = 3.39, SE = 0.10), and scenario (M = 3.58, SE = 0.09) treatments. Means-comparison t-test confirm that each induction technique had a significant effect on mean levels of Anger compared to the control group and all other treatments (p < 0.05), with the exception of the means for images and scenario. Meanwhile, both the images (M = 3.31, SE = 0.10) and scenario (M = 3.33, SE = 1.06) treatments significantly increased respondents' average Anxiety levels compared to respondents in the control condition (M = 2.00, SE = 0.10). These same induction techniques were also associated with a significant decrease in mean Enthusiasm levels: participants who received no treatment (M = 3.01, SE = 0.12) were significantly more enthusiastic on average compared to participants who were exposed to the images (M = 1.24, σ = 0.06) and participants who were exposed to the scenario (M = 1.3, SE = 0.07). The self-statements treatment also had a significant negative impact on Enthusiasm (M = 2.49, SE = 0.14), but did not have a significant effect on Anxiety.
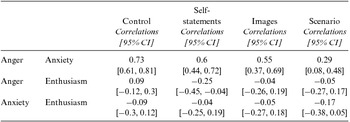
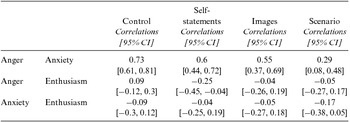
Anger was effectively elicited, but so too was anxiety. While co-occurrence is common in the induction of negative emotion (Lerner and Keltner Reference Lerner and Keltner2001), a robust test of anger requires it be primary and that the correlation between anxiety and anger levels be small. To gain further insight into how the inductions affected participants’ level of emotions, Table 2 looks at correlations between the three emotion factors. An ideal anger induction would affect anger orthogonally to the other emotions. Such a result is unrealistic (Watson and Clark Reference Watson and Clark1997), but we can compare the correlations between Anger, Anxiety, and Enthusiasm for each treatment, using a general rule of thumb that correlations closer to zero are preferable. In other words, we prefer increases (decreases) in Anxiety (Enthusiasm) to be less related to increases in Anger, even though we know that they change significantly across treatments. As the table shows, we find the correlation between Anger and Anxiety to be highest for participants in the control condition (0.73), lower for those in the self-statements (0.60) and pictures (0.55) conditions, and lowest for the scenario condition (0.29). Thus the advantages for the scenario treatment are the larger effect on average levels of Anger and the decreased correlation between Anger and Anxiety. However, such results should be interpreted with caution as due to the relatively small N of this study, the 95% confidence intervals overlap.
Study 1 Correlations between Emotion Factors with 95% Confidence Intervals
N = 312.
STUDY 2
Study 2 builds on the findings of Study 1 in two ways. First, we replicate the effects of the scenario induction with an adult sample. Second, we introduce two inductions that incorporate politics: one varies the scenario induction context to include politics, while the second, an angry campaign advertisement, extends our ability to generalize to traditional political science approaches.
Inductions
-
1. Non-political scenario: We revise the scenario from Study 1 slightly to appeal to an adult sample: the participant is asked to imagine waking up late for an important meeting (Appendix C1).
-
2. Political scenario: Participants are asked to imagine a situation in which they are discussing a preferred candidate for an upcoming election with a group of co-workers, and an inconsiderate co-worker interrupts and mocks their opinion (Appendix C2).
-
3. Campaign advertisement: For this induction we selected an ad previously shown to evoke anger, an actual 2010 negative ad in which a candidate for Alabama State Senate, Paul Bussman, is ruthlessly attacked for failing to pay child support (Appendix C3).
Procedures and Participants
We used Amazon Mechanical Turk (MTurk) to recruit 715 respondents from across the United States (172 per condition). Participants were randomly assigned to one of 4 conditions: control, political scenario, non-political scenario, and campaign advertisement. The sample included 59% men and 41% women, with 24% identifying as Republicans, 49% as Democrats, and 27% as Independents. The average age of participants was 36. Further details about procedures and subject recruitment are available in Appendix A.
Results
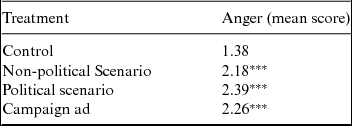
We again examine differences in self-reported anger. Table 3 reports the mean self-reported anger for each treatment. At first glance, the data suggest a powerful effect for each of the three inductions: the control group reported low levels of anger (M = 1.38, SE = 0.07), and means-comparison t-tests demonstrate significant differences between the control and each of the induction techniques (p < 0.05). The political scenario had the largest effect (M = 2.39, SE = 0.1) followed closely by the campaign ad (M = 2.26, SE = 0.09). The non-political scenario, which asked participants to imagine a scene in which they had a parking spot stolen from them, was the least effective of the three (M = 2.18, SE = 0.09), seemingly supporting the old adage that politics makes people mad. The results demonstrate that the inductions are indeed effectively eliciting anger in comparison to the control condition.
Study 2 Mean Self-Assessed Anger, by Induction
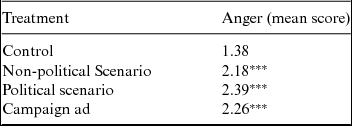
For the three induction treatments, * p < 0.1, ** p < 0.05, *** p < 0.001, using a t-test comparing anger in that treatment to anger for the control group.
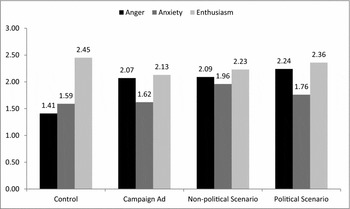
Again, to better understand the effects of the inductions on the latent factor Anger we conduct a factor analysis to fit 14 emotional items that were measured on a five-point scale ranging from extremely to not at all emotional including: angry, bitter, annoyed, upset, bitter, hateful, worried, uneasy, scared, fearful, anxious, enthusiastic, hopeful, and proud. We again create equally-weighted measures for three scales of emotion: Anger (angry, bitter, annoyed, upset, bitter, hateful), Anxiety (worried, uneasy, scared, fearful, anxious), and Enthusiasm (enthusiastic, hopeful, proud). The Cronbach's alpha values for our three measures suggest high reliability including 0.95 (Anger), 0.93 (Anxiety), and 0.83 (Enthusiasm). Figure 2 shows the mean response for the Anger, Anxiety, and Enthusiasm scales across each of the four conditions.
Effects of Inductions on Anger, Anxiety, Enthusiasm (Mean)
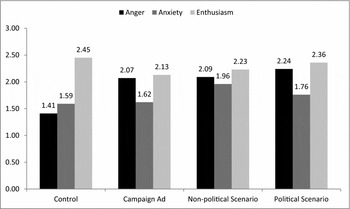
The average Anger response was lowest for the control group (M = 1.41, SE = 0.07) while each of the inductions solicited higher mean Anger responses: campaign ad (M = 2.07, SE = 0.08), non-political scenario (M = 2.09, SE = 0.09), and political scenario (M = 2.24, SE = 0.09) treatments. Means-comparison t-tests confirm that each induction technique had a significant effect on mean levels of Anger compared to the control group (p < 0.05). The political scenario also generated significantly more Anger (p < 0.10) than did the two other treatments. Meanwhile, the Anxiety response from the non-political scenario (M = 1.96, SE = 0.08) treatment was significantly different (p < 0.05) from the control (M = 1.75, SE = 0.07), as was the political scenario (M = 1.75, SE = 0.07) at p < 0.10, while the campaign ad (M = 1.62, SE = 0.06) was not significantly different. Note also that the political scenario had a significantly lower impact on Anxiety as compared to its non-political counterpart. Finally, both the campaign ad (M = 2.13, SE = 0.07) and non-political scenario (M = 2.23, SE = 0.08) represent a significant and negative departure from average Enthusiasm levels reported in the control condition (M = 2.45, SE = 0.07). These results suggest that the political scenario induction fares the best as it has significant and positive effects on mean Anger levels and an insignificant effect on mean Anxiety levels.
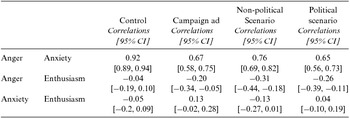
We again look at the correlations between the three factors for each treatment to get a better idea of how the inductions elicited concurrent affective states. Table 4 contains correlations between the three emotion factors. We find the correlation between Anger and Anxiety to be highest for participants in the control condition (0.92), lower for those in the campaign ad (0.67) and non-political scenario (0.76) conditions, and lowest for the political scenario condition (0.65). While each of the treatment conditions has a significantly lower Anger-Anxiety correlation than the control, the correlation is lowest for both of the political conditions: campaign ad and political scenario. This study echoes the findings of Study 1 inasmuch that the scenario inductions once again demonstrate significant effects. However, a scenario featuring political context performs better than the standard non-political scenario, both eliciting higher levels of Anger in respondents and lower levels of Anxiety.
Study 2 Correlations between Emotion Factors with 95% Confidence Intervals
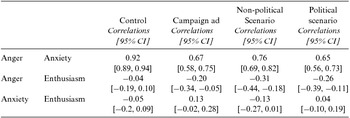
N = 714.
PRACTICAL IMPLICATIONS: WHICH INDUCTION IS BEST?
Of the tested inductions, the self-statements had the smallest effect. We suspect that one major drawback to this method was a low rate of subject compliance. Both scenarios and image inductions demonstrate great promise in that they effectively induce anger, are adaptable and easy to incorporate in an online survey format, and subject non-compliance is less likely. On the other hand, the largest effect on anger comes from the political scenario, which also has the smallest effect on anxiety and enthusiasm.
Beyond these effects, there are some practical considerations with using each of these techniques. The images, though they are common induction stimuli, are overt which can cause demand effects. Also, though well-suited to online survey interfaces, images take additional space and may pose logistical issues or increase expenses. Similar concerns present themselves when using videos. An advantage of the scenario induction is that it can be used across survey modes—online, telephone, mail—and is easy to implement.
For all intents and purposes, the levels of anger elicited by a context-independent scenario induction are similar to the anger elicited by a political, context-dependent scenario induction. In other words, we can make an argument for generalizing the effects of a non-political scenario to the effects of a political scenario on anger. Despite the similarities, the political scenario induction does have some advantages. First, the mean anger-levels reported are higher. Second, the correlation between participant anger and anxiety is smaller in the political scenario induction. Though these differences are not significant, for political scientists interested in political anger it makes sense to “stack the deck” by using a political induction.
Additionally, a political scenario offers advantages to the political researcher for a few reasons: besides practicality, the political scenario can be crafted absent of partisan cues and political targets to ensure it is equally applicable to partisans from either political party. In contrast, while the use of campaign ads is well-suited to many research questions, it can be difficult to find a campaign ad that elicits high levels of anger without known political figures or partisan cues. However, political scientists might find the effects of the campaign advertisement on anger here heartening. The campaign advertisement, though removed from a political environment, successfully elicited anger responses that, on average, were significantly higher than the anger responses reported by participants in the control.
These results are likely to be of interest to a range of researchers; however, additional work evaluating additional outcomes is needed to verify that for the political and non-political scenarios the anger induced is not behaviorally and attitudinally distinct. A constraint of this work is that we only test one example from each class of inductions, and attempts to replicate these results—with additional adult samples—are needed. Also, the difference in effect size between Study 1, which utilizes a student sample, and Study 2, which utilizes an adult sample, suggest researchers should be cautious in extrapolating the effects of anger induction used on students to the public. At the same time, researchers constrained to student populations can rest assured that induction techniques are highly effective.
Still, this study has accomplished what we set out to do—to expose political science researchers to common induction techniques used in psychology, make the case for inductions, and test methods that would be suitable to adoption in political science research designs. In addition to being cost efficient and easy to incorporate, these inductions make it possible to study angry voters’ responses outside a lab setting. The inductions presented herein are easily implemented and easy to adapt to political events and environments as appropriate. Furthermore, and perhaps most importantly, our results demonstrate that using inductions is a reliable approach for those interested in the causal implications of anger on political behavior and attitudes.
SUPPLEMENTARY MATERIALS
For supplementary material for this article, please visit Cambridge Journals Online http://dx.doi.org/10.1017/XPS.2015.5.