Introduction
Economic and environmental performances of pasture-based livestock enterprises are strongly associated with the efficiency of their grazing systems (Borges et al., Reference Borges, Oude Lansink, Marques Ribeiro and Lutke2014; Horn & Isselstein, Reference Horn and Isselstein2022). This efficiency is primarily determined by the internal level of pasture utilisation, generally more so than decisions on external inputs newly introduced into the system (Taube et al., Reference Taube, Gierus, Hermann, Loges and Schönbach2014; Hyland et al., Reference Hyland, Heanue, McKillop and Micha2018). Greater pasture utilisation, in turn, is achieved through accurate and timely grazing management (McSweeney et al., Reference McSweeney, Coughlan, Cuthbert, Halton and Ivanov2019), where near real-time information on herbage mass (HM) based on precision agriculture techniques is essential for estimating the amount of forage available both then and in the future (’t Mannetje, Reference ’t Mannetje, ’t Mannetje and Jones2000).
The most accurate means to quantify the current herbage mass (HM) is through destructive methods (Schellberg et al., Reference Schellberg, Hill, Gerhards, Rothmund and Braun2008; Fricke et al., Reference Fricke, Richter and Wachendorf2011), of which the most common form is the physical clipping of forage within quadrats randomly placed across pastures. However, the small size of an individual quadrat necessitates a large number of replicates to produce a value representative of the entire management unit, and, as such, the labour requirement for this exercise is seldom commercially viable (Martin et al., Reference Martin, Astatkie, Cooper and Fredeen2005). Consequently, the vast majority of farmers resort to non-destructive alternatives, with visual assessment (‘eyeball method’) being by far the most popular approach. Unfortunately, the resultant estimates are known to frequently suffer from low accuracy and low repeatability, especially in the absence of a conscious and continuous effort for calibration (Stockdale, Reference Stockdale1984; O’Donovan et al., Reference O’Donovan, Connolly, Dillon, Rath and Stakelum2002).
To achieve an optimal balance between the cost (initial outlay and labour requirement) and return (accuracy) of HM measurements, various rudimentary tools such as Robel poles, capacitance meters and sward sticks have been developed to date. Of these, rising plate meters (RPMs) are often considered to be one of the most theoretically attractive options (Gourley and McGowan, Reference Gourley and McGowan1991). Invented in the late 1970s (Castle, Reference Castle1976), a typical RPM features a circular plate of a known diameter, through which a vertical shaft freely passes. As the shaft is lowered to the ground, the compressed sward beneath causes the plate to rise along the shaft, and the vertical distance of this plate movement (compressed sward height: CSH) is recorded for each landing event (McSweeney et al., Reference McSweeney, Coughlan, Cuthbert, Halton and Ivanov2019). The measurement is subsequently converted to an HM value using an equation pre-calibrated for the relevant species composition and growth stage of the sward. HM estimates derived from an RPM are generally within 5-10% of the true value under good calibration (Sanderson et al., Reference Sanderson, Rotz, Fultz and Rayburn2001; Murphy et al., Reference Murphy, Murphy, O’brien and O’donovan2021), and, owing to the light weight and the long shaft that can be held above the waist level, its use requires little more physical activity than a simple walk across the pasture.
Yet, despite the seemingly apparent benefit of its use for grazing management, the global adoption rate of RPM remains low (DEFRA, 2020; McConnell et al., Reference McConnell, Huson, Gordon, Lively, Virkajärvi, Hakala, Hakojärvi, Helin, Herzon, Jokela, Peltonen, Rinne, Seppänen and Uusi-Kämppä2020). While the exact mechanism behind this tendency has not been completely elucidated, the regular time commitment required for ‘pasture walks’ is plausibly thought to be a primary deterrence (Romera et al., Reference Romera, Beukes, Clark, Clark, Levy and Tait2010, Reference Romera, Beukes, Clark, Clark and Tait2013). In particular, most RPM manufacturers and extension specialists who support its use recommend that readings are taken in a circuitous path across each paddock to account for spatial variability of HM distribution (MacAdam and Hunt, Reference MacAdam and Hunt2015; Manjunatha and Rocateli, Reference Manjunatha and Rocateli2018; Murphy et al., Reference Murphy, Murphy, O’brien and O’donovan2021). Nevertheless, studies elsewhere have suggested the law of diminishing returns, with an increase in measurement effort not guaranteeing a proportional increase in precision (O’ Sullivan et al., Reference O’ Sullivan, O’ Keeffe and Flynn1987; Hutchinson et al., Reference Hutchinson, Scobie, Beautrais, Mackay, Rennie and Moss2016). When this is indeed the case, extra walks could result in a sub-optimal allocation of on-farm labour time (Jones et al., Reference Jones, Takahashi, Fleming, Griffith, Harris and Lee2021a) and, equally importantly, the prospect of long walks could psychologically dissuade farmers from regularly measuring HM (Murphy et al., Reference Murphy, Murphy and O’ Brien2020).
The objective of the present study, therefore, was to evaluate the technical validity and time-saving potential of an alternative RPM sampling technique that requires less labour input and, in so doing, to offer practical and immediate insights into day-to-day data collection for grassland farmers in temperate regions. Specifically, HM estimates from pasture walks of the shortest distance – diagonally linking two corners of the paddock – are compared against those from conventional walks along W-shaped transects, with a view to identifying conditions under which ‘shortcutting’ is permissible without a large loss in accuracy. A statistical analysis of extensive primary datasets that encapsulate the seasonal variability in the swards was carried out to evaluate the generality of the findings. Further supplementary support was also provided via spatial statistical analysis of the data.
Materials and methods
Study site and farming system
The study was conducted at the North Wyke Farm Platform (NWFP: Orr et al., Reference Orr, Murray, Eyles, Blackwell, Cardenas and Collins2016), an instrumented cattle and sheep grazing trial in the UK (50º46’10”N, 3º54’05”W). The NWFP is located in a lowland region (126–180m AMSL) of South West England, with the land sloping away to the west and east towards the River Taw and one of its tributaries, respectively. The soil on the site predominantly belongs to two similar series, Hallsworth and Halstow (Avery, Reference Avery1980) (Figure 1 ), with a moderately stony clay loam top layer (∼36% clay) overlying a mottled stony clay sub-layer (∼60% clay). The site receives a large and consistent amount of rainfall, characteristic of grassland regions in the country, with a mean annual precipitation of 1030mm over a 35-year period between 1984 and 2019. Across the same period, the interquartile ranges for minimum and maximum daily temperatures were 3.6–10.4°C and 9.8–17.4°C, respectively.
Soil map of the North Wyke Farm Platform (NWFP). Pasture measurements for this study were taken from labelled paddocks, all of which belong to the permanent pasture treatment.

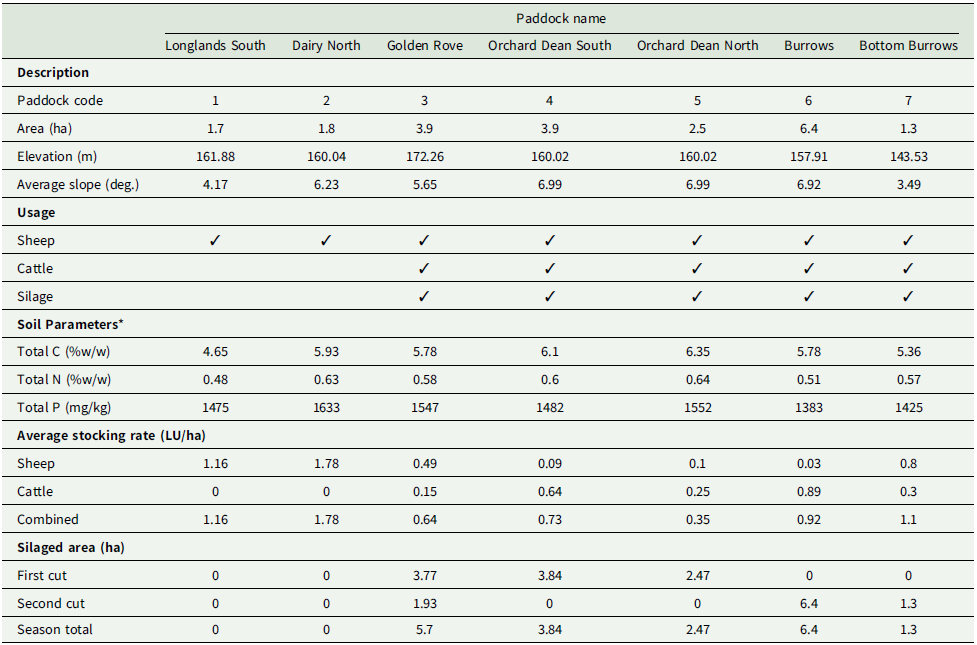
The NWFP is designed for farming system-scale research and implements pasture-based grazing systems typical of those found in temperate grasslands (McAuliffe et al., Reference McAuliffe, López-Aizpún, Blackwell, Castellano-Hinojosa, Darch and Evans2020). Since its foundation in 2010, the platform has comprised three hydrologically isolated enterprises (21 ha each) locally known as ‘farmlets’, with the over-arching objective of investigating the economic-environmental trade-offs inherent in contrasting systems. At the time of the study, two of the three farmlets operated as grazing livestock enterprises (the third was an arable enterprise), under contrasting sward management strategies of reseeded grass/legume mix and non-reseeded (permanent) pasture (McAuliffe et al., Reference McAuliffe, Takahashi, Orr, Harris and Lee2018). Of these, data for the present study were collected from the non-reseeded farmlet (21.6 ha) to allow the widest possible applicability of findings to commercial farms in the UK (Figure 1 ). This farmlet is in turn split into seven paddocks (1.3 ha to 6.4 ha), none of which had been reseeded for at least 30 years prior to the commencement of this study (Table 1 ). The paddocks are fixed in size and fences/hedges are permanent. Species composition was largely homogenous across the entire farmlet, dominated (>60%) by perennial ryegrass (Lolium perenne) but with creeping bent (Agrostis stolonifera), Yorkshire fog (Holcus lanatus) and marsh foxtail (Alopecurus geniculatus) also contributing a smaller biomass (Takahashi et al., Reference Takahashi, Harris, Blackwell, Cardenas, Collins and Dungait2018).
Description of paddock data for 2019 grazing season

C, carbon; N, nitrogen; P, phosphorus; LU, livestock unit.
* Values are an average of four samples per paddock, taken at 3-monthly intervals during 2019.
The non-reseeded farmlet supported its own herd of 30 Stabiliser® finishing cattle (Orr et al., Reference Orr, Gri, Rivero and Lee2019) as well as a flock of 75 Suffolk x Mule ewes and their lambs, sired by Charollais rams (Jones et al., Reference Jones, Takahashi, Fleming, Griffith, Harris and Lee2021b). Cattle were housed from October to April to avoid degradation of soil structure through livestock poaching, while sheep were housed from January to April over the lambing period. For the remainder of the year, livestock was grazed under continuously variable stocking to represent the most common grazing strategy in the UK (Genever and Buckingham, Reference Genever and Buckingham2016; Allen et al., Reference Allen, Batello, Berretta, Hodgson, Kothmann and Li2018) and rotated between seven paddocks based on HM measurements. The target coverage was 1500–2000 kg DM/ha for the majority of the grazing season but 1800–2500 kg DM/ha prior to ewe tupping in the autumn. Once HM fell below the target range, stocking density is reduced by allowing animals access to additional grazing area or by moving animals to another paddock if available. When HM became too high, on the other hand, stocking density was increased by fencing off a portion of the grazing area, which was then cut for silage.
Decisions on silage production were dictated by pasture requirements for grazing, and as such the, area and frequency of harvest were back-calculated from the balance between herbage growth rates and expected animal intake before housing. Depending on weather and soil conditions, grazed swards received a maximum of five applications of synthetic N fertiliser, at a rate of 40 kg N/ha per application in the form of ammonium nitrate, in monthly intervals from March to July. Fields designated for silage received compound fertiliser (N, P, K, S) in March at a rate of 80kg N/ha, 14kg of P/ha, 46kg of K/ha and 24kg of S/ha, plus an additional 40 kg N/ha of ammonium nitrate in April. Following silage cut and removal, farmyard manure (FYM) collected from the previous winter housing period was applied, at a typical rate of 19 t/ha (157 kg N/ha), to all fields subsequently to be grazed later in the season.
Data collection and experimental design
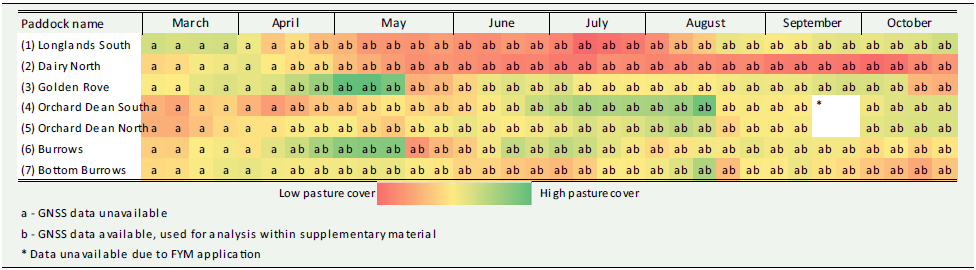
Forage data for this study were collected over a seven-month period of March–October 2019 (Jones et al., Reference Jones, Sepulveda, Powe, Le Grice, Irisarri, Griffith, Wyeness and Harris2024), covering the entire grass-growing period at the study site (Table 2 ). On each measurement day (details below), CSH was measured weekly using a Jenquip EC20 Bluetooth Electronic Platemeter (NZ Agriworks Ltd, Feilding, New Zealand) and subsequently converted to HM using an equation of HM (kg DM/ha) = CSH (cm) × 140 + 500, using existing calibrations from a comparable climate and sward type (Klootwijk et al., Reference Klootwijk, Holshof, van den Pol-van Dasselaar, van Helvoort, Engel and de Boer2019). As this equation represents a linear transformation between CSH and HM, the results of statistical tests reported below (including p-values) are neutral from the selection of the slope and intercept. Following each pasture walk, the readings were exported to the Agrinet (https://www.agrinet.ie) cloud-based farm management software via the Pastureprobe (https://www.pasturemeters.co.uk/pasture-app) smartphone app for data storage.
Paddocks and dates used for analysis shown with seasonal pasture cover

a – GNSS data unavailable.
b – GNSS data available, used for analysis within supplementary material.
*Data unavailable due to farmyard manure application.
The sampling was repeated twice on each day on each paddock, with a straight-line diagonal transect (treatment: Figure 2a) and the manufacturer-recommended W-shaped transect (control: Figure 2b) walked successively using the same equipment and operator. Following the manufacturer’s recommended protocol (Sanderson et al., Reference Sanderson, Rotz, Fultz and Rayburn2001), approximately 30 RPM readings per paddock were taken under each sampling, with precalculated pacing (number of footsteps) used to estimate recording intervals. To mirror the most common and the most acceptable practice on commercial farms, these individual readings (informally referred to as ‘plonks’) were recorded without the operator pausing at each sampling point. Prior to the trial, substantial time was taken to train the operator so that this protocol would not lead to any additional error from non-perpendicular measurement (informally referred to as ‘rocking’). As diagonal transects represented the shortest straight-line path across the relevant paddock, the recording intervals (distance between measurements) were always longer under W-transects. The actual mean sample sizes were 41 and 39 readings for the diagonal and W-transects, respectively (with the ranges of 22–58 and 30–56 readings, respectively).
Schematic example of pasture walk patterns from paddock 3 (Golden Rove). Weekly pasture readings were taken using diagonal transect (a) and W-transect (b) sampling methods. Background imagery courtesy of Google Earth.

The final dataset thus compiled contained 34 weekly sampling events across seven paddocks. Observations from four paddocks were unavailable in September due to FYM application immediately before the designated sampling date on the relevant paddock, resulting in a total of 234 date-paddock combinations (34 × 7 minus 4 missing sampling events: Table 2).
Statistical analysis
The mean and variance of HM under each date-paddock combination was estimated separately for diagonal- and W-transects, with the latter designated as ground truth for the entire pasture. Inter-transect differences in mean and variance were primarily assessed using Bonferroni-corrected t-tests and F-tests (Shaffer, Reference Shaffer1995), respectively, on the assumption that the pacing-based protocol (discussed above) provides sufficient randomness for sampling locations on each date. However, as this assumption cannot be verified, corresponding nonparametric tests (Wilcox test for location; Ansari-Bradley test for scale) and linear mixed-effects model regressions (with a fixed model structure of measurement protocol × paddock and a random model structure of time) were also conducted to appraise the robustness of findings. For the diagonal transect to be representative of the W-transect, no significant difference should be observed between the two measures.
The difference between the two sampling methods was further examined in two forms of distributions across 234 date-paddock combinations, namely the absolute difference in HM means (to identify the scale of discrepancy) and the relative difference in HM means (to identify the tendency of overestimation or underestimation), again taking the W-transect value as ground truth. This evaluation was carried out using boxplots, histograms and associated tests for normality.
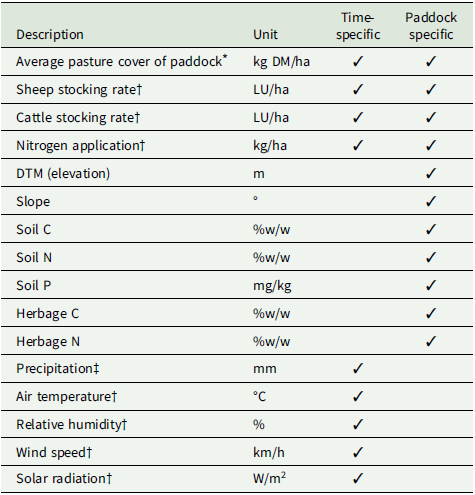
While the NWFP replicates land use and farm management strategies commonly adopted across a wide range of temperate grassland regions, HM data observed therein are necessarily influenced by weather and paddock allocation (fence lines) intrinsic to the study site. Furthermore, the soil, topography and seasonal livestock usage unique to each paddock are likely to affect the HM value on that particular paddock on that particular day. To investigate factors affecting these discrepancies, linear regression models were estimated for both absolute and relative HM differences using paddock-specific and time-specific covariates summarised in Table 3. In order to account for the potential effect of unobservable paddock-specific variables, fixed-effect specifications were also tested for both absolute and relative differences.
Description of covariates used for linear modelling

DM, dry matter; LU, livestock units; DTM, digital terrain model; C, carbon; N, nitrogen; P, phosphorus.
* according to W-transect sampling.
† mean of two weeks prior to individual pasture measurement.
‡ total of two weeks prior to individual pasture measurement.
Results
Pasture growth during the study period
The weather observed during the study period largely followed a typical annual cycle at the study site, characterised by a high temperature/solar radiation and a low rainfall in mid-summer, and the opposite in the spring and autumn (Figure 3a). A notable exception was a week in mid-June with a high level of rainfall and a period in early July that saw an extremely low level of rainfall alongside a high level of solar radiation (and thus evaporation), likely contributing to the generally low HM throughout the month of July (Figures 3b–3h).
Panel (a) shows environmental conditions affecting pasture growth throughout the season: Total weekly rainfall, average weekly temperature and solar radiation. Panels (b) to (h) show the impact of field events on changes in pasture cover over the 2019 grazing season across the seven study paddocks: (b) – Longlands South (1), (c) – Dairy North (2), (d) – Golden Rove (3), (e) – Orchard Dean South (4), (f) – Orchard Dean North (5), (g) – Burrows (6) and (h) – Bottom Burrows (7). Corresponding pasture cover estimations using both diagonal and W pattern sampling methods are also displayed on plots B to H. On paddocks four and five, readings were not taken for two consecutive weeks following application of farmyard manure (FYM, brown dotted line).

Pasture cover ranged between 1350 and 5500 kg DM/ha during the study period. Following the typical pattern of a UK grazing season, pasture growth peaked at mid-spring (Figures 3d & 3g) and then gradually declined throughout the year until late autumn. Despite regular application of inorganic nitrogen and FYM, pasture cover remained relatively constant on grazed paddocks as a consequence of the continuous variable stocking strategy. Paddocks primarily used for grazing sheep (Figures 3b & 3c) had a lower HM than those used for grazing cattle (Figures 3f & 3g) due to target sward heights to accommodate the distinct grazing behaviours of the two species. Based on the graphical representation of weekly pasture cover, there appeared little difference in HM estimates between the diagonal and W-transect sampling patterns throughout the grazing season (Figures 3b–3h).
Effect of sampling method: statistical analysis of observed HM data
Across 234 date-paddock combinations, the parametric tests showed a statistically significant (p < 0.05) difference in HM mean between the two sampling methods on 29 occasions (12.4%, t-test) without a Bonferroni correction; however, none of these differences remained significant post-correction. A significant difference in HM variance was observed on 18 occasions (7.7%, F-test) without a Bonferroni correction, which reduced to a single occasion with the correction.
Similarly, the non-parametric tests showed a statistically significant (p < 0.05) difference in HM median between the two sampling methods on 30 occasions (12.8%, Wilcox test) without a Bonferroni correction; however, none of these differences remained significant post-correction. A significant difference in HM variance was observed on 9 occasions (3.8%, Ansari-Bradley test) without a Bonferroni correction; however, none of these differences remained significant post-correction. The linear mixed-effects model regressions also corroborated this finding. Neither the direct effect of measurement protocol nor any of the interaction terms between measurement protocol × paddock were identified as a statistically significant predictor of either HM mean (p = 0.896 for direct effect, all p > 0.6 for interactions) or HM variance (p = 0.939 for direct effect, all p > 0.3 for interactions).
Overall, the mean differences in HM values recorded under diagonal and W-transects were 106 kg DM/ha (absolute difference) and 11 kg DM/ha (relative difference), respectively (Figure 4 ). The frequency distribution of the relative difference across 234 date-paddock combinations suggested that the direction of discrepancy is largely balanced, with 5% and 95% quantiles of –244.7 kg DM/ha and 252.0 kg DM/ha, respectively. This distribution however was non-normal (p < 0.001 based on Shapiro-Wilk test) due to shallow and long tails on both sides.
Histograms for difference between diagonal and W pattern sampling methods across all paddocks and sampling events, measured in kg DM/ha (DM = dry matter). Relative difference in methods (right) were calculated by subtracting W pattern readings from diagonal readings, i.e. positive differences indicate diagonal method overestimation.

A paddock-by-paddock analysis revealed a small but systematic overestimation under diagonal transects on a single paddock (paddock 7, Figure 5). When the relative difference data from all paddocks were split into three groups of an equal size based on the absolute level of HM, the distributions for high cover (> 2694 kg DM/ha) and medium cover (2215–2694 kg DM/ha) groups were not statistically different from being normal (p = 0.226 and 0.473, respectively). The low cover group (< 2215 kg DM/ha), however, demonstrated a mild skewness to the left (p < 0.001), with 5% and 95% quantiles of –86 kg and 171 kg, respectively (Figure 6 ). Causes and implications of these findings will be considered in the Discussion section.
Absolute and relative difference in pasture cover estimation between W pattern and diagonal walking patterns, within each paddock. Paddock codes: Longlands South (1), Dairy North (2), Golden Rove (3), Orchard Dean South (4), Orchard Dean North (5), Burrows (6) and Bottom Burrows (7). Paddock characteristics are listed in Table 1.

Histograms for relative difference between diagonal and W pattern sampling methods across all paddocks and sampling events, measured in kg DM/ha (DM = dry matter). When divided into three groups based on pasture cover, low, mid and high from left to right, mid and high pasture covers show a normally distributed difference. Low pasture covers are left-skewed, suggesting a higher probability of diagonal method overestimating on low pasture covers.

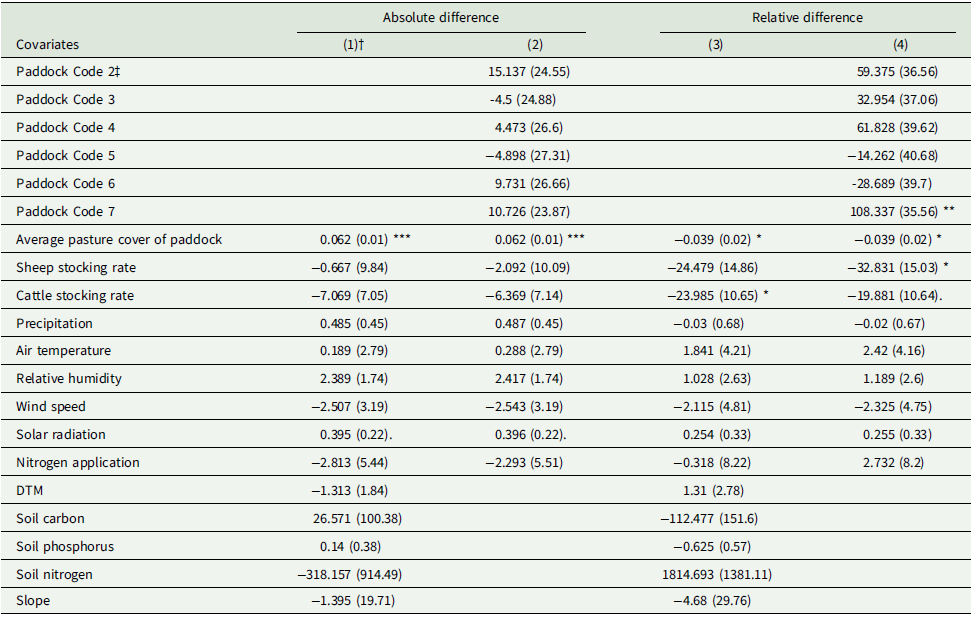
The results of linear regressions were consistent with the above findings, with a lower pasture cover associated with a slight over-estimation from diagonal transect sampling (Table 4 ). As previously identified, diagonal transect readings in paddock 7 were shown to be overestimated by ∼110 kg DM/ha on average. Stocking densities also showed a weak effect on the relative difference, with an additional 1 LU/ha linked to a 24–33 kg/ha of overestimation. All in all, however, relatively little effect was detected from either paddock-specific or time-specific covariates regardless of the model specification selected.
Coefficients of regression models investigating differences in pasture cover between technologies

Significance codes: *** p < 0.001; ** p < 0.01; * p < 0.05; p < 0.1.
Standard error shown in parentheses.
† Four models were tested, two considering paddock-level factors (1 & 3), and two considering paddock itself as a fixed effect (2 & 4). Dependent variable was absolute difference (1 & 2) and relative difference (3 & 4) in pasture cover between the two sampling methods.
‡ Paddock code 1 (Longlands South) was used as the reference factor level.
Discussion
Viability of the diagonal sampling method
The mean absolute difference in HM between sampling methods was 106 kg DM/ha across all date-paddock combinations. The generally high level of agreement between the two methods was strongly supported by the statistical analyses, which were designed to account for the seasonal and probabilistic nature of the observed HM distributions and draw the best possible practical insights for grassland farmers.
Inaccurate estimation of HM necessarily results in poor allocation of forage resources both amongst animals and across time (McSweeney et al., Reference McSweeney, Coughlan, Cuthbert, Halton and Ivanov2019). While small errors arising from miscalibration are likely to be harmless for practical purposes (Rayburn and Rayburn, Reference Rayburn and Rayburn1998), it has been suggested that, for the labour cost to be justified, the error in yield estimation must be less than 10% (Sanderson et al., Reference Sanderson, Rotz, Fultz and Rayburn2001). In the present study, the average discrepancy in yield estimation between sampling methods was 4.0%, with 91.6% of date-paddock combinations recording a discrepancy of 10% or below. Thus, most of the time, information gained from diagonal transect sampling was largely comparable to that gained from W-transect sampling.
A multitude of factors are known to be limiting the uptake of precision agriculture technologies – the most noteworthy of these barriers include a lack of confidence in measurement accuracy (Eastwood, Dela Rue, & Kerslake, Reference Eastwood, Dela Rue and Kerslake2020), a low perceived value associated with data (Eastwood & Dela Rue, Reference Eastwood, Dela Rue and Armstrong2020; Kasemi, Lammer, & Vincze, Reference Kasemi, Lammer and Vincze2022; Palma-Molina et al., Reference Palma-Molina, Hennessy, O’Connor, Onakuse, O’Leary, Moran and Shalloo2023) and broader social factors such as peer recommendations, practice awareness and existing skills and knowledge (Kuehne et al., Reference Kuehne, Llewellyn, Pannell, Wilkinson, Dolling, Ouzman and Ewing2017; van den Pol-van Dasselaar, Hennessy, & Isselstein, Reference van den Pol-van Dasselaar, Hennessy and Isselstein2020). Alongside these factors, the perceived time and cost requirements of accurate pasture measurements are considered to be the greatest barrier specifically relating to HM measurement technology (Murphy et al., Reference Murphy, Murphy, O’brien and O’donovan2021). Thus, further improvements in labour efficiency are one of the foremost reasons that can reduce these barriers and influence uptake (Olaizola et al., Reference Olaizola, Chertouh and Manrique2008; Barnes et al., Reference Barnes, De Soto, Eory, Beck, Balafoutis and Sánchez2019a, Reference Barnes, Soto, Eory, Beck, Balafoutis and Sánchez2019b). In the current study, Global Navigation Satellite System (GNSS) timestamps from RPM provided a reasonably accurate estimate of the time saved by walking a diagonal transect rather than a W-transect. On average, the diagonal walk resulted in a 51.2% reduction in time, requiring 1.2 min/ha rather than 2.5 min/ha across seven paddocks of different sizes and shapes. If a 100-ha grazing platform is sampled weekly with a paid labour cost of £10/hr, this would result in an estimated annual saving of £1,128.
Even in the improbable event that diagonal transect sampling reduces the estimation accuracy, imperfect information on HM often results in a substantially greater resource use efficiency when compared to no information at all. For example, a recent study demonstrated that the possession of HM estimates with an average measurement error of 15% would increase the farm profitability by £197/ha (Beukes et al., Reference Beukes, McCarthy, Wims, Gregorini and Romera2019). Elsewhere, studies have also established a strong causal link between the measurement of pasture cover and dry matter production and pasture utilisation (Hanrahan et al., Reference Hanrahan, Geoghegan, O’Donovan, Griffith, Ruelle and Wallace2017; Murphy et al., Reference Murphy, Murphy and O’ Brien2020) and, separately, between pasture utilisation and farm profit per hectare (Dillon, Reference Dillon2011; Mayne and Bailey, Reference Mayne and Bailey2016).
Notwithstanding, care should be taken before extending the study results to a general recommendation across temperate grasslands, as the spatial structure that governs the HM distribution is influenced by many and often unobservable factors. As a case in point, RPM readings from diagonal transects on paddock 7 consistently overestimated HM by ∼110kg DM/ha and the reason for this tendency remained unidentified following the regression analysis. Here, a closer look at the field shape revealed that a large proportion of the ‘natural’ W-transect on paddock 7 is drawn parallel to a fence line, in a region where pasture cover is generally lower due to livestock frequently gathering near the boundary (Figure 7 ). The observed ‘overestimation’ in this instance, therefore, is likely to be a consequence of an underestimated HM under the W-transect. At the practical level, however, such an error may only have a negligible overall impact in many instances. This is because many decisions made by grassland managers are targeted at the whole-farm or grazing platform scale (Gibon, Reference Gibon2005; Shalloo et al., Reference Shalloo, Donovan, Leso, Werner, Ruelle, Geoghegan, Delaby and Leary2018), and, as a result, the relative impact of a discrepancy occurring on a single paddock would often be diluted when all readings are considered collectively. As measuring HM at the whole-farm scale is a particularly labour-intensive task, this further supports the use of more time-efficient methods to reduce labour requirements.
Section of W pattern rising plate meter (RPM) walk running alongside field margin in paddock 7 (Bottom Burrows).

Limitations of the inter-transect comparison
A limitation of this study revolves around the capture of spatial effects and the utilisation of these effects into the statistical analyses (e.g., Goovaerts, Reference Goovaerts2001). Given resource constraints, this study focused on sampling over time (with diagonal and W-transects) rather than over space (say, with grid sampling), meaning that spatial effects would not be adequately captured at each weekly time point. Sampling over finer spatial resolutions, ideally on some regular grid, would have led to not only fewer observations over time but also to fewer paddocks covered by the study. This, in turn, would have inhibited generalisation of results due to the individual characteristics of each paddock (e.g. size, soil, topography and historic management) and the temporal changes in weather and pasture management, likely leading to the findings being less compelling – and thus the proposed technology less attractive – to farmers.
As a study designed to assist a large proportion of livestock farms where no HM data are currently recorded, the more ‘approachable’ strategy employed in this study is thought to have provided the best attainable balance between the cost and benefit of information from the study. That said, a complementary spatial statistical analysis to test the robustness of the results reported above, with caveats due to the temporal focus of this study’s sample design, is presented in the Supplementary Material. Caveats aside, the results from the spatial analysis corroborate the study’s main findings. Future work should investigate this spatial limitation in more detail, possibly combined with remote sensing technologies described below.
Alternative technologies
Advances in technology have driven the emergence of new techniques which complement, and could eventually replace, the RPM as a means of measuring HM (Furnitto, Ramírez-Cuesta, Intrigliolo, Todde, & Failla, Reference Furnitto, Ramírez-Cuesta, Intrigliolo, Todde and Failla2025). Satellite remote sensing, both visible/infrared- and radar-based, can provide timely and accurate data for informing management decisions in a semi-automated fashion (Atzberger, Reference Atzberger2013) and is of particularly high economic value when large areas are studied (Reinermann et al., Reference Reinermann, Asam and Kuenzer2020). While poor spatial resolution limits its use for accurate monitoring of forage utilisation short-term, this issue is progressively being addressed in the industry (Gillan et al., Reference Gillan, McClaran, Swetnam and Heilman2019). This, in turn, is making the technique particularly attractive in marginal and upland areas (FAO, 2011) where physically measuring HM is practically challenging, excessively time consuming and ultimately inaccurate (Hutchinson et al., Reference Hutchinson, Scobie, Beautrais, Mackay, Rennie and Moss2016).
Alternatively, the use of unmanned aerial vehicles (UAVs or ‘drones’) has also increased in popularity over recent years (Alvarez-Hess et al., Reference Alvarez-Hess, Thomson, Karunaratne, Douglas, Wright and Heard2021; Théau et al., Reference Théau, Lauzier-Hudon, Aubé and Devillers2021). UAVs provide a number of advantages over satellites (and piloted aircrafts), as they are relatively low-cost and safe, can be deployed quickly and repeatedly and can provide data at a higher resolution (Rango et al., Reference Rango, Laliberte, Herrick, Winters, Havstad and Steele2009). UAVs also provide some advantages over on-field approaches, as they are less time consuming (Michez et al., Reference Michez, Lejeune, Bauwens, Lalaina Herinaina and Blaise2019) and, once initial model training is complete, often provide more accurate results than the RPM (Michez et al., Reference Michez, Philippe, David, Sébastien, Christian and Bindelle2020). However, due to the requirements of stable weather and environmental conditions (Von Bueren et al., Reference von Bueren, Burkart, Hueni, Rascher, Tuohy and Yule2015), high initial costs (Poley and McDermid, Reference Poley and McDermid2020), a lack of awareness and technical knowledge (Chouhan, Patel, Singh, & Tejani, Reference Chouhan, Patel, Singh and Tejani2025), strict aviation regulations and unintuitive calibration processes, interest from farmers in this technology has been surprisingly underwhelming. Ultimately, an understanding of the spatial structure of HM for a given paddock can help determine when a simple ground method via an RPM diagonal transect is sufficient (i.e., when spatial structure is weak) and when higher-resolution sensing tools are warranted (i.e., when spatial structure is strong).
Alongside the above limitations, the pasture walk required for use of the RPM technique allows producers to conduct further visual assessments to support more nuanced management decisions – assessments which are not currently feasible through the use of UAVs. These contextual cues can include visual soil assessments (VSAs) to identify poaching or soil structure degradation (Davies & Armstrong, Reference Davies and Armstrong1986), observations of weed species prevalence to support decisions on the use of weed control (Andújar, Ribeiro, Carmona, Fernández-Quintanilla, & Dorado, Reference Andújar, Ribeiro, Carmona, Fernández-Quintanilla and Dorado2010), and identification of grazing behaviours to identify areas of preferential grazing, such as those observed within the current study on paddock 7 (Howery, Cibils, & Anderson, Reference Howery, Cibils and Anderson2013).
Combined together, rudimentary approaches more accessible to farmers are likely to stay as a primary method of HM estimation on the majority of small-to-medium scale commercial farms, at least for the foreseeable future.
Conclusions
The presented study has found that the diagonal transect RPM sampling does not compromise the accuracy of HM estimation while saving labour input by ∼50% compared to the W-transect RPM sampling in the majority of cases, offering an immediate practical insight for pasture management and associated knowledge dissemination programmes. Furthermore, as many grazing management decisions are made at the farm scale, any minor discrepancies caused through use of the diagonal method are likely to be offset when all paddock readings are aggregated. Although the findings of the current study cannot yet be extrapolated to more varied types of pasture swards (such as tropical grasses), the simplified diagonal transect is likely to encourage uptake of the RPM technique, particularly by grassland managers who do not formally measure HM and instead currently rely on visual assessment. As a next step, future studies could convert UAV and satellite imageries into indicators of HM, complemented by ground-truth grid-based RPM sampling, to develop universally optimal space-time RPM sampling strategies and thereby further improve the cost-accuracy ratio under different weather patterns, field configurations and management conditions.
Supplementary material
The supplementary material for this article can be found at https://doi.org/10.1017/S0021859625100282.
Acknowledgements
This paper builds on work done for the PhD of the first author. PhD thesis entitled ‘The Value of Information: Redefining Key Performance Indicators to Support Improvements in Sheep Farming Efficiency’ can be accessed in full at https://hdl.handle.net/1983/b2b89bce-c37c-4579-bb94-809e84a8d566.
Author contributions
Conceptualisation, A.J. and T.T.; methodology, A.J., P.H., and T.T.; formal analysis, A.J., P.H., and T.T.; investigation, A.J., T.T., M.L., and P.H.; resources, A.J.; data curation, A.J., P.H. and T.T.; visualisation, A.J.; supervision, M.L.; project administration, T.T.; funding acquisition, T.T. and M.L.; writing – original draft preparation, A.J. and T.T.; writing – review and editing, A.J., P.H., T.T., and M.L. All authors have read and agreed to the published version of the manuscript.
Funding statement
This work was funded by the Agriculture and Horticulture Development Board (61100030), the Biotechnology and Biological Sciences Research Council (grants: BBS/E/RH/23NB0008, BBS/E/C/000I0320, BBS/E/RH/230004C, BB/Y008723/1) and Department of Agriculture, Environment and Rural Affairs (22/5/01).
Competing interests
The authors declare that they have no conflict of interest.
Availability of data
Contextual data used for this research are publicly available from the North Wyke Farm Platform data portal (https://nwfp.rothamsted.ac.uk). The specific RPM HM data for the W-transects can be obtained from the Rothamsted Research repository at: https://doi.org/10.23637/ihvddnpp, while the diagonal transects are available from the corresponding author on reasonable request.
Code availability
The R script used to produce reported outputs are available from the corresponding author on reasonable request. All data analyses were conducted using R version 3.6.3 (R Core Team, 2020), with the ‘gstat’ package (Pebesma, Reference Pebesma2004) deployed for the spatial simulations given in Supplementary Material.