Implications
The horses maximised their digestible organic matter intake (DOMI) on the pasture, where a wide range of sward heights was available. They appeared to benefit from using both short swards of high quality and tall swards offering a high instantaneous intake rate. These results suggest that nutrient assimilation by horses is affected both by digestive constraints (the time needed to process food from tall mature swards) and by the availability of good quality (short) swards. If these results are confirmed, it will be necessary to re-evaluate the concept of ‘horse-sick’ pastures.
Introduction
In grasslands, the structure of the vegetation (determined principally by variations in the height of the sward), which determines the quantity and quality of the resources available to grazers, has a major influence on animal performance through its effect on nutrient intake. As plants mature, high-biomass patches, where herbivores can achieve the highest dry matter intake rate (Gross et al., Reference Gross, Shipley, Hobbs, Spalinger and Wunder1993) accumulate structural fibre and lose nitrogen, becoming less digestible. As a consequence, their passage time in the gut increases, so their nutritional value for the animals declines (Van Soest, Reference Van Soest1982).
In ruminants, daily intake rates are often constrained by the rate of passage of ingesta through the rumen, which is strongly influenced by the rate of digestion; however, it has been suggested that forage maturation effects should be much less pronounced in hindgut fermenters such as equids (Fryxell, Reference Fryxell1991), which may simply ingest larger quantities of poor-quality forage and pass them speedily through the digestive tract, as intake in equids is less constrained by forage fibrousness (Edouard et al., Reference Edouard, Fleurance, Martin-Rosset, Duncan, Dulphy, Grange, Baumont, Dubroeucq, Pérez-Barberia and Gordon2008). Moreover, the availability constraint may be weaker for equids on short grass because of their double sets of incisors. Horses play an increasing role in the management of grasslands in Europe and they often use plant resources in extensive conditions (Micol and Martin-Rosset, Reference Micol and Martin-Rosset1995). However, the data on the influence of the heterogeneity of the vegetation on the daily intake and foraging behaviour of horses are sparse (but see Edouard et al. (Reference Edouard, Fleurance, Duncan, Baumont and Dumont2009) for the influence of sward height on high-quality swards).
We report here the results of a preliminary study concerning the effects of sward structure on nutrient assimilation by horses and assess how the animals adapted their grazing behaviour facing swards varying in height and quality. We compared daily intake, feeding time and the use of patches of different heights in horses grazing a short, high-quality pasture (S); a tall pasture of poor quality (T) and a heterogeneous pasture (H) offering a large range of grass heights.
Material and methods
Study site, pastures and animals
The study was conducted in the natural wet grasslands of the communal pastures of Magnils-Reigniers (Marais Poitevin, France). In July 1999 and in September 2000, a different pair of growing, non-breeding mares (2 to 3 years old, 719 ± 84 s.e/kg in 1999, 742 ± 6 s.e/kg in 2000, Mulassier Poitevin breed) grazed for a week in each of the three treatment plots. In the first year, the mares grazed successively the T, the S, then the H pastures; in the second year, the last two treatments were reversed. The three experimental pastures were chosen to be as similar as possible in terms of soils and plant communities (for detailed descriptions, see Amiaud et al., Reference Amiaud, Bouzillé, Tournade and Bonis1998). The grass heights in the S and T pastures were relatively homogeneous, as the tall one had been left ungrazed for the growing season, and the short one had been heavily grazed by horses and cattle. Since 1995, the H pasture has been grazed each year by horses from May to November (mean stocking rate: 700 kg/ha). The areas used were sufficient to provide superabundant food for the mares during the weeklong experiments (H and S = 2 ha, T = 0.25 ha; the same areas were used each year).
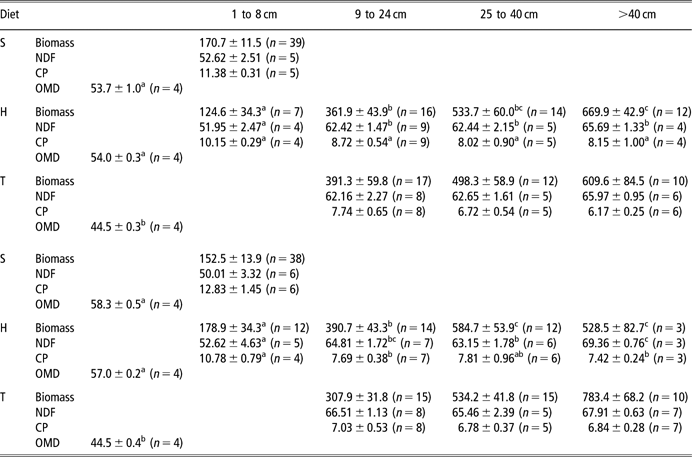
The distribution of grass heights in the pastures (measured with a drop disc of 100 cm2, 2.7 g; Stewart et al., Reference Stewart, Bourn and Thomas2001) was assessed twice a week, by observations on the diagonals every 3 m (sample sizes were between 257 and 397 per pasture). We grouped grass heights into classes (1 to 4 cm, 5 to 8 cm, 9 to 16 cm, 17 to 24 cm, 25 to 32 cm, 33 to 40 cm, 41 to 48 cm, 49 to 56 cm, 57 to 64 cm, 65 to 72 cm and >72 cm) before statistical analyses. The biomass of the grass available and its quality (see Table 1) were determined by clipping samples of grass in a 25 cm × 25 cm quadrat and drying them at 60°C to constant weight. A total of 40 samples per pasture were taken each year (20 per diagonal) and were completed by collecting samples randomly in each vegetation community in order to obtain at least two measures/community/height class. We analysed the nitrogen (Kjeldahl method) and NDF contents at the Institut National de la Recherche Agronomique (INRA UR 889, Lusignan, France) and at the Centre National de la Recherche Scientifique – Service Central d’Analyse (CNRS, Vernaison, France), using randomly selected grass samples.
Biomass (gDM/m2) and grass quality (neutral detergent fibre, % dry matter (DM); and crude protein, nitrogen × 6.25% DM; organic matter digestibility%; mean ± s.e.) for swards of different height in (a) July 1999 and (b) September 2000Footnote i

OMD = organic-matter digestibility; Pasture type: S = short; H = heterogeneous; T = tall.
i Biomass and grass quality, different letter combinations denote significant differences among the height classes in the heterogeneous pasture within years (one-way ANOVA or Mann–Whitney U-tests, P < 0.05). Biomass and grass quality per height class never differed significantly among pastures within years (one-way ANOVA or Mann–Whitney U-tests, P > 0.05).
For digestibility, different letter combinations denote significant differences among pastures within years (Mann–Whitney U-test, P < 0.05). For biomass, in the cases where n < 3, the data are not presented.
Nutrient assimilation
Daily OMI was estimated by total faecal collection with organic matter digestibility (OMD) estimated from faecal crude protein (CP) concentration (Mésochina et al., Reference Mésochina, Martin-Rosset, Peyraud, Duncan, Micol and Boulot1998). The pasture was initially cleared of all the faeces produced during the first 3 days, and daily total collection was performed from days 4 to 7 twice a day (morning and evening, by three to four people). Faecal organic matter content and nitrogen were determined in one sample from the bulked daily collections. We expected OMI to be higher in autumn, as there is a strong seasonal variation in intake in these grasslands (Ménard et al., Reference Ménard, Duncan, Fleurance, Georges and Lila2002).
We then calculated the daily nutrient extraction rate (DOMI) as: DOMI = OMI × OMD
The results measure the average intake of the two individuals within the treatment.
Foraging behaviour
We conducted two sessions of 24-h observations in each pasture (days 3 and 6 of each week), using scan sampling at intervals of 5 min; the mares were accustomed to the presence of observers and to the use of a lamp at night. An animal was recorded as feeding if it was searching (head below the horizontal), biting, chewing or swallowing, and we sampled the height of the surface of the sward it was feeding on, using the drop-disc method (Stewart et al., Reference Stewart, Bourn and Thomas2001).
Statistical analyses
As the behaviour of the two individuals in the same field was not independent, the values for the individuals were averaged in all analyses to avoid pseudoreplication. For each pasture, we first calculated the number of feeding observations expected for the different classes of grass height (log (number of feeding observations + 1)) assuming that the animals distributed their feeding behaviour in proportion to the availability of grass height classes in the pasture. This variable (‘Expected’) was first included in a general linear mixed model (GLIMMIX procedure) adapted to Poisson distributions (PROC MIXED; Statistical Analysis Systems Institute, 1999); we then fitted ‘Height class’ to test whether grass height class had an effect on the distribution of bites once the availability had been taken account. In the GLIMMIX procedure, year and year × session were included as random effects, which allowed the variations due to experimental period to be evaluated and accounted for in the analysis. In the H pasture, selection for each grass height class (Si) was quantified by calculating the Ivlev’s electivity index: Si = (ci − ai)/(ci + ai) (Ivlev, Reference Ivlev1961), where ci is the proportion (between 0 and 1) of the grass height class ‘’ in the diet and ‘ai’ is the proportion (between 0 and 1) of the grass height class ‘i’ in the pasture. Significance of selection for (Si > 0) or against (Si < 0) each grass height class was determined by comparing the Ivlev’s electivity index results to zero using a Student’s t-test.
For all the other tests, we used analysis of variance in which the assumptions were met for parametric tests after the arcsine transformation for proportions, otherwise we used non-parametric tests (Kruskal–Wallis or Mann–Whitney U-tests); all tests were conducted using Systat 9 (Statistical Package for the Social Sciences, 1998).
Results
Foraging behaviour in relation to sward structure
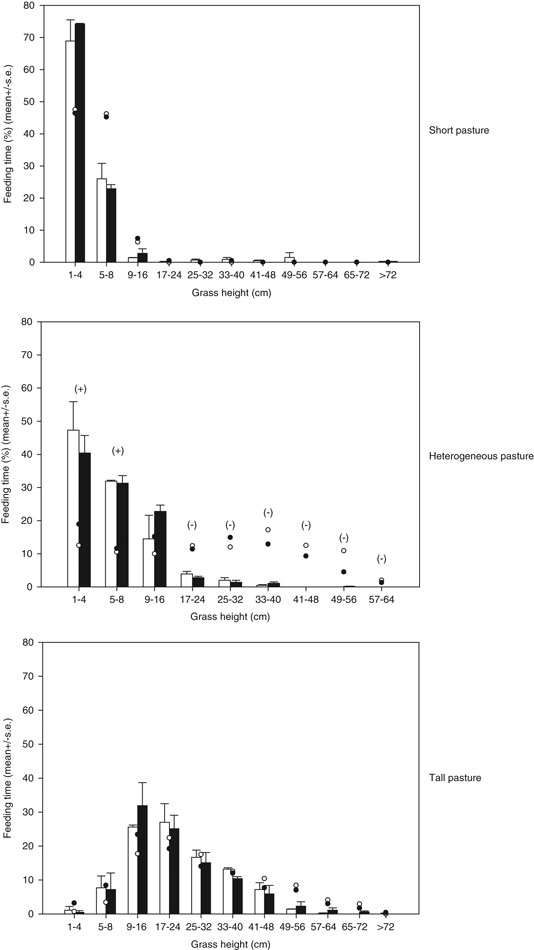
In all, 95% of the grass available in the S pasture was less than 8 cm high (see Figure 1), and the daily feeding height (i.e. for each day, the mean of the heights registered at each feeding event) by horses was 5.2 ± 0.3 cm in 1999 and 4.0 ± 0.1 cm in 2000 (mean ± s.e.; n = 2 days for each year). In the T pasture, the grass heights were mainly between 9 and 40 cm (Figure 1), and the daily feeding height was 22.9 ± 0.5 and 22.1 ± 0.5 cm in 1999 and 2000, respectively. In the H pasture, a wide range of grass heights was available, rather evenly distributed between 1 and 56 cm (Figure 1), and the daily feeding height by horses was intermediate (6.4 ± 0.2 cm in 1999 and 7.3 ± 0.2 cm in 2000); but, so close to the short end of the range available (Figure 1) that in 1999, the difference in the daily feeding height between S and H pastures only tended to be significant (P = 0.067).
Use of grass heights for feeding (% daily feeding time, mean ± s.e., n = 2 days) in 1999 (open bars) and 2000 (solid bars). Open circles (1999) and solid circles (2000) indicate the expected use, under the hypothesis of random grazing (i.e. in proportion to the availability of the different classes of grass height). In the heterogeneous pasture, selection (+) or avoidance (−) are indicated (t-tests on Ivlev’s electivity index, P < 0.05, n = 4 days; there was no year effect).

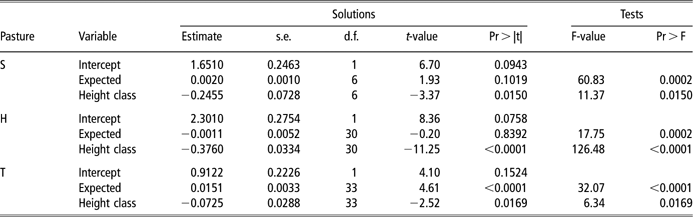
In each pasture, after taking the significant effect of grass height availability on feeding choices by horses into account (‘Expected’; Table 2), there was an effect of grass height (‘Height class’) in all tests. The overall pattern was consistent; the horses selected the shortest grass (and avoided the tallest, except in the T treatment in 2000), and this effect was much more marked in the H pasture (P < 0.0001) as compared with the S (P = 0.015) and T pastures (P = 0.0169). In the H pasture, the horses fed on the two shortest class heights (1 to 4 cm and 5 to 8 cm) three times more than expected under the hypothesis of random grazing, and avoided the swards taller than 17 cm (Figure 1).
Tests of the effects of grass height on the feeding behaviour of the mares in the pastures: solutions and tests for fixed effects (GLIMMIX procedure)

The time spent foraging by the mares did not vary significantly among pastures (Kruskal–Wallis, n = 6), the horses ate for 55.1 ± 2.4% of the 24 h in 1999 and 55.4 ± 2.1% in 2000 (mean ± s.e.). There was, however, a trend for them to feed for longer in the S pasture in 2000 (S = 60.2 ± 5%, H = 54.9 ± 0.6%, T = 51.2 ± 1%; P = 0.156), but not in 1999 (S = 53.6 ± 5.9%, H = 55.6 ± 6.7%, T = 56.1 ± 1.2%; P = 0.867).
Effects of pasture structure on intake and nutrient assimilation
Grass biomass increased with grass height, but its quality declined. CP was about 50% higher in short grass (1 to 8 cm) than in the taller height classes (though this was only a trend in 1999), with NDF about 20% higher in the taller grasses (Table 1). The OMD of the diets was lower in the T pasture compared with the H and S pastures, by 20% to 30% (Table 1).
In 1999, OMI was higher in the H and T pastures than in the S pasture (Table 3), and in 2000, OMI was highest on the H sward. The mares were able to increase their daily DOMI intake significantly when grazing the H in comparison with either the S or the T pastures in both years (Table 3).
Daily organic matter intake and daily digestible organic matter intake for the mares in short, heterogeneous and tall pasturesFootnote i

S = short; H = heterogeneous; T = tall; OMI = organic matter intake; DOMI = digestible organic matter intake.
Mean values ± s.e. (n = 4).
i Different letters denote significant differences within years (Mann–Whitney U-test, P < 0.05).
Discussion
Daily OMI did not increase monotonically with grass height and was lower in the tall than the intermediate pasture treatment in 2000, and tended to be lower in 1999 as well. The fibre (NDF) content was highest for the taller grass treatment (circa 20% greater than the short grass treatment; Table 1), and it is possible that OMI on the tall pasture was limited by digestive constraints, as it is known that voluntary intake by equids is lower on straws (high fibre) than on other forages (Martin-Rosset and Doreau, Reference Martin-Rosset and Doreau1984; Dulphy et al., Reference Dulphy, Martin-Rosset, Dubroeucq and Jailler1997). There is also a possibility that food processing in the mouth was limiting intake on this more fibrous forage, as the horses processed the same amount of fibre per chew (measured as (daily intake × %NDF)/(number of chews/min × min feeding per day)) on short (233 ± 4 mg fiber/chew) and tall grass (227 ± 4 mg fiber/chew; Mann–Whitney test, ns = non-significant, n = 8). As a result, the horses had to chew more per gram of OMI on tall grass where the food was 20% more fibrous, which would increase the costs of feeding on tall grass. Intake on the S-pasture treatment was lower than on the other two pasture treatments in 1999, but not different from the T pasture in 2000. Bite rates on the S-pasture treatment were about three times higher than on the tall treatment (36.5 ± 1.6 and 41.4 ± 1.8 bites per min on S in 1999 and 2000, respectively, and 11.1 ± 0.9 and 15.0 ± 2.4 bites/min on T in 1999 and 2000, respectively; Mann–Whitney U-test, P < 0.05), and the horses may have extended their feeding times in 2000. A surprising result is that the animals did not increase their daily feeding times more on the S pastures (54% in 1999 and 64% in 2000), since feeding times of up to 79% have been found elsewhere (Mésochina, Reference Mésochina2000; Rogalski, Reference Rogalski1970). It is possible that 1 week was not sufficient for the mares to adapt their feeding times to the very short swards. Moreover, a small number of individuals were used here, as in other studies, because of the high costs of measuring daily intake in the field, so the generality of our results must be tested using a larger number of animals. In conclusion, from these results we expect that the functional response of OMI by horses at the daily time scale is a dome-shaped, Type 4.
Daily nutrient assimilation, the product of intake and digestibility, was much higher in the H-pasture treatment compared with the S (+35%) and the T (+55%) pastures. In this pasture, a large range of sward heights were available and the horses may have benefited from both the tall swards offering a high instantaneous intake rate and the short ones of high quality. Indeed, the daily feeding height by horses (i.e. the mean of the heights registered at each feeding event) in the H pasture (6 to 7 cm) was intermediate between the values achieved in the S (4 to 5 cm) and T pastures (22 to 23 cm). According to the forage maturation hypothesis (FMH; Fryxell, Reference Fryxell1991), the daily intake of digestible nutrients is highest on swards of intermediate height because of the inverse relationship between the abundance and the quality of plant tissues. This has been confirmed in ruminants by estimating daily rates of energy gain in relation to grass biomass (Wilmshurst et al., Reference Wilmshurst, Fryxell and Colucci1999a and Reference Wilmshurst, Fryxell, Farm, Sinclair and Henschel1999b; Drescher et al., Reference Drescher, Heitkönig, Van den Brink and Prins2006), and many studies demonstrated that animals select for patches with intermediate biomass (Wilmshurst et al., Reference Wilmshurst, Fryxell and Hudson1995, Reference Wilmshurst, Fryxell and Colucci1999a and Reference Wilmshurst, Fryxell, Farm, Sinclair and Henschel1999b). In our study, the effect of grass height on feeding site selection by horses was strongest in the H pasture where there was more variation in height; the animals selected the shortest heights which is a typical pattern for horses in temperate grasslands (see references in Ménard et al., Reference Ménard, Duncan, Fleurance, Georges and Lila2002). The applicability of the FMH in horses needs to be tested experimentally; if the FMH predicts successfully the overall shape of the nutrient gain function of horses in relation to increasing pasture biomass, but not their choice of feeding sites, this suggests that other factors may influence their feeding choices. A recent study suggests that horses may avoid patches of tall grass of low quality and over-select the patches of short grass far from faeces because of the gastrointestinal parasites (Fleurance et al., Reference Fleurance, Duncan, Fritz, Cabaret, Cortet and Gordon2007).
Acknowledgements
This work was supported by the Parc Interrégional du Marais Poitevin (special thanks to Didier Naudon and Sébastien Cosson), and the Commune of Magnils-Reigniers. We are grateful to Grégory Loucougaray, Jan-Bernard Bouzillé, Anne Bonis and Bernard Amiaud (University of Rennes 1) for inviting us to join their experiment on the impact of horses and cattle on vegetation dynamics. Many thanks to the colleagues from the CNRS UPR 1934 who helped with the observations, and Andrew Illius was generous with his time and his ideas on comparative mammalian nutritional strategies.