Implications
The diallel cross carried out between four maternal rabbit lines (A, V, H and LP) have shown that all of them can be used to produce competitive crossbred does for rabbit meat production. However, some differences have been found among the simple crosses that would allow to adequate the genetic type of the crossbred doe to the different technical and management peculiarities of the rabbit farms. Excepting the trait kindling interval, no reciprocal effects have been found for the studied litter size traits. Therefore, a cross and its reciprocal could be used to produce the crossbred does.
Introduction
Litter size is an important trait in selection programmes of prolific species (pig and rabbit), in particular in maternal lines; its improvement allows producing kits at a lower cost (Cartuche et al., Reference Cartuche, Pascual, Gómez and Blasco2014). In general, the heritability estimates of litter size at different ages (birth, weaning and marketing) are <0.15 and its repeatability <0.25 (Piles et al., Reference Piles, García, Rafel, Ramón and Baselga2006; Mantovani et al., Reference Mantovani, Sartori, Mezzadri and Lenarduzzi2008). The most frequent estimates are around 0.08 for heritability and 0.15 for repeatability, and a decreasing trend has also been observed from litter size at birth to litter size at weaning (Ragab and Baselga, Reference Ragab and Baselga2011). Hence, the expected response to direct selection for this trait is low, but the estimated responses have been even lower than expected. The genetic trends estimated were ~0.1 kits born alive or weaned per litter and generation (Estany et al., Reference Estany, Baselga, Blasco and Camacho1989; Rochambeau et al., Reference Rochambeau, de, Bolet and Tudela1994; Gómez et al., Reference Gómez, Rafel, Ramón and Baselga1996). García and Baselga (Reference García and Baselga2002a and 2002Reference García and Baselgab) found that the genetic trend was 0.175 and 0.09 weaned kits per generation in lines A and V, respectively. The selection in maternal lines in rabbit is based on selection within finite populations which has cumulated effects, increasing inbreeding (Verrier et al., Reference Verrier, Colleau and Foulley1990; Wray and Thompson, Reference Wray and Thompson1990; Wray et al., Reference Wray, Woolliams and Thompson1990; Ragab et al., Reference Ragab, Sánchez, Mínguez, Vicente and Baselga2015), augmenting the variation between lines and changing the gene frequency between populations. Therefore, crossbreeding is an effective way of utilising available breed resources and exploiting genetic variation between populations. Its main purpose is to produce superior crosses, taking profit of the direct and maternal genetic effects of the lines, as well as the heterosis between them (Long, Reference Long1980; Johnson, Reference Johnson1981), their complementary and the break out of the accumulated inbreeding during the selection of the lines (Baselga, Reference Baselga, García, Sánchez, Vicente and Lavara2004). Previous selection and inbreeding can have an effect on the degree of heterosis by changing the gene frequency of the genes affecting the trait because the heterosis is positively related to the genetic distance between the parental lines (Xu, Reference Xu2003; Brun and Baselga, Reference Brun and Saleil2005). In most studies conducted in rabbit populations direct heterosis had a positive effect on total born and number born alive whereas it was always positive for litter size at weaning (Khalil et al., Reference Khalil and Afifi1995; Baselga et al., Reference Baselga2003; Orengo et al., Reference Orengo, Gómez, Piles, Ramón and Rafel2003; Youssef et al., Reference Youssef, Iraqi, El-Raffa, Afifi, Khalil, García and Baselga2008). Negative values were obtained in few studies for total born and number born alive (Khalil et al., Reference Khalil and Afifi1995; Iraqi et al., Reference Iraqi, Ibrahim, Hassan and El-Deghadi2006).
The selection programme of Polytechnic University of Valencia has four maternal lines of rabbits (A, V, H and LP), very different in their selection history and criteria of foundation, which show high performance and appear to be a priori competitive lines to produce commercial crossbred does (Ragab and Baselga, Reference Ragab and Baselga2011). A diallel cross was carried out among these lines and the litter size components of the genetics groups were analysed, estimating the corresponding crossbreeding parameters (Ragab et al., Reference Ragab, Sánchez and Baselga2014). The present study aims to extend the previous analysis to litter size traits, recorded after birth, as well as kindling interval, in order to assess the final productive performance of the lines and their simple crosses.
Material and methods
The university research protocol was approved by the animal care and use committee of the Polytechnic University of Valencia.
Animals and management
A diallel cross involving four maternal lines of rabbits (A, V, H and LP, selected for litter size at weaning and described previously by Ragab and Baselga, Reference Ragab and Baselga2011) was carried out. The last generation of selection considered was the 45th, 41th, 26th and 11th, respectively. The experimental work was carried out in four Spanish farms with a total of 2260 cages available for breeding animals. The total number of data was 34 546 parities from 7111 does distributed between four different farms. The farms were located in León (farm 1, 1822 does), Castellón (farm 2, 1947 does), Tarragona (farm 3, 1584 does) and Valencia, Polytechnic of Valencia (UPV) (farm 4, 1758 does). The genetic groups involved in the experiment were the four purebred lines (AA, VV, HH and LL) and the 12 single crosses: AV, VA, AH, HA, AL, LA, VH, HV, VL, LV, HL and LH. Notice that first letter of the names of the crosses corresponds to the sire line involved in the cross whereas the second one corresponds to the dam line, and L is used to identify the LP line.
Farms 1 and 2 raised all the crossbreds and the purebred V animals; the farm 3 raised females of the groups VV and HH, and the farm 4 housed VV, AA and LL animals. The line V was present in all the farms to connect data between farms and to be used as a reference line. The number of parities in every genetic group was 2293 for AA, 1272 for AL, 1110 for AH, 1304 for AV, 963 for HA, 4610 for HH, 1418 for HL, 1332 for HV, 1114 for LA, 1252 for LH, 2772 for LL, 1482 for LV, 1250 for VA, 1124 for VH, 1078 for VL and 10 172 for VV.
Animal management slightly differed across farms. In farms 1 and 2 does were grouped into a single batch mated every 42 days, while in farms 3 and 4 does were grouped into six batches and weekly natural mating was practised. In all farms, the first mating was around 18 weeks of age for males and females. Natural mating was used in farms 3 and 4 while artificial insemination was conducted in farms 1 and 2 by using semen from a paternal line (10 to 20×106 spermatozoa/dose) with a prior injection of gonadotropin (20 UI) to induce the ovulation. The does were served 10 to 12 days post-kindling and a pregnancy test was carried out by abdominal palpation on day 12 after mating. Litters were reared by their dams during 28 days and no fostering was practised. Does were fed ad libitum on a standard commercial pellet diet and they were under a constant photoperiod of 16 : 8 h.
Traits and statistical analyses
The considered prolificacy traits were: total born (TB), number born alive (NBA) and litter size at weaning (NW, 28 days). In addition, a fertility trait was studied, which was defined by the kindling interval (number of days between two consecutives parities, KI).
All the prolificacy traits were analysed using the following univariate mixed model:
 $$Y_{{ijkl}} \,{\equals}\, GFYS_{i} {\plus}PS_{j} {\plus}a_{k} {\plus}p_{k} {\plus}e_{{ijkl}} $$
where Y ijkl is the record lth of the trait being analysed (TB, BA or NBA), corresponding to the kth doe which was in the physiological status jth and belongs to the genetic group-farm-year-season combination ith; GFYS i the fixed effect of the genetic group-farm-year-season combination (1 year season every 3 months: 317 levels); PS j the fixed effect of the doe physiological state (five levels depending on the parity order and lactation state at mating, where one is for nulliparous does, two (four) for primiparous lactating (non-lactating) and three (five) for multiparous lactating (non-lactating)); a k the random additive effect of the doe to which the observation corresponds (for k=1, …, 7111); p k the random permanent environmental plus non-additive genetic effects of the doe; and e ijkl the random residual of the model.
The analysis of KI was carried out by using the following univariate model:
 $$Y_{{ijkl}} \,{\equals}\,GFYS_{i} {\plus}PO_{j} {\plus}a_{k} {\plus}p_{k} {\plus}e_{{ijkl}} $$
where Y ijkl is the lth record corresponding to the kth doe which was in parity order jth and belongs to the genetic group-farm-year-season combination ith, PO j the parity order and the other components of the model were defined as in model 1.
In a previous step, the variance components for the models were estimated by REML, running the remlf90 program (Misztal et al., Reference Misztal, Tsuruta, Strabel, Auvray, Druet and Lee2002), using purebred and crossbred data. With these variance components assumed to be known generalised least square solutions of group-farm-year-season effects and of their error (co)variance matrix were obtained using blupf90 program (Misztal et al., Reference Misztal, Tsuruta, Strabel, Auvray, Druet and Lee2002). The obtained solutions were the differences between all the different genetic groups and the VV group and their error (co)variance matrix. Finally, from these solutions, the differences between direct and maternal genetic effects of the lines as well as the individual heterosis were estimated by generalised least squares according to the Dickerson’s model (Dickerson, Reference Dickerson1969). χ 2 tests, assuming as true the provided residual variances, were conducted, setting the type I error at 0.05.
Results and discussion
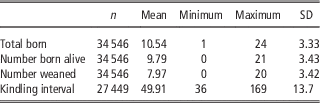
Table 1 shows raw means and standard deviations for the traits measured in this study. Notice the high prolificacy showed by all the genetic groups. The values of TB, NBA and NW traits are in agreement or they are slightly higher than values previously reported by other authors in rabbit maternal lines (García and Baselga, Reference García and Baselga2002a and 2002Reference García and Baselgab; Costa et al., Reference Costa, Baselga, Lobera, Cervera and Pascual2004; Theilgaard et al., Reference Theilgaard, Sánchez, Pascual, Berg, Friggens and Baselga2007; Al-Saef et al., Reference Al-Saef, Khalil, Al-Homidan, Al-Dobaib, Al-Sobayil, García and Baselga2008; Sánchez et al., Reference Sánchez, Theilgaard, Mínguez and Baselga2008; Ragab and Baselga, Reference Ragab and Baselga2011).
Descriptive statistics of prolificacy traits (rabbits/litter) and kindling interval (days) in rabbit maternal lines

n=number of records.
The heritability estimates were rather low and tended to decrease from birth to weaning. The estimated heritability (repeatability in brackets) was 0.07 (0.18), 0.06 (0.18), 0.03 (0.12) and 0.03 (0.08) for TB, NBA, NW and KI, respectively. Heritability estimates are not the objective of our study, thus we will not further discuss them, however, it must be noted that we deal with purebred and crossbred animals, and these estimated heritabilities must be understood as a balance of the additive gene effects in different genetic frameworks, such as the genetic groups considered in this work.
The differences between the performances of the genetic groups corresponding to the purebred does can be observed in Table 2. These contrasts involve direct and maternal genetic effects. We did not find significant differences between the lines for all the litter size traits, but significant differences were found for KI. The LP line had the shortest KI, whereas the largest KI were observed in A and V lines. Differences of around 5.4 days (10.82% of the mean) were observed between these two lines and the LP line. The KI differences of A and V with respect to H animals were around 3 days (6.01%).
Contrasts (SE) between the genetic groups of rabbit lines for litter size traits (rabbits/litter) and kindling interval (days)

TB=total born; NBA=number born alive; NW=number weaned; KI=kindling interval.
1 Line of buck×line of doe; A=A line; L=LP line; H=H line; V=V line.
*Significant difference at α=0.05.
It seems that lines show similar performances in prolificacy traits. This could be understood as consequence of a successful selection process for litter size at weaning, particularly for the A line. Ragab and Baselga (Reference Ragab and Baselga2011) contrasted the value of the four lines at the time of their foundation for litter size at the line A showed the lowest values. However, this line has the longest selection process, similar to that for the V line, however, the responses per generation could be higher for line A than for line V (García and Baselga, Reference García and Baselga2002a and 2002b). The consequence is that the current differences between the lines are not significant. The lack of differences between lines agree with previous results reported by Ragab and Baselga (Reference Ragab and Baselga2011) and Ragab et al. (Reference Ragab, Sánchez and Baselga2014) that compared the lines at times near to the time of realisation of this experiment. However, in previous comparisons line V was superior to line A (Baselga et al., Reference Baselga2003; Orengo et al., Reference Orengo, Gómez, Piles, Ramón and Rafel2003), but the last author did not find significant differences between line H and lines V and A. Sánchez et al. (Reference Sánchez, Theilgaard, Mínguez and Baselga2008) also found low probabilities, around 0.20, of the contrasts between LP and V lines for TB, NBA and NW to be >0. All these results point to a recent reduction of the differences between lines as consequences of the selection process.
Regarding the superiority of the line LP over the other lines in kindling interval, the foundation criteria followed in this line could explain this result. The LP line was founded by selecting females from commercial farms that showed an extremely long productive life and a prolificacy higher than the mean (Sánchez et al., Reference Sánchez, Theilgaard, Mínguez and Baselga2008). When LP line has been compared with other lines the results have shown its superiority in life span, and a higher robustness when they have been submitted to environmental challenges (Theilgaard et al., Reference Theilgaard, Sánchez, Pascual, Berg, Friggens and Baselga2007; Sánchez et al., Reference Sánchez, Theilgaard, Mínguez and Baselga2008; Savietto et al., Reference Savietto, Cervera, Blas, Baselga, Larsen, Friggens and Pascual2013). The lower kindling interval could be related to the higher robustness to cope with environmental difficulties.
In general, favourable and important differences for all traits were found between crossbred does and V line (Table 3), which is the most widely used line to produce crossbred does in Spain and many countries (Garreau et al., Reference Garreau, Piles, Larzul, Baselga and de Rochambeau2004). These differences were found to be positive and significant for TB (AH, HV and LH), for NBA (AH, HV, AV and LH) and for NW (AH, AL, AV, LH and LV). The magnitude of the differences was particularly important for the case of NW, which is the selection criterion of these lines. This trait has a genetic determinism close to the one of litter size at marketing and reflects, indirectly, the milk yield and maternal ability of the does (Ragab and Baselga, Reference Ragab and Baselga2011). The magnitude of the differences for NW between the different crosses and VV animals ranged between 6.14% and 13.30% of the mean of the trait. Regarding KI, most crosses had significantly shorter KI than V line and the differences were important. The differences between the average of all crossbred groups and the V line were significant and favourable to crossbred groups for all traits, indicating the importance of using crossbred does in place of purebred animals to improve reproductive performance.
Contrasts (SE) between rabbit crossbred groupsFootnote 1 and V line for litter size traits (rabbits/litter) and kindling interval (days)

TB=total born; BA=number born alive; NW=number weaned; KI=kindling interval.
1 One cross and its reciprocal are considered together.
2 Line of buck×line of doe, and the reciprocal cross; A=A line; L=LP line; H=H line; V=V line; All-VV=the contrast between all crossbred and V line.
*Significant difference at α=0.05.
An indicator of the relevance of using a particular line either as sire or dam is got by checking the contrast between a particular cross and it’s reciprocal. Reciprocal effects reflect differences in gene frequencies between two lines in the presence of additive maternal and dominance maternal effects (Eisen et al., Reference Eisen, Hörstgen-Schwark, Saxton and Bandy1983). Regarding litter size traits, no reciprocal effects were found (Table 4) between all genetic groups. However, for the case of KI, some important differences between reciprocal crosses were observed. This was the case for the crosses involving the lines A and LP, A and H, LP and V, and V and H. This indicates that the best performance could be achieved under a particular reciprocal cross, being that an indicator of maternal effects, as it will be discussed later.
Contrasts (SE) between rabbit reciprocal crossesFootnote 1 for litter size traits (rabbits/litter) and kindling interval (days)

TB=total born; BA=number born alive; NW=number weaned; KI=kindling interval.
1 Line of buck×line of doe; A=A line; L=LP line; H=H line; V=V line.
*Significant difference at α=0.05.
Tables 5 and 6 show, respectively, direct and maternal genetic effects. In general, similar pattern were found for both sort of effects for litter size traits. The only significant difference was observed between LP and V lines for NBA with regard to direct genetic effect, favouring the LP line. The general absence of differences is an indicator of the similarity between lines with regard to direct genetic effects and maternal genetic abilities. As a general comment it can be indicated that the differences between maternal genetic effects were lower in magnitude compared with those between direct genetic effects. Eisen et al. (Reference Eisen, Hörstgen-Schwark, Saxton and Bandy1983) discussed two possible explanations for this: (i) maternal genetic effects on litter size may be small compared with direct genetic effects; (ii), the covariance between direct and maternal genetic effects for litter size may not be large enough to shift gene frequencies at loci primarily affecting maternal performance.
Contrast (SE) for direct genetic effects on prolificacy traits (rabbits/litter) and kindling interval (days) for the rabbit lines studied

TB=total born; BA=number born alive; NW=number weaned; KI=kindling interval.
1 Line of buck×line of doe; A=A line; L=LP line; H=H line; V=V line.
*Significant difference at α=0.05.
Contrast (SE) for maternal genetic effects on prolificacy traits (rabbits/litter) and kindling interval (days) for the rabbit lines studied

TB=total born; BA=number born alive; NW=number weaned; KI=kindling interval.
1 Line of buck×line of doe; A=A line; L=LP line; H=H line; V=V line.
*Significant difference at α=0.05.
It appears that foundation and/or selection within each of the four lines has had effects determining gene frequency at loci having direct and maternal genetic effects on KI. Therefore, the differences between lines for direct genetic effects on KI were significant and favouring LP, H and V lines with respect to the A line. While the contrary was observed for maternal effects in favour of A line respect to H, V and LP lines, whereas the differences between LP and V lines for both direct and maternal effects always favoured LP line. Baselga et al. (Reference Baselga2003) found significant higher differences on direct genetic effects for V line on TB, NBA and KI with respect to A line, but non-significant differences were found in the contrasts regarding direct genetic effect involving the H line. These authors did not find any significant difference regarding maternal genetic effects. In other work involving A and V lines, it was found that V line showed a significantly higher direct effect than A line for TB and NBA but not for NW and KI (Orengo et al., Reference Orengo, Gómez, Piles, Ramón and Rafel2003).
The results (Table 7) showed important individual heterosis for litter size traits but the magnitude of this parameter was largely variable. These favourable effects on litter size traits indicate the importance of the use of crossbreeding to take advantage of the heterotic effects on these traits. The largest positive heterosis for TB was found for the cross between H and V lines (~10% of the mean TB) followed by those between A and H (~7%), A and V (~5%) and between lines LP and H (~5%). Regarding NBA, the crosses between H and V; and A and V were those showing the strongest heterosis. Finally for NW the crosses involving A and V (~9%), LP and H (~7%) and LP and V (~5%) were the only ones showing significant effects. The magnitudes of the heterosis seem to be relevant for all traits, particularly for NW, which has a high economic weight and is genetically close to litter size at marketing ages. AV and LV groups had favourable and significant direct heterosis for KI, but on the contrary AL and LH shown unfavourable heterotic effects, that is larger KI than their parental lines.
Estimates (SE) of the heterosis for crossbred genetic groupsFootnote 1 on prolificacy traits (rabbits/litter) and kindling interval (days) for the rabbit lines studied

TB=total born; NBA=number born alive; NW=number weaned; KI=kindling interval.
1 Line of buck×line of doe, and the reciprocal cross; A=A line; L=LP line; H=H line; V=V line.
*Significant difference at α=0.05.
Only two other crossbreeding experiments have been carried out involving some of the lines presented in this study. Orengo et al. (Reference Orengo, Gómez, Piles, Ramón and Rafel2003) found that heterosis effects were not significantly different from 0 between A and V lines for TB, NBA, NW and KI. On the contrary, Baselga et al. (Reference Baselga2003) found significant heterosis between the same lines for TB (0.48) and NBA (0.55) but this effect was not significant for KI (−1.59). Other authors found positive and important direct heterosis in different crosses, some of them involving the V line: V×A2066 (Brun and Baselga, Reference Brun and Saleil2005), V×Baladi Red (Youssef et al., Reference Youssef, Iraqi, El-Raffa, Afifi, Khalil, García and Baselga2008), Egyptian Gabali×NZW (Khalil and Afifi, Reference Khalil, Afifi, Youssef and Khadr2000), NZW×CAL (Nofal et al., Reference Nofal, Tõth and Virág1996) and A1077×A2066 (Brun and Saleil, Reference Brun and Baselga1994).
Based on a dominance model, lines having a high degree of heterosis generally would have genes diverging in opposite directions relative to the mean gene frequency. Hence, AV showed significant heterosis for litter size traits that could be due to the large selection history of the two lines favouring differences in gene frequencies by the selection itself and by genetic drift (Horstgen-Schwark et al., Reference Horstgen-Schwark, Eisen, Saxton and Bandy1984). Moreover, García and Baselga (Reference García and Baselga2002a and 2002b) showed that the improvement achieved in litter size was mainly due to an improvement of the ovulation rate in line V, and to an improvement of foetal survival in line A. These differences could cause differences in gene frequencies between both lines and, consequently favour heterosis between them. The same explanation can be given for the large heterosis values presented by the LH group, because the lines H and LP were founded applying high intensities of selection but on different traits (number born alive in line H and longevity in line LP) that could produce differences in gene frequencies affecting litter size and kindling interval.
A final question of practical interest is to analyse if there are some crosses that could be specially recommended for commercial production. To discuss this question it is necessary to take into account that in our study no fostering of kit has been carried out between the does after kindling, but this practice is common among the farmers to reduce the losses during the lactation. In general, the crosses with participation of line H are the ones with the best reproductive performances, being the best one that between H an LP line, especially for litter size at weaning, which is an important trait due to its closed genetic correlation with litter size at marketing (Ragab and Baselga, Reference Ragab and Baselga2011, 0.96). The cross between H and V shown the largest ovulation rate (Ragab et al., Reference Ragab, Sánchez and Baselga2014), total born and number born alive, but a modest performance on NW. Under a management based on cross-fostering (common practice in commercial farms) this NW performance would be expected to be improved, thus this cross could be also highly recommended. The most widely used cross in Spain is that between A and V lines (Baselga et al., Reference Baselga2003); this cross did not show important differences for total born with respect to V line, whereas it had a great number of born alive and weaned kits, which reflects its high maternal capacity.
Conclusions
The four maternal lines showed similar reproductive levels. A and V lines showed the largest KI. Important differences between performances in reproductive traits have been observed in simple crosses of these maternal lines. The differences between crosses, principally, due to the direct heterosis effects of the crosses. The AV and LH were the best crosses due to the achieved individual heterosis for litter size at weaning. The cross HV is particularly relevant by its high individual heterosis in total number born and number born alive. Its value is expected to be increased when cross-fostering, common in commercial farms, is practised to equalise litter sizes after birth. Favourable and significant heterosis for KI was found in AV and LV crosses, whereas it was unfavourable in AL and in LH.
Acknowledgement
This work was supported by the Spanish project AGL2011-30170- C02-01 from the Spanish National Research Plan.