I. INTRODUCTION
PDF-4+ 2023 lists 23 star-quality data sets of α-Al2O3 (corundum), where 21 sets (00-046-1212, 01-070-5679, 01-070-7346, 01-071-1683, 01-075-1862, 01-075-1863, 01-075-6775, 01-082-1399, 01-088-0826, 01-089-7715, 04-004-2852, 04-004-5434, 04-005-4213, 04-005-4505, 04-007-1400, 04-007-4873, 04-015-8608, 04-015-8993, 04-015-8994, 04-015-8995, and 04-015-8996) assign the strongest peak to 104-reflection, and 2 sets (01-089-7716 and 01-089-7717) assign the strongest peak to 113-reflection and the second strongest to 104-reflection in the hexagonal setting for the rhombohedral system. In contrast, it is certified that 113-reflection is the strongest, 116-reflection is the second strongest, and 104-reflection is the third strongest for NIST SRM676a standard α-Al2O3 powder (Kaiser and Watters, Reference Kaiser and Watters2008), while 104-reflection is the strongest for NIST SRM1976c standard α-Al2O3 sintered disk (Holbrook and Choquette, Reference Holbrook and Choquette2021). It is likely that high-temperature sintering of uniaxially pressed powder promotes preferred orientation due to Ostwald ripening (e.g. Ostwald, Reference Ostwald1897).
Hubbard et al. (Reference Hubbard, Evans and Smith1976) have suggested that 116-reflection is expected to be the strongest for the neutral atom model  ${\rm Al}_2^0 \;{\rm O}_3^0$, and 113-reflection should be the strongest for the fully ionized model
 ${\rm Al}_2^{3 + } {\rm O}_3^{2-}$. One may consider that the assumption of the hypothetical O2– should be odd, because it is obvious that O2– cannot stably exist in an isolated state and in an electrostatically neutral space. However, it has also been suggested that the assumption of O2– in solid state can be a useful working hypothesis for the description of electron density and X-ray diffraction data of some crystalline oxides (e.g. Suzuki, Reference Suzuki1960; Tokonami, Reference Tokonami1965). The author would like to add a note that an anion in a crystal is not in an electrostatically neutral space.
If a crystallite of corundum tends to have a platy shape parallel to (001)-face, the reflection from 104-plane with the angle of declination 38.2° from (001)-plane will be more emphasized than that from 113-plane with the angle of declination 61.2°, in a typical geometry for a powder X-ray diffraction measurement system. However, it has been reported that (012)-face tends to be developed on crystal growth by Czochralski method (e.g. Sun and Xue, Reference Sun and Xue2014).
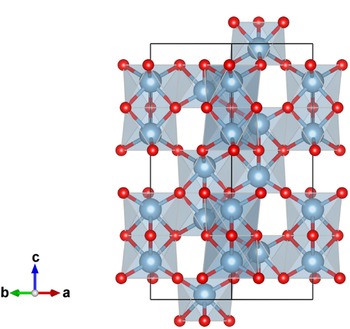
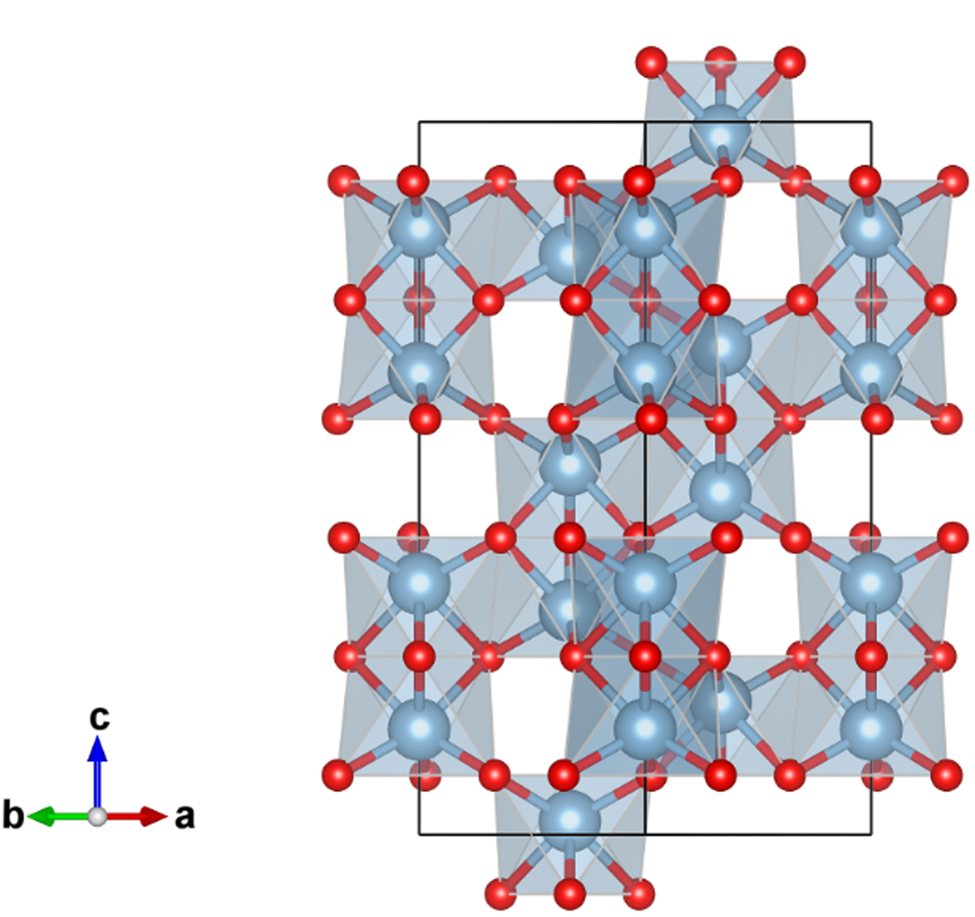
A credible crystal structure model of α-Al2O3 has been derived by single-crystal X-ray diffraction measurements (Maslen et al., Reference Maslen, Streltsov, Streltsova, Ishizawa and Satow1993). The lattice constants are estimated at a = 4.759 Å and c = 12.993 Å in the hexagonal setting of  $R\bar{3}c$ (space group No. 167). The structure parameters are listed in Table I, and a projection along [110] direction is shown in Figure 1. The corundum structure can be recognized as follows: 2/3 of 6-coordinate octahedron sites are occupied by Al atoms in the O atoms arranged in a hexagonal close packing (hcp) manner. As can be seen in Figure 1, two neighbor Al atoms in a couple of face-sharing octahedrons appear to be avoiding each other, probably because of electrostatic repulsive interaction between positively charged Al ions. The axial ratio c/a = 2.73 is significantly higher than the value of
 $c/a = \sqrt 6 \approx 2.45$ for the ideal hcp arrangement of O atoms.
Projection along the [110] direction in hexagonal setting of the crystal structure of α-Al2O3, drawn with VESTA3 (Momma and Izumi, Reference Momma and Izumi2011). Locations of oxygen atoms are represented by small red spheres, and aluminum atoms by larger blue-gray spheres.
Fractional coordinates and anisotropic displacement parameters for α-Al2O3, reported by Maslen et al. (Reference Maslen, Streltsov, Streltsova, Ishizawa and Satow1993).

Maslen et al. (Reference Maslen, Streltsov, Streltsova, Ishizawa and Satow1993) have described the morphology of two crystals 1 and 2 used in their experiments. It has been reported that the crystals were distorted octahedra exhibiting two {021}, two  ${ {0\bar{1}1} }$, two
 ${ {\bar{1}11} }$, and two {101} faces for crystal 1, and two {003}, two
 ${ {0\bar{1}1} }$, two
 ${ {\bar{1}11} }$, and two {101} faces for crystal 2, with dimensions, respectively, 20 × 38 × 38 × 38 μm for crystal 1 and 20 × 44 × 44 × 44 μm for crystal 2. It would be difficult to expect preferred orientation along the (001)-direction, if a crystallite of corundum tends to have similar morphology in a powder sample.
The values of anisotropic mean squared displacement parameters U ij in Table I suggest that a common isotropic displacement parameter B iso = 0.22 Å2 ⇔ U iso = 0.0028 Å2 can be assumed for both Al and O atoms in α-Al2O3, which will simplify the treatment of the effects of atomic displacement on calculation of powder diffraction intensities from electron density data obtained by density functional theory (DFT) calculation, as will be discussed later.
II. CALCULATION
A. Preferred orientation
It is assumed that the diffraction intensities  $I_{hkl}^{( {HKL} ) }$ of NIST SRM1976c data, are affected by the preferred orientation along (HKL) = (001) or (012) direction of crystallites, while the intensities certified for SRM676a,
 $I_{hkl}^{( {676{\rm a}} ) }$, can be regarded as those of randomly oriented crystalline powder. The following formulas of preferred orientation based on the March-Dollase model (Dollase, Reference Dollase1986) are applied.
 $$I_{hkl}^{( {HKL} ) } = f\;I_{hkl}^{( {676{\rm a}} ) } m_{hkl}^{( {HKL} ) } /m_{hkl}, \;$$
 $$m_{hkl}^{( {HKL} ) } = \mathop \sum \limits_{i = 1}^{m_{hkl}} P( {\alpha_{h_ik_il_i}^{( {HKL} ) } , \;r} ) , \;$$
 $$P( {\alpha , \;r} ) = ( {r^2{\cos }^2\alpha + r^{{-}1}{\rm si}{\rm n}^2\alpha } ) ^{{-}3/2}, \;$$
where f is a scaling parameter, m hkl is the multiplicity of reflection,  $m_{hkl}^{( {HKL} ) }$ is the effective multiplicity affected by preferred orientation along the (HKL)-direction, r is the March coefficient, and
 $\alpha _{hkl}^{( {HKL} ) }$ is the declination angle of hkl-plane from (HKL)-plane.
Levenberg-Marquardt least-squares optimization algorithm (Marquardt, Reference Marquardt1963) based on the model defined by Eqs (1)–(3), with (001) or (012)-preferred orientation has been applied on SRM1976c intensities against SRM676a intensities. The scale parameter f and March coefficient r are treated as adjustable parameters. Table II lists index hkl of significant powder diffraction peaks of corundum, multiplicity of reflection m hkl, indices of equivalent reflections {h ik il i}, declination angles of hkl-plane from (001)-plane,  $\alpha _{hkl}^{( {001} ) }$, and from (012)-plane,
 $\alpha _{h_ik_il_i}^{( {012} ) }$.
Index of significant reflection hkl, multiplicity m hkl, indices of equivalent reflections {h ik il i}, declination angles of diffraction plane from (001)-plane  $\alpha _{hkl}^{( {001} ) } , \;\;$ and from (012)-plane
 $\alpha _{h_ik_il_i}^{( {012} ) }$ for α-Al2O3.

Indices of Bijvoet (Friedel) counter parts  $\bar{h}\bar{k}\bar{l}$ are omitted in the lists for equivalent reflections.
Table III lists diffraction intensities certified for NIST SRM676a and SRM1976c, and intensities calculated by the March-Dollase model for SRM1976c optimized at the values f = 4.00 and r = 0.167 for (001)-preferred orientation, and the values f = 0.669 and r = 1.06 for (012)-preferred orientation. The intensities certified for SRM1976c can be simulated by the March-Dollase model for (001)-preferred orientation within acceptable deviations, but not for (012)-preferred orientation.
Index of reflection hkl, certified intensities of SRM676a and SRM1976c, simulated intensities optimized for SRM1976c at the values f = 4.00 and r = 0.167 for (001)-preferred orientation, and simulated intensities optimized at the values f = 0.669 and r = 1.06 for (012)-preferred orientation.

B. Conventional structure factor and electron density
The powder diffraction intensity I hkl for hkl-reflection with the multiplicity m hkl is calculated by the following equation:
 $$I_{hkl} = C( {2\theta_{hkl}} ) \vert {F_{hkl}} \vert ^2m_{hkl}, \;$$
where C(2θ) is the geometric correction factor given by
 $$C( {2\theta } ) = ( {1 + {\cos }^22\theta } ) \csc 2\theta \csc \theta , \;$$
for the diffraction angle 2θ in a typical powder diffraction measurement system. The crystal structure factor F hkl in Eq. (4) is given by
 $$F_{hkl} = \mathop \sum \limits_{\,j = 1}^m f_{X_j}( {d_{hkl}^\ast , \;\lambda } ) \;T_j( {{\bf d}_{hkl}^\ast } ) \exp [ {2\pi {\rm i}( {hx_j + ky_j + lz_j} ) } ] , $$
 $${\bf d}_{hkl}^\ast{ = } h{\bf a}^\ast{ + } k{\bf b}^\ast{ + } l{\bf c}^\ast , $$
for the reciprocal lattice vectors  ${\bf a}^\ast$,
 ${\bf b}^\ast$, and
 ${\bf c}^\ast$. The fractional coordinate of the mean location of the j-th atom in the unit cell is represented by (x j, y j, z j). The atomic scattering factor of an atom X for the X-ray with the wavelength of λ is represented by f X(d*, λ). The atomic displacement factor for the j-th atom is represented by
 $\;T_j( {{\bf d}_{hkl}^\ast } )$.
The atomic scattering factor f X(d*, λ) is conventionally expressed by
 $$f_X( {d^\ast , \;\lambda } ) = f_X^{( 0 ) } ( {d^\ast } ) + {\,f}^{\prime}_X( \lambda ) + {\rm i}\;{\,f}^{\prime \prime}_X( \lambda ) , $$
where  $f_X^{( 0 ) } ( {d^\ast } )$ may be called the atomic form factor, which is identical to the three-dimensional Fourier transform of electron density ρ X(r) for the atom X. The dispersion correction terms are represented by
 ${f}^{\prime}_X( \lambda ) + {\rm i}\;{f}^{\prime \prime}_X( \lambda ) \;$in Eq. (8), and
 ${f}^{\prime}_{{\rm Al}} = 0.213$,
 ${f}^{\prime \prime}_{{\rm Al}} = 0.246$,
 ${f}^{\prime}_{\rm O} = 0.049$, and
 ${f}^{\prime \prime}_{\rm O} = 0.033$ are assumed for Cu Kα X-ray (λ = 1.541Å) (Creagh, Reference Creagh1999). The atomic form factor
 $f_X^{( 0 ) } ( {d^\ast } )$ is approximated by
 $$f_X^{( 0 ) } ( {d^\ast } ) = \mathop \sum \limits_{i = 1}^n a_{i, {\rm X}}\exp \left({-\displaystyle{{b_{i, {\rm X}}d^{{\ast} 2}} \over 4}} \right) + c_{\rm X}\;, \;$$
which is equivalent with that the electron density of the X atom, ρ X(r), is assumed to be
 $$\rho _X( r ) = \mathop \sum \limits_{i = 1}^n \displaystyle{{8\pi ^{3/2}a_{i, X}} \over {b_{i, X}^{3/2} }}\exp \left({-\displaystyle{{4\pi^2r^2} \over {b_{i, X}}}} \right) + c_X\;\delta ^3( r ) , \;$$
where δ 3(r) = δ(x)δ(y)δ(z) is the three-dimensional Dirac delta function. The values of parameters {a i,X, b i,X, c X} for X = Al, Al3+, O, and O− are listed in the tables given by Waasmaier and Kirfel (Reference Waasmaier and Kirfel1995). The atomic form factors  $f_{{\rm A}{\rm l}^{1.5 + }}^{( 0 ) } ( {d^\ast } )$ and
 $f_{{\rm O}^{2-}}^{( 0 ) } ( {d^\ast } )$, for intermediately ionized aluminum Al1.5+ and hypothetical divalent oxygen O2– are derived by interpolation and extrapolation about the values of
 $f_{{\rm A}{\rm l}^{3 + }}^{( 0 ) } ( {d^\ast } )$,
 $f_{{\rm Al}}^{( 0 ) } ( {d^\ast } )$,
 $f_{{\rm O}^-}^{( 0 ) } ( {d^\ast } )$, and
 $f_{\rm O}^{( 0 ) } ( {d^\ast } )$ in this study, that is,
 $$f_{{\rm A}{\rm l}^{1.5 + }}^{( 0 ) } ( {d^\ast } ) = 0.5f_{{\rm A}{\rm l}^{3 + }}^{( 0 ) } ( {d^\ast } ) + 0.5f_{{\rm Al}}^{( 0 ) } ( {d^\ast } ) \;, \;$$
 $$f_{{\rm O}^{2-}}^{( 0 ) } ( {d^\ast } ) = 2f_{{\rm O}^-}^{( 0 ) } ( {d^\ast } ) -f_{\rm O}^{( 0 ) } ( {d^\ast } ) \;.$$
A common isotropic atomic displacement parameter B iso = 0.22 Å2 for Al and O is assumed. Atomic displacement factor  $T_j( {{\bf d}^\ast } )$ in Eq. (6) can then be rewritten as
 $$\;T_j( {{\bf d}^\ast } ) = T( {d^\ast } ) = \exp \left({-\displaystyle{{B_{{\rm iso}}d^{{\ast} 2}} \over 4}} \right).$$
The three-dimensional voxel electron density  ${ {\rho_{i_ai_bi_c}} }$ of a crystal is calculated by summation of the atomic electron density ρ X(r), as follows:
 $$\rho _{i_ai_bi_c} = \mathop \sum \limits_{\xi = {-}\xi _{{\rm max}}}^{\xi _{{\rm max}}} \mathop \sum \limits_{\eta = {-}\eta _{{\rm max}}}^{\eta _{{\rm max}}} \mathop \sum \limits_{\zeta = {-}\zeta _{{\rm max}}}^{\zeta _{{\rm max}}} \mathop \sum \limits_{\,j = 1}^m \rho _{X_j}( {\vert {{\bf r}_{i_ai_bi_c}-{\bf R}_j-{\bf l}_{\xi \eta \zeta }} \vert } ), $$
 $${\bf r}_{i_ai_bi_c} = \displaystyle{{i_a{\bf a}} \over {n_a}} + \displaystyle{{i_b{\bf b}} \over {n_b}} + \displaystyle{{i_c{\bf c}} \over {n_c}}, $$
 $${\bf R}_j = x_j{\bf a} + y_j{\bf b} + z_j{\bf c}, $$
 $${\bf l}_{\xi \eta \zeta } = \xi {\bf a} + \eta {\bf b} + \zeta {\bf c}, $$
where ξ max = η max = ζ max = 1 (3 × 3 × 3 super-cell) in the rhombohedral setting is practically sufficient for calculation of electron density in the center unit cell in the super-cell. Three-dimensional 60 × 60 × 60-mesh (n a = n b = n c = 60) voxel electron density maps in the rhombohedral setting of  $R\bar{3}c$, with the lattice constants of a = 5.1290 Å and
 $\alpha = 55.286^\circ$, have been created by applying Eq. (14) for the neutral atom model
 ${\rm Al}_2^0 {\rm O}_3^0$, intermediately ionized model
 ${\rm Al}_2^{1.5 + } {\rm O}_3^-$, and the fully ionized model
 ${\rm Al}_2^{3 + } {\rm O}_3^{2-}$. The constant terms c Al = 0.140,
 $c_{{\rm A}{\rm l}^{1.5 + }} = 0.080$,
 $c_{{\rm A}{\rm l}^{3 + }} = 0.019$, c O = 0.027,
 $c_{{\rm O}^-} = 0.046$, and
 $c_{{\rm O}^{2-}} = 0.065$ are separately added to the voxel value
 $\rho _{i_ai_bi_c}$ nearest to the atomic position on the simulation of electron density calculated from the atomic form parameters {a i,X, b i,X}.
The crystal structure factor F hkl is also calculated from the voxel electron density  ${ {\rho_{i_ai_bi_c}} }$ by the following formulas to test the validity of applying 60 × 60 × 60 voxel density maps and the assumption of the common isotropic atomic displacement B iso = 0.22 Å2. The same assumptions will be applied on calculation of X-ray diffraction intensities from electron density data obtained by DFT calculation.

where  $F_{hkl}^{( 0 ) }$ is the three-dimensional Fourier transform of electron density expressed by
 $$F_{hkl}^{( 0 ) } = \displaystyle{{V_{{\rm cell}}} \over {n_an_bn_c}}\mathop \sum \limits_{i_a = 0}^{n_a-1} \mathop \sum \limits_{i_b = 0}^{n_b-1} \mathop \sum \limits_{i_c = 0}^{n_c-1} \rho _{i_ai_bi_c}\exp \left[{2\pi {\rm i}\left({\displaystyle{{hi_a} \over {n_a}} + \displaystyle{{ki_b} \over {n_b}} + \displaystyle{{li_c} \over {n_c}}} \right)} \right].$$
It should be noted that it would be difficult to derive the formula for evaluation of XRD intensities from electron density, if the common atomic displacement factor  $T( {d_{hkl}^\ast } )$ cannot be assumed. The effects of atomic displacement may be simulated by molecular dynamics (MD) calculation based on DFT, but the use of a large super-cell will be required for MD calculation.
C. DFT calculation
Electron density of α-Al2O3 is calculated by a DFT method (Hohenberg and Kohn, Reference Hohenberg and Kohn1964) with Quantum ESPRESSO 7.1 (Giannozzi et al., Reference Giannozzi, Baroni, Bonini, Calandra, Car, Cavazzoni, Ceresoli, Chiarotti, Cococcioni, Dabo, Dal Corso, de Gironcoli, Fabris, Fratesi, Gebauer, Gerstmann, Gougoussis, Kokalj, Lazzeri, Martin-Samos, Marzari, Mauri, Mazzarello, Paolini, Pasquarello, Paulatto, Sbraccia, Scandolo, Sclauzero, Seitsonen, Smogunov, Umari and Wentzcovitch2009, Reference Giannozzi, Andreussi, Brumme, Bunau, Buongiorno Nardelli, Calandra, Car, Cavazzoni, Ceresoli, Cococcioni, Colonna, Carnimeo, Dal Corso, de Gironcoli, Delugas, DiStasio, Ferretti, Floris, Fratesi, Fugallo, Gebauer, Gerstmann, Giustino, Gorni, Jia, Kawamura, Ko, Kokalj, Küçükbenli, Lazzeri, Marsili, Marzari, Mauri, Nguyen, Nguyen, Otero-de-la-Roza, Paulatto, Poncé, Rocca, Sabatini, Santra, Schlipf, Seitsonen, Smogunov, Timrov, Thonhauser, Umari, Vast, Wu and Baroni2017) Projector augmented wave (PAW; Kresse and Joubert, Reference Kresse and Joubert1999) is used as the pseudopotential (PP). Local density approximation (LDA; Perdew and Zunger, Reference Perdew and Zunger1981) and a kind of generalized gradient approximations (GGA), Perdew-Burke-Ernzerhof (PBE) exchange-correlation functional (Perdew et al., Reference Perdew, Burke and Ernzerhof1996, Reference Perdew, Burke and Ernzerhof1997) are tested. Scalar correction, which neglects spin-orbit interaction, is applied for relativistic correction. Electron density values are stored as 60 × 60 × 60 mesh (n a = n b = n c = 60) voxel data for the unit cell in the rhombohedral setting, which includes four Al and six O atoms.
The total number of electrons in the rhombohedral unit cell should be N cell = 100 for α-Al2O3. The number of electrons N cell is checked for voxel data  ${ {\rho_{i_ai_bi_c}} }$ by the following equation:
 $$N_{{\rm cell}} = \displaystyle{{V_{{\rm cell}}} \over {n_an_bn_c}}\mathop \sum \limits_{i_a = 0}^{n_a-1} \mathop \sum \limits_{i_b = 0}^{n_b-1} \mathop \sum \limits_{i_c = 0}^{n_c-1} \rho _{i_ai_bi_c}.$$
The values are estimated at N cell = 96.5 for the neutral atom model  ${\rm Al}_2^0 {\rm O}_3^0$, N cell = 96.5 for the fully ionized model
 ${\rm Al}_2^{3 + } {\rm O}_3^{2-}$, N cell = 96.0 for the PAW-LDA model, and N cell = 96.9 for the PAW-PBE model. Conventional and DFT electron density calculations similarly miss 3–4% electrons per atom, when 60 × 60 × 60-mesh is applied.
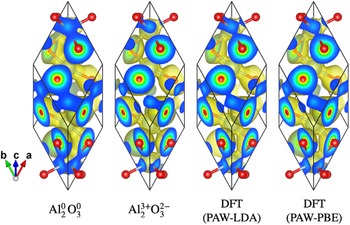
Projections of the electron density isosurfaces at the level of 0.3 e Å−3 ≈ 0.044 e Bohr−3 for the neutral atom model  ${\rm Al}_2^0 {\rm O}_3^0$, fully ionized model
 ${\rm Al}_2^{3 + } {\rm O}_3^{2-}$, DFT calculations with PAW-LDA and PAW-PBE models are shown in Figure 2. The isosurface between Al and O atoms is more constricted in the fully ionized model
 ${\rm Al}_2^{3 + } {\rm O}_3^{2-}$ than in the neutral model
 ${\rm Al}_2^0 {\rm O}_3^0$, and the results of PP-DFT calculations show intermediate constriction.
Projection along the [ $11\bar{2}$] direction in rhombohedral setting of the electron-density isosurface (painted with yellowish color) of α-Al2O3 at the level of 0.3 e Å−3 ≈ 0.044 e Bohr−3and color-scaled electron density (blue: low; red: high) on the faces of the rhombohedral unit cell, drawn with VESTA3 (Momma and Izumi, Reference Momma and Izumi2011). The locations of oxygen atoms are represented by small red spheres, and the locations of aluminum atoms are represented by spheres with larger diameters, connected by sticks with oxygen atoms.

Table IV lists the index of reflection hkl, intensities certified for NIST SRM676a, intensities expected for the neutral atom model  ${\rm Al}_2^0 \;{\rm O}_3^0$, intermediately ionized model
 ${\rm Al}_2^{1.5 + } \;{\rm O}_3^-$, and fully ionized model
 ${\rm Al}_2^{3 + } {\rm O}_3^{2-}$, and the results based on PP-DFT calculations (PAW-LDA and PAW-PBE). The intensities for the fully ionized model
 ${\rm Al}_2^{3 + } {\rm O}_3^{2-}$ are calculated by two methods: method (1): a conventional method, where the structure factor is given by Eq. (6), and method (2): calculation through the Fourier transform of 60 × 60 × 60 voxel electron density obtained by the inverse Fourier transform based on the atomic scattering parameters. The difference in the results calculated by the two methods (1) and (2) for
 ${\rm Al}_2^{3 + } {\rm O}_3^{2-}$, certainly show that the coarseness of the electron density maps slightly affect the calculated diffraction intensity, but the difference is not large enough to justify the poorer coincidence of the results of PP-DFT calculations with NIST SRM676a data than the fully ionized model
 ${\rm Al}_2^{3 + } {\rm O}_3^{2-}$. The results of PP-DFT calculations still expect that 113-reflection is the strongest, 116-reflection is the second strongest, and 104-reflection is the third strongest.
LAUE index hkl, powder diffraction intensities certified for NIST SRM676a, values for  ${\rm Al}_2^0 \;{\rm O}_3^0$, values for
 ${\rm Al}_2^{3 + } {\rm O}_3^{2-}$ (1) calculated by a conventional method and (2) calculated through 60 × 60 × 60 voxel electron density data, and values based on DFT calculations.

Differences from NIST SRM676a intensities are shown in parentheses. δ RMS, the root mean square difference from NIST SRM676a intensities are listed in the last row.
The root mean square difference values of diffraction intensities from NIST SRM676a data are 5.2% for the neutral model  ${\rm Al}_2^0 \;{\rm O}_3^0$, 3.9% for the intermediately ionized model
 ${\rm Al}_2^{1.5 + } \;{\rm O}_3^-$, 2.6% (method 1) and 2.5% (method 2) for the fully ionized model
 ${\rm Al}_2^{3 + } {\rm O}_3^{2-}$, 5.6% for PAW-LDA, and 4.4% for PAW-PBE models. Since the changes of the intensities calculated for
 ${\rm Al}_2^0 \;{\rm O}_3^0$,
 ${\rm Al}_2^{1.5 + } \;{\rm O}_3^-$, and
 ${\rm Al}_2^{3 + } {\rm O}_3^{2-}$ are almost monotonous, it is not expected that a partially ionized model
 ${\rm Al}_2^{3\delta + } {\rm O}_3^{2\delta -}$ might give better coincidence with NIST SRM676a data than the fully ionized model
 ${\rm Al}_2^{3 + } {\rm O}_3^{2-}$.
III. EXPERIMENTAL
A. Specimen
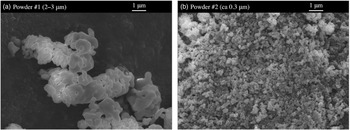
Two types of commercial α-Al2O3 powder #1 (High Purity Chemicals 99.99%, nominal particle size: 2–3 μm) and #2 (High Purity Chemicals, 99.99+%, nominal particle size: ca 0.3 μm) were used as samples for X-ray diffraction measurements. The SEM photographs of the powder #1 and #2 are shown in Figure 3.
SEM photographs of α-Al2O3, (a) powder #1 and (b) powder #2.

As can be seen in Figure 3, typical sizes of the primary particles are about 1 μm for powder #1 and about 0.1 μm for powder #2. The primary particles appear to be strongly adhered to other particles, forming secondary agglomerates, both in the powder #1 and #2. No significant rod-like or platy morphology of primary particles or agglomerates is detected.
Powder specimens for XRD measurements were prepared by filling powder #1 and #2 into glass sample holders. Powder #1 was used as obtained. Since it was difficult to prepare a homogeneously filled specimen of powder #2, sample powder #2 was wet-ground in agate mortar and pestle with ethanol for about 5 min, air-dried, and dry-ground for about 5 min, before loading the powder into a sample holder. It was expected that the secondary agglomerates of powder #2 would become somewhat granular after grinding process.
The average thickness of specimen #1 was t = 0.607 mm, bulk density ρ bulk = 0.934 g cm−3, filling factor ρ bulk/ρ calc = 0.234, and the penetration depth for Cu Kα X-ray was estimated at μ −1 = 0.337 mm. The values of thickness, bulk density, filling factor, and penetration depth for specimen #2 were t = 0.621 mm, ρ bulk = 1.581 g cm−3, ρ bulk/ρ calc = 0.397, and μ −1 = 0.190 mm. The specimen width along the equatorial direction was W = 20 mm.
B. Powder diffraction measurement
Powder diffraction data were collected with a Bragg–Brentano-type powder diffraction measurement system (Rigaku, MiniFlex 600-C) equipped with a silicon strip (1D) X-ray detector (Rigaku, D/teX Ultra-2). A copper-target X-ray tube (Canon Electronic Devices, A-21 Cu) was operated at 40 kV and 15 mA. The nominal focal width of the X-ray source was w X = 0.1 mm. A divergence slit (DS) with the open angle of ΦDS = 1.25° was used. A nickel foil with the nominal thickness of 0.023 mm was inserted into the diffracted X-ray beam path as a Cu Kβ attenuation filter. The radius of the goniometer was R = 150 mm. The open angle of the Soller slits (SS), defined by the arctangent of the distance to the length of the metal foils in the slits, was nominally ΦSS = 1.25°.
The interval of the silicon detector strip was w D = 0.1 mm, and the number of the detector strips was 128. The view angle of the detector was estimated at 2Ψ = 4.89°.
Continuous-scan integration data were collected for the goniometer angles ranging from 2Θ = 5° to 140° at the scan rate of 10°/min and the sampling interval of 0.01°. The room temperature was kept at  $23^\circ {\rm C} \pm 0.5^\circ {\rm C}$ during the X-ray diffraction measurements.
IV. DECONVOLUTIONAL TREATMENT AND INDIVIDUAL PEAK PROFILE FITTING
The observed powder diffraction data are deconvolutionally treated (DCT) by a method proposed by the author (Ida, Reference Ida2021a, Reference Ida2022). A quartet model for Cu Kα, quintet model for the attenuated Cu Kβ X-ray (Deutsch et al., Reference Deutsch, Forster, Holzer, Hartwig, Hamalainen, Kao, Huotari and Diamant2004), and a truncated exponential profile model for Ni K-absorption edge structure in the background region of the diffraction data are deconvolved, and hypothetical singlet Cu Kα 1 Lorentzian peak profile and hyperbolic secant function for compensation of removing Ni K-edge structure are convolved. Peak shift and asymmetric deformation caused by axial-divergence, equatorial, and sample transparency aberrations are corrected by deconvolutional methods, applying the instrumental and specimen parameters: goniometer radius R, divergence slit open angle ΦDS, Soller-slits angle ΦSS, view angle of 1D detector 2Ψ, specimen width and thickness, W and t, and penetration depth μ −1.
Figure 4 shows the diffraction intensity data in the 2Θ range from 10° to 90° observed for the specimen #1 and the DCT intensity data.
(a) Diffraction intensity data in the 2Θ range from 10° to 90°, observed for specimen #1, and (b) DCT data. The vertical lines indicate the peak locations listed in PDF 00-046-1212.

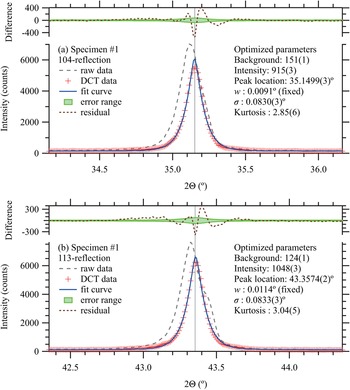
Diffraction peak profiles of 012, 104, 110, 113, 024, 116, 214, and 300-reflection peaks are extracted from the DCT data, and individual peak profile fitting (IPPF) by Levenberg-Marquardt algorithm (Marquardt, Reference Marquardt1963) is applied. A symmetric peak profile model function, defined as the convolution of the Lorentzian function with the half width at half maximum (HWHM) w = 0.0005 tanθ, and symmetrized instrumental model function determined by the standard deviation σ and kurtosis (Ida, Reference Ida2021b), is applied on the IPPF process. The values of w are treated as fixed parameters. Constant background, integrated intensity, peak location, and two parameters for the symmetrized instrumental function (standard deviation σ and kurtosis), are treated as adjustable parameters.
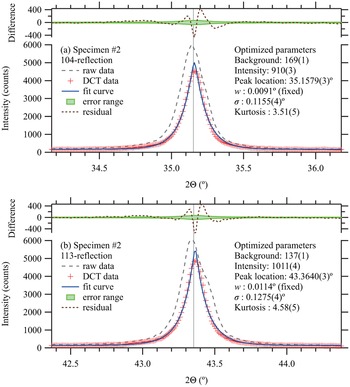
The DCT and IPPF processes for 104 and 113-reflections of specimens #1 and #2 are demonstrated in Figures 5 and 6. The square roots of DCT intensities are temporarily treated as the statistical errors of intensities on IPPF process, even though it might not be fully justified in the view of statistical theories (Ida and Toraya, Reference Ida and Toraya2002).
Observed (raw), DCT, and fit curve peak profiles of (a) 104-reflection and (b) 113-reflection of specimen #1. The vertical lines indicate the peak locations listed in PDF 00-046-1212.

Observed (raw), DCT, and fitting peak profile of (a) 104-reflection and (b) 113-reflection of specimen #2. The vertical lines indicate the peak locations listed in PDF 00-046-1212.

Smooth appearance of the observed intensity curves shown in Figures 5 and 6 supports that the continuous-scan integration of SSXD (CSI–SSXD) effectively improves the statistical property of powder diffraction data. No significant difference between the integrated intensities of the DCT profile and fit curve is detected in the difference plots. The peak positions of the specimens #1 and #2 obtained by the DCT-IPPF processes coincide with the values listed in PDF 00-046-1212 within the allowable mechanical error 0.01° of the instrument.
The additional broadening of peak profile of specimen #2 from specimen #1 is estimated at 0.08° and 0.09° in the standard deviations σ for 104 and 113-reflections, respectively. If the broadening is caused by a crystallite size effect, the size of crystallites of specimen #2 will roughly be estimated at about 0.1 μm, which is consistent with the typical primary particle size in SEM images shown in Figure 3.
The relative intensities extracted by the individual peak profile fitting are listed in Table V. The root mean square differences of diffraction intensities from the NIST SRM676a data are 1.4% for the specimen #1, and 2.3% for the specimen #2. The experimental results for specimens #1 and #2 also support that the 113-reflection is the strongest, 116-reflection is the second strongest, and 104-reflection is the third strongest peak for randomly oriented powder of α-Al2O3.
Laue index hkl, diffraction intensities certified for NIST SRM676a, and observed intensities for specimens #1 and #2.

Differences from SRM676a intensities are shown as values in parentheses.
V. CONCLUSION
It is suggested that 104-reflection in the hexagonal setting of rhombohedral α-Al2O3 tends to be emphasized as compared with 113-reflection, by the effect of preferred orientation along (001)-direction, in powder X-ray diffraction data.
DFT calculations based on PAW pseudopotential support that 113-reflection is the strongest diffraction peak for randomly oriented crystalline powder of α-Al2O3, even though the coincidence with NIST SRM676a intensities is not better than a conventional fully ionized model  ${\rm Al}_2^{3 + } {\rm O}_3^{2-}$. Perdew-Burke-Ernzerhof (PBE) exchange-correlation model gives slightly better coincidence than LDA.
XRD data of two types of relatively fine (nominally 2–3 μm and ca 0.3 μm) powder of α-Al2O3 have been collected and DCT. Integrated intensities are extracted from the DCT data by individual peak profile fitting with a symmetric model function. The results also support that the 113-reflection is the strongest, 116-reflection is the second strongest, and 104-reflection is the third strongest peak for randomly oriented powder of α-Al2O3.
ACKNOWLEDGMENTS
The experimental part of this study has been financially supported by JSPS KAKENHI grant No. 19H02747. The author would like to thank Y. Yoshitake and H. Hibino for providing SEM images of powder samples.