Introduction
Sensor-based feature extraction is the basis of a number of machine learning and pattern recognition tasks such as tool condition monitoring (Silva et al., Reference Silva, Reuben, Baker and Wilcox1998; Dimla & Lister, Reference Dimla and Lister2000; Bhuiyan et al., Reference Bhuiyan, Choudhury and Dahari2014). In process modeling and predictive data mining, it is common to make use of features in order to synthesize information (Fu, Reference Fu2011). A relevant feature is usually defined as one which is highly correlated with a given condition that has to be diagnosed, and so its relevance has a direct impact on the performance of such monitoring systems. The main problem concerning the relevance of a feature is that there is no universally accepted definition of what is a highly correlated feature concerning the target function when using multiple features, in the presence of noisy data and additionally when we are in the presence of apparently poorly correlated features (Huang et al., Reference Huang, Tan, Wong, de Silva, Goh and Tan2007; Warren Liao, Reference Warren Liao2010; Loutas et al., Reference Loutas, Roulias, Pauly and Kostopoulos2011; Lauro et al., Reference Lauro, Brandão, Baldo, Reis and Davim2014; Lin & Chen, Reference Lin and Chen2014).
In general, monitoring methods are model-based or feature-based. Model-based methods have two significant limitations; the first is that many manufacturing processes are non-linear time-variant systems. A typical example is a machining process where the non-linearity is caused by the regenerative interaction between the structural vibration and the cutting forces. In addition, sensor signals are dependent on process working conditions. It is often difficult to identify whether a change in sensor signal is due to the change of process working condition or to deterioration of the process.
In the field of tool condition monitoring, the use of carefully selected sensor-based features is fundamental for process modeling and identification (Shao et al., Reference Shao, Li, Liu and Zhang2013b). Monitoring tool condition encompasses the acquisition of noisy data that has to be filtered, selected, and synthesized into carefully selected indicators, here referred to as features. Different sensing techniques have been used for condition monitoring of the cutting process, these include motor current, temperature, acoustic emissions, audible emissions, force, and vibration (Silva et al., Reference Silva, Reuben, Baker and Wilcox1998; Zhu et al., Reference Zhu, Wong and Hong2009). Reported results have demonstrated different behavior regarding the performance of these techniques and applied typically under laboratory conditions. It has been demonstrated that sensor information has an undoubted correlation to the wear state of cutting tools, but no set of features from acquired sensor information has gained major acceptance from researchers. Little has been done on perceiving the value or contribution of each sensed feature toward tool condition monitoring and it is clear that different features contribute differently (Silva et al., Reference Silva, Baker, Wilcox and Reuben2000; Silva, Reference Silva2009; Yan et al., Reference Yan, Gao and Chen2014; Teti, Reference Teti2015).
The use of multiple sensors has been shown to enhance the performance of tool wear monitoring systems (e.g. Silva et al., Reference Silva, Reuben, Baker and Wilcox1998; Girardin et al., Reference Girardin, Rémond and Rigal2010; Duro, et al., Reference Duro, Padget, Bowen, Kim and Nassehi2016), because different sensor types can provide independent information related to the tool wear level. Such an approach also reduces the sensitivity of the system to any particular sensor's drawbacks, requiring less precision than with a single sensor potentially leading to less sophisticated signal processing. Through appropriate analysis, the dependence of each feature on changes in process conditions can be analyzed providing improved reliability in making decisions as to the state of tool wear in the face of (perhaps minor) changes in machining conditions.
Given the noisy characteristic of sensor-based information and the challenging task of modeling the cutting process, most often tool wear monitoring is performed using artificial intelligence techniques such as neural networks. Giving continuity to previous work in the field of tool condition monitoring using artificial intelligence techniques (Balazinski & Czogala, Reference Balazinski and Czogala2002; Lauro et al., Reference Lauro, Brandão, Baldo, Reis and Davim2014), a self-organizing map (SOM) neural network approach to tool wear classification based on sensor information collected during the cutting process is presented here. Further, this same paradigm is used to demonstrate that even in the presence of noisy data, feature selection can be performed in order to evaluate the contribution of features toward successful neural network modeling using statistical techniques developed for topographical analysis. This paper is structured according to the following main sections: condition monitoring approaches; supporting method and techniques for pattern classification and evaluation; experimental setup; and results and discussion.
Condition monitoring and system identification
Condition monitoring has witnessed an exponential development since the late 1990s mostly due to the increased processing capacity of computers along with the necessity and feasibility of recent advancements regarding the detection of cutting tool wear levels (Tangjitsitcharoen & Moriwaki, Reference Tangjitsitcharoen and Moriwaki2008). The operators’ ability to proceed with well-timed tool changes based on their senses, that is, sound and vibration, gained approval among researchers and has been incorporated in most condition monitoring systems proposed so far. For these approaches to function well, it is required to have robust sensor information, and hence extracted features, to support decision-making regarding timely tool changes. There are several studies that demonstrate the direct relationship between audible emissions and tool wear (Weller et al., Reference Weller, Scrier and Weichbrodt1969; McNulty & Popplewell, Reference McNulty and Popplewell1997), and there are significant references stating that these changes of power occur in certain frequency bands (McNulty & Popplewell, Reference McNulty and Popplewell1997; Silva et al., Reference Silva, Reuben, Baker and Wilcox1998). In the study conducted by Lee (Lee, Reference Lee1986), a direct relationship with tool wear in the frequency band 4–6 kHz was reported, stating that a decrease in sound pressure in the tertiary wear zone was indicative of the end of tool life. Another parameter used in monitoring includes tool vibration (Dimla & Lister, Reference Dimla and Lister2000) and its main advantage is the fact of being no-intrusive. Measured force has also been a traditional and reliable means for wear estimation although most often sensitive to a variable set of parameters, including cutting conditions, tool geometry, and material being cut (Huang et al., Reference Huang, Tan, Wong, de Silva, Goh and Tan2007; Binder et al., Reference Binder, Klocke and Lung2015; Nouri et al., Reference Nouri, Fussell, Ziniti and Linder2015).
Although many contributions regarding the detection of tool wear levels have been proposed, developed, and tested, most research lacks the robustness which is essential for industrial applications. Robustness is affected mainly due to the fact that most studies have a limited scope regarding cutting parameters as well as the combination of materials and tool but mostly because sensed data are impregnated with noise inherent to the cutting process, surrounding environment, and deficient signal processing or poor feature selection. Condition monitoring is most often performed with the aid of system identification techniques (Li, Reference Li2002) to establish the relationship between cause and effect, such as artificial intelligence techniques, given that this type of modeling technique can operate well under the presence of noisy and often non-linear signal-based information (Balazinski & Czogala, Reference Balazinski and Czogala2002; Markou & Singh, Reference Markou and Singh2003).
Unsupervised feature selection is recognized as very important and might contribute to eliminate redundant features (Shao et al., Reference Shao, Paynabar, Kim, Jin, Hu, Spicer and Abell2013a). Other fields of study have already experimented with unsupervised feature selection with promising results although reporting limitations such as data dependency (Warren Liao, Reference Warren Liao2010; Yuwono et al., Reference Yuwono, Guo, Wall, Li, West, Platt and Su2015). Duro et al., Reference Duro, Padget, Bowen, Kim and Nassehi2016 performed feature and sensor selection for condition monitoring using multiple acoustic emission sensors reporting limited success given the high influence of sensor position on condition monitoring performance. Although important advancements have been made toward feature selection, previous proposals do not take into account the embedded modeling that neural networks perform when conducting unsupervised learning and therefore are limited to statistical extrapolation.
Artificial neural networks and spatial analysis
Given that direct measurement of tool wear during turning is rather difficult, it is normal to use indirect techniques to sense the level of wear in the cutting tool. As mentioned earlier, there are a number of reported techniques that use sensors, for example, force, vibration, sound, acoustic emissions, power consumption, etc., in order to translate the process energy into electrical signals that are further processed through signal processing techniques into tool wear level-related features. There is a large set of features already used and presented in the literature (Dimla, Reference Dimla2000) and most of them rely on statistical or frequency analysis techniques. In order to perform condition monitoring, and given the non-linearity and noisy characteristic of the process, it is most often necessary to use some modeling technique to automatically interpret the overall feature results. Despite the relative success of previous research work on condition monitoring using different sensors and feature extraction techniques, there are limited contributions regarding the reasoning and robustness behind the choices made upon different features used on the development of such systems. It is argued that the use of multiple sensors as well as multiple features should enhance the performance of condition monitoring systems since more information is retained, although there is scarce information on the genuine contribution of each feature toward the tool wear level classification.
One of the most prominent tools used in engineering when modeling noisy and poorly understood processes are neural networks, given their high performance and tolerance in the presence of spurious errors and when dealing with noisy non-linear systems. Unlike other neural networks the SOM is an artificial intelligence technique that needs no prior knowledge of the target classification since it solely maps in a two-dimensional space similar patterns closer to each other, performing vector quantization alike clustering. Clusters of vectors are later classified by visual inspection or through interpolation techniques with the aid of off-line measured levels of wear for a sample of feature vectors (Kohonen, Reference Kohonen2013).
The SOM neural network is traditionally made up of two interconnected layers of neurons, one corresponding to the input feature vector dimension and a two-dimensional output map with variable dimension to accommodate different levels of tool wear or clusters of similar patterns (Kohonen, Reference Kohonen1990). Generally, the interconnected neurons possess weights that are adjusted as sampled feature vectors are presented giving rise to a topological ordering of similar patterns. The algorithm used here to perform clustering and classification differs from traditional implementations in that the weight update process considers the effect of the winning frequency (f i) only for already established clusters avoiding overfitting in the process of learning but allowing an initial distribution that gives rise to the formation of distributed clusters on the output map. Weights (w ij) between neurons i and j are updated according to the variation of the neighborhood function (λ ij) and the learning rate (η):
 $$\Delta w_{ij} = \eta. \lambda _{ij}(\,f_i - w_{ij}).$$
Weight update is performed for every feature vector presentation and takes into account the inhibitory effect of distant neurons. The neighborhood coefficient takes into account the vector distance, |v winner−v ij|, of each neuron on the output map, v ij, to the winner node, v winner. The choice for an exponential function to quantify the inhibitory effect reinforces the envisaged sparse distribution of clusters:
 $$\lambda _{ij} = e^{ - \vert v_{{\rm winner}} - v_{ij} \vert /d_{\max}}. $$
The implemented variations enable this algorithm to outperform the traditional Kohonen map creating smoother output maps where clusters of data sets are uniformly distributed avoiding overcrowding of nearby groups. Since an unsupervised approach has been used, the neural network does not automatically recognize or relate classification to the tool wear level of a predetermined feature vector presented. It is necessary to further match the trained neural network clusters with a set of feature vector samples in order to automate the classification process. This is done simply by applying a regression method such as the Krigging technique used in geostatistics to interpolate or approximate two-dimensional data. Similar approaches have been used to automate the process of classifying tool wear in pursue the unmanned machining center.
Having in mind that this type of neural network clusters input feature vectors in an unsupervised manner solely taking into account the information provided by the selected features and considering that clustering is attained through a weighted contribution of the different features, it is laudable that each of the weights associated with one of the input neurons should reveal important information regarding each feature contribution toward tool wear classification. Therefore, a spatial analysis of each of the weights associated with one of the input neurons by similarly mapping those weights onto the output map was proposed. If the mapped weights reveal significant variation, considering that input feature vectors are normalized, it should allow for an evaluation of the strength of each feature toward tool wear classification. The use of the variogram function was proposed to measure the variability of data in the two-dimensional space. Whereas autocorrelation of the variogram function provides a one-dimensional measure and an indication of how the distribution leaves normality (Kerry & Oliver, Reference Kerry and Oliver2007; Kouadri et al., Reference Kouadri, Aitouche and Zelmat2012), the variogram estimates the degree of spatial dependence and therefore provides an objective measure on the variability gradient of the two-dimensional weight mapping (Yupeng & Miguel, Reference Yupeng and Miguel2011; Ericeira et al., Reference Ericeira, Silva, Paiva and Gattass2013).
Experimental work
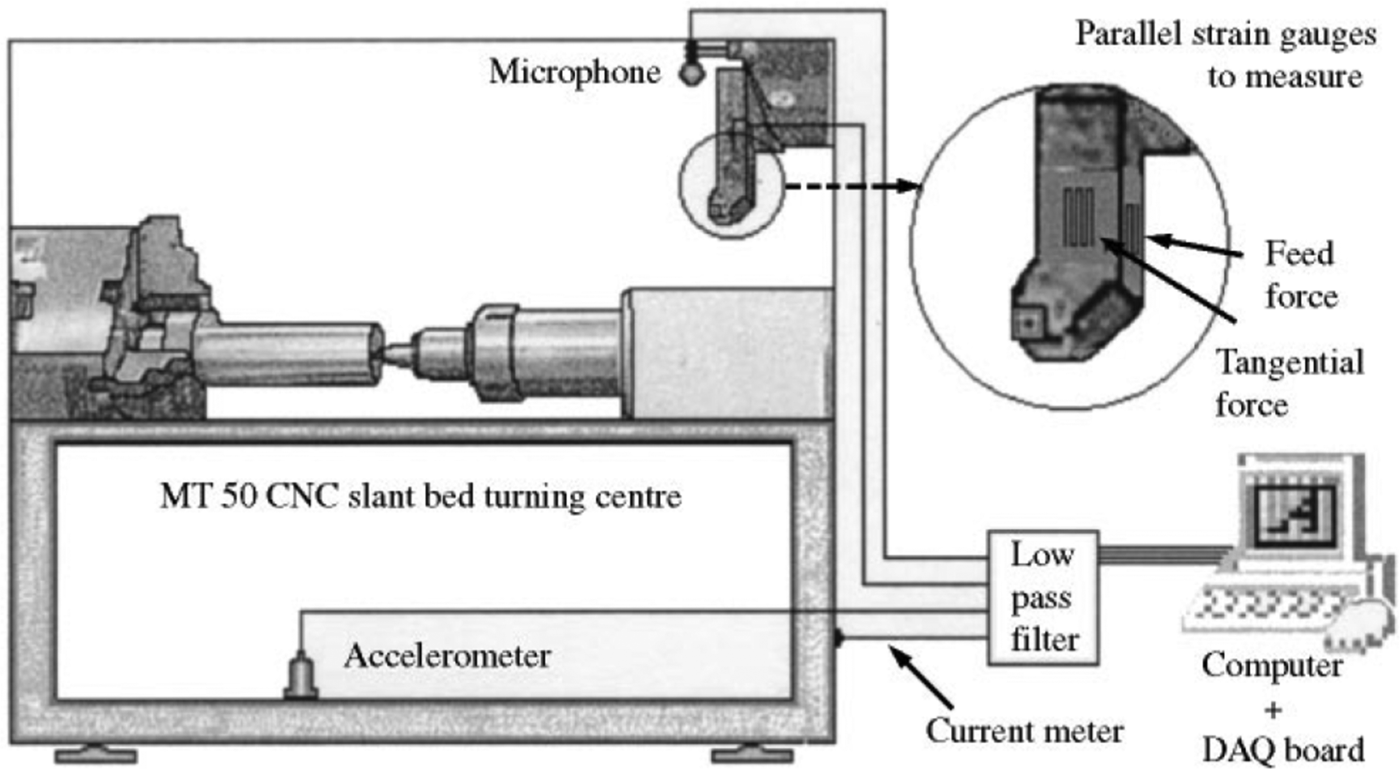
Experimental work was carried on an MHP Model Moog-Turn 50 (MT50) Slant Bed Turning Centre (MHP Machines Ltd.), with standard CNC control. The effective bed size is 500 mm with a DC servo motor of 18 kW driving the spindle. This machine can provide a constant power of 34 kW between 1000 and 3000 RPM, and the range of admissible cutting parameters is limited by the maximum 4000 RPM imposed by the chuck capacity. The turning center has the following program resolution: feed rate 0.001 mm/rev, cutting speed 1 m/min, and depth of cut resolution 0.001 mm. One of the aims of the work was to utilize sensors in the least intrusive way, so as to facilitate the potential use of the monitoring system in practical situations. Four measurements were selected to monitor tool wear evolution: vibration, sound emission, cutting forces, and spindle current (Fig. 1). A cylindrical bar of EN1A1 (BS 970: Part 1: 1983: 220M07/230M07) was machined with 135 mm cut lengths to a final diameter of 30 mm. HC-P25 grade-type inserts (WALTER – WTN 43) coated carbide (CNMG 120408) were used throughout all the experiments. The angles of the insert seating were cutting rake −6o, and back rake −6o, relative to the tool holder.
Schematic view of lathe and sensor position.

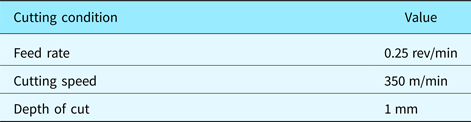
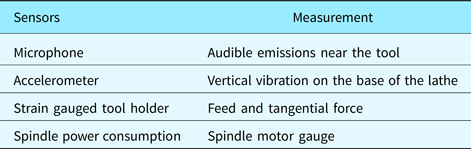
The cutting conditions used during experiments to cut mild steel are presented in Table 1 and the sensor set is presented in Table 2. Analog input channels were connected in a bipolar mode using a voltage range of ±5 v and a resolution of 12 bits or 0.0024 v and each of the channels sampled at 20 kHz. Data gathering while turning consisted of recording at the mid-point of the machined workpiece.
Set of cutting conditions

Sensors and associated measurement

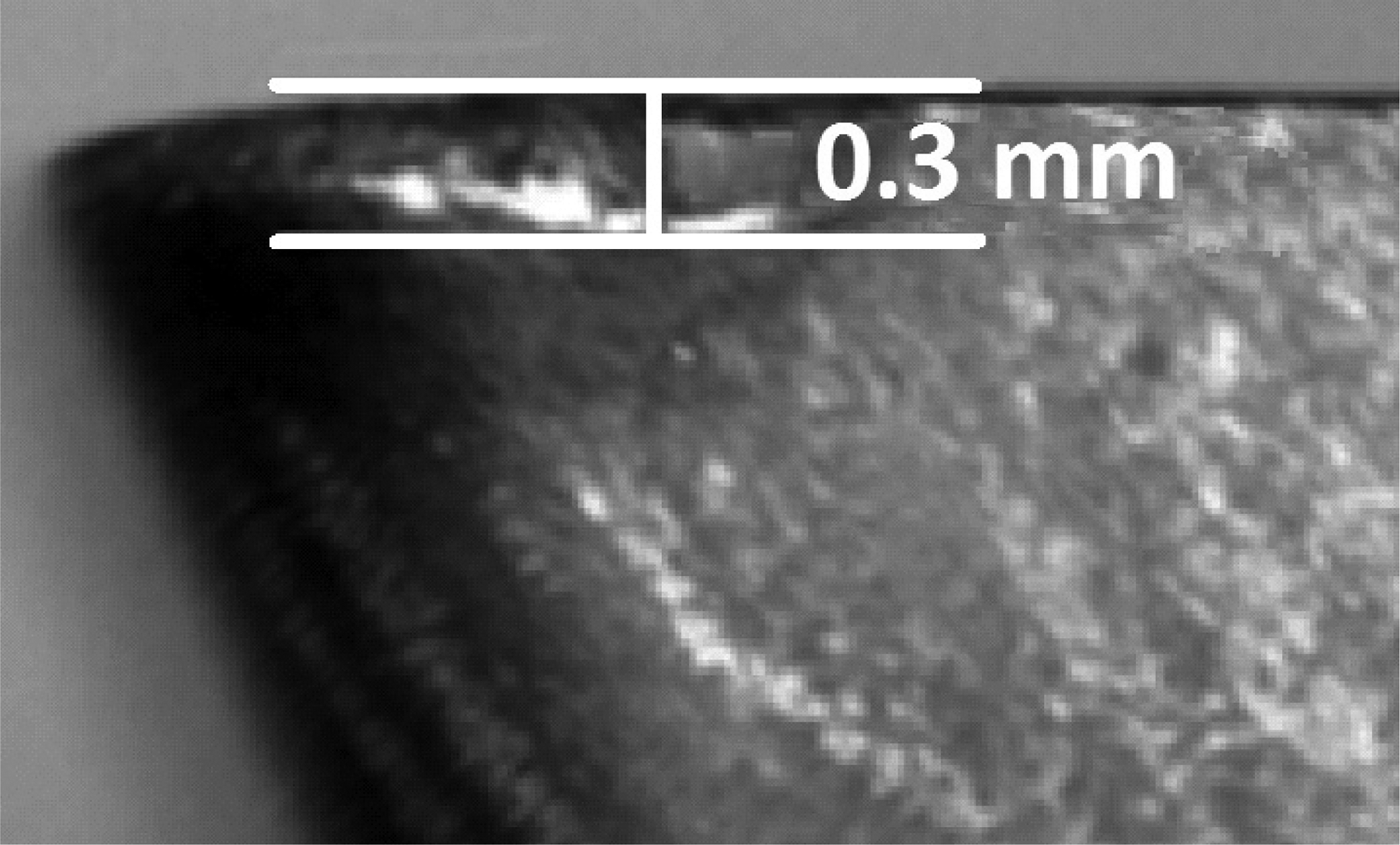
After each recording, flank wear, VB B, was measured with an engineering microscope (Fig. 2) with a resolution of 0.01 mm. Data samples were taken every 2 min over the tool life of about 15 min (experimentally determined) along with the respective measurements of flank wear.
Sample flank wear measurement.

Sensed data, prior to signal processing, consist of a 512-point sample that afterward is synthesized into eight statistical measures extracted from raw sound and vibration data: average, absolute deviation, kurtosis, and skewness. Additional processing is conducted in the frequency domain in the bands of 2.2–2.4 and 4.4–4.6 kHz to obtain their energy level. Tangential and feed forces are also acquired completing the 14 feature vector used to characterize the level of tool wear covering a large spectrum of features traditionally utilized in condition monitoring of the cutting process.
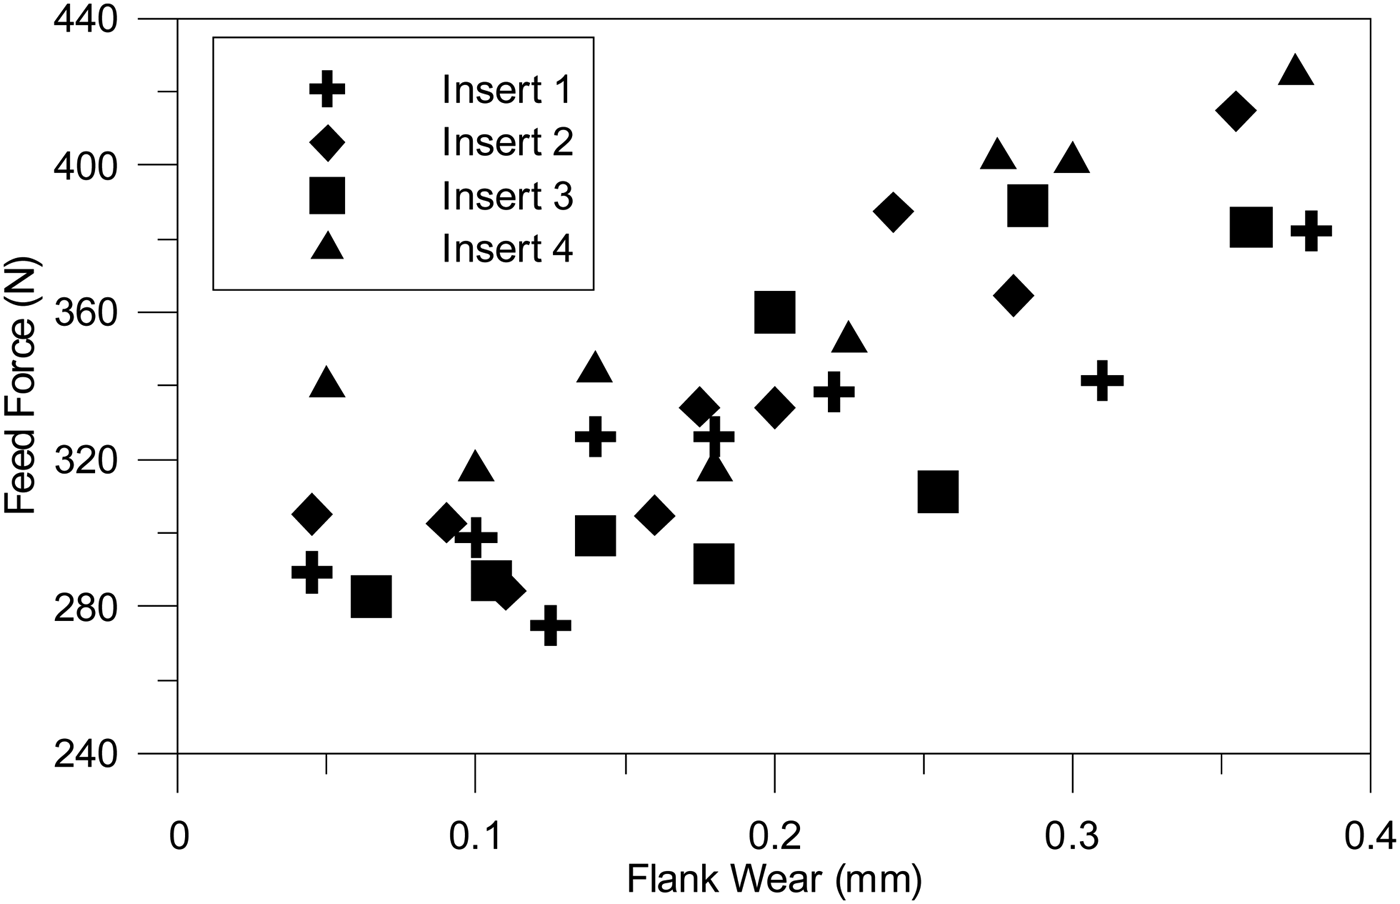
As can be observed for the feed force (Fig. 3), both tangential and feed forces exhibited an increase in tool wear which was consistent between all inserts. Both forces increase with tool wear, although much noise can be depicted making it difficult to establish a consistent tool wear limit criteria solely based on these features. As can be seen for insert number 3 in Figure 3, measured values do not show a consistent overall increase due to noise interference making single feature/sensor-based monitoring very difficult if not impossible.
Feed force versus tool wear.

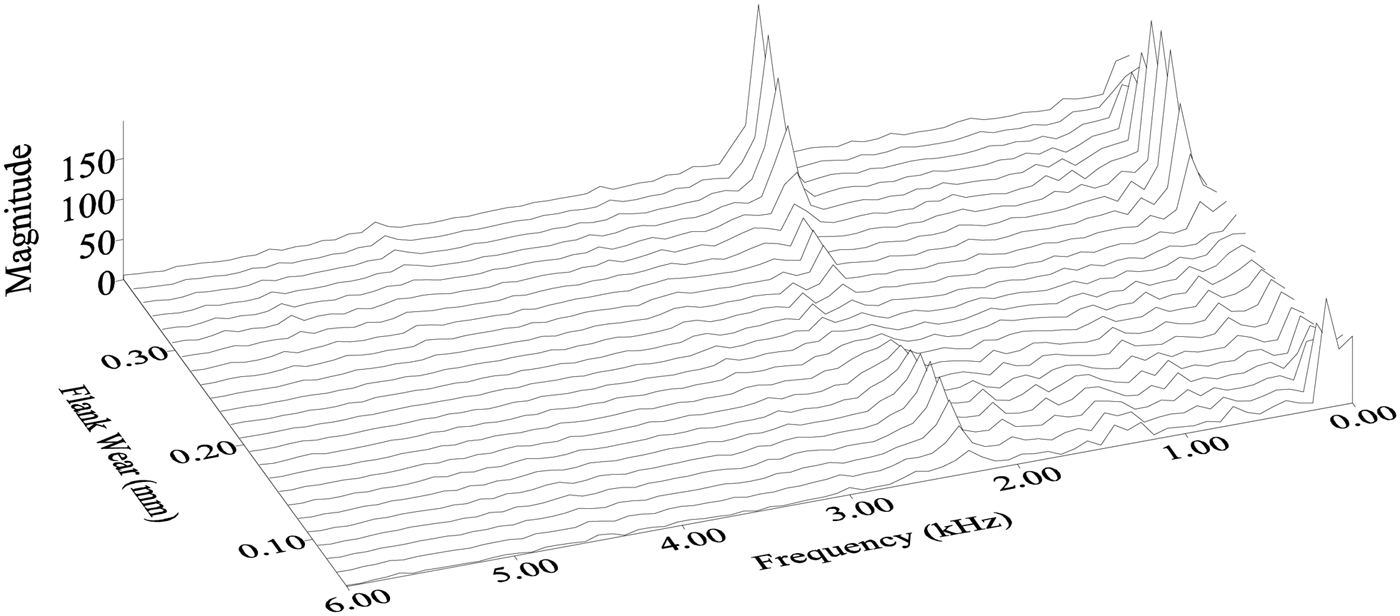
It can be observed from Figure 4 that the frequency spectrum of the microphone data reports a consistent variation among cutting inserts in the following frequency bands: 3.5–5.5 and 6.2–7.5 kHz. Vibration has a similar evolution in the following frequency bands: 3.6–5.2 and 6.2–7.2 kHz.
Frequency spectrum of audible sound (insert 1).

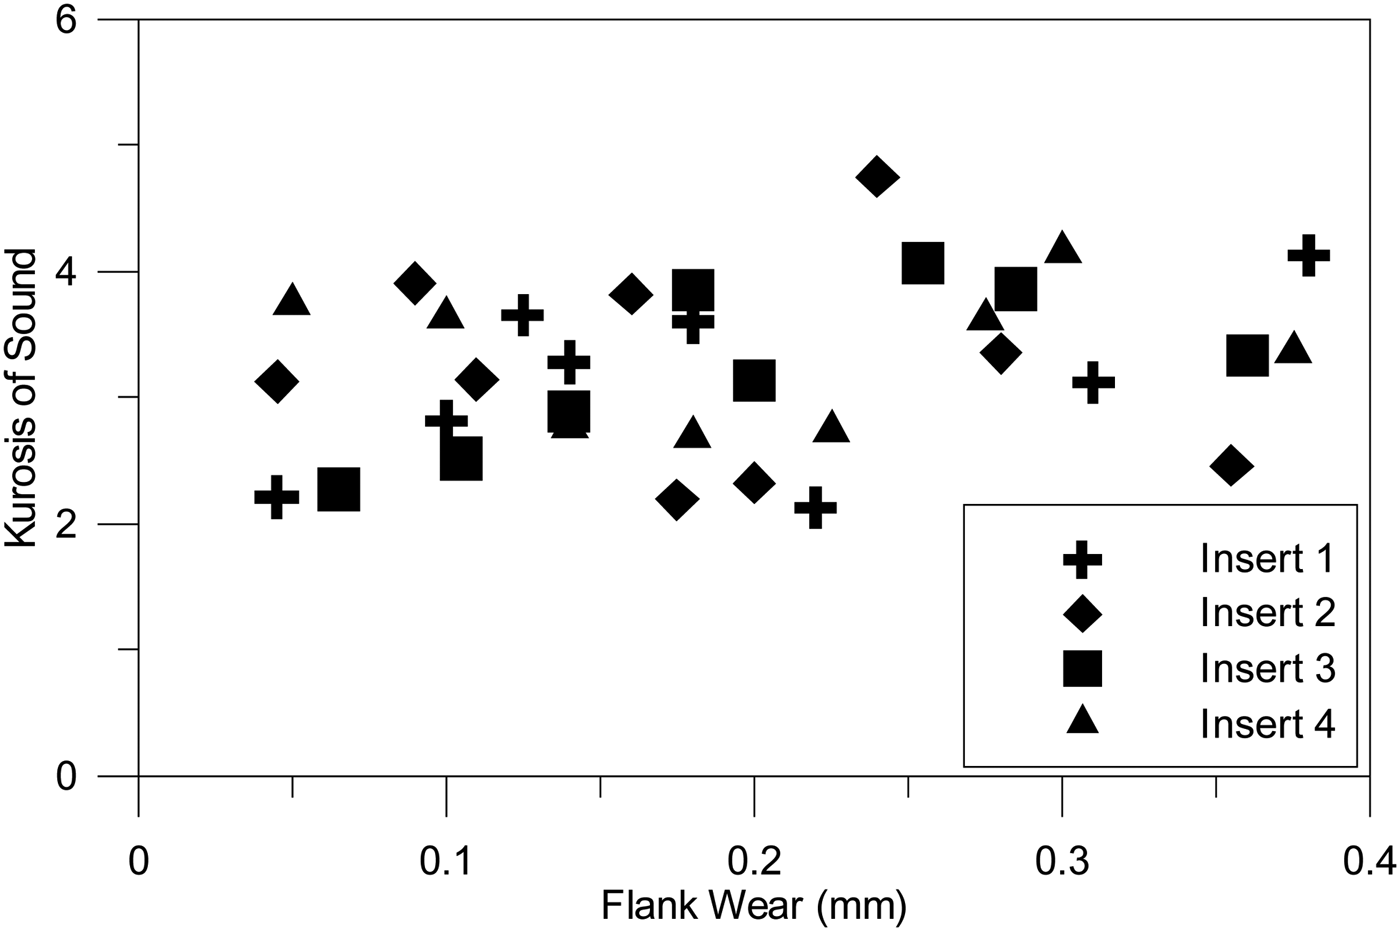
The features obtained from the statistical analysis of the raw data (Fig. 5 shows the kurtosis as an example) show complex patterns with no apparent relationship to the tool wear. Although these features exhibit no obvious relationship with tool wear, and given that the cutting process dynamics are still poorly understood and a challenging problem to model, it was decided to maintain these features in the training feature set in order to validate the proposed feature selection method. Another reason for keeping these features in the vector feature set concerns the complexity of the problem and the ability of neural networks to unveil complex and non-linear relationships between them that aid in the classification process.
Kurtosis of sound versus tool wear.

Tool wear classification and feature selection results
The results described previously were used here to test the performance of the neural network toward tool wear classification. Under fixed cutting conditions, sample data from four cutting inserts was acquired producing 37 different feature vectors representative of different wear levels. The procedure undertaken to identify the strongest features followed four main steps: first, the SOM was trained with the full feature set vector in an unsupervised fashion allowing for self-organization to take place with no prior knowledge of tool wear classification; following, features were isolated to produce an output map similar to the one with cumulative contribution of all features; third, each isolated contribution output map is submitted to a spatial analysis in order to determine their biased contribution through a two-dimensional variogram analysis; finally, and upon the selection of best gradient variogram features, the SOM was trained again with the reduced feature vector in order to access changes in classification performance.
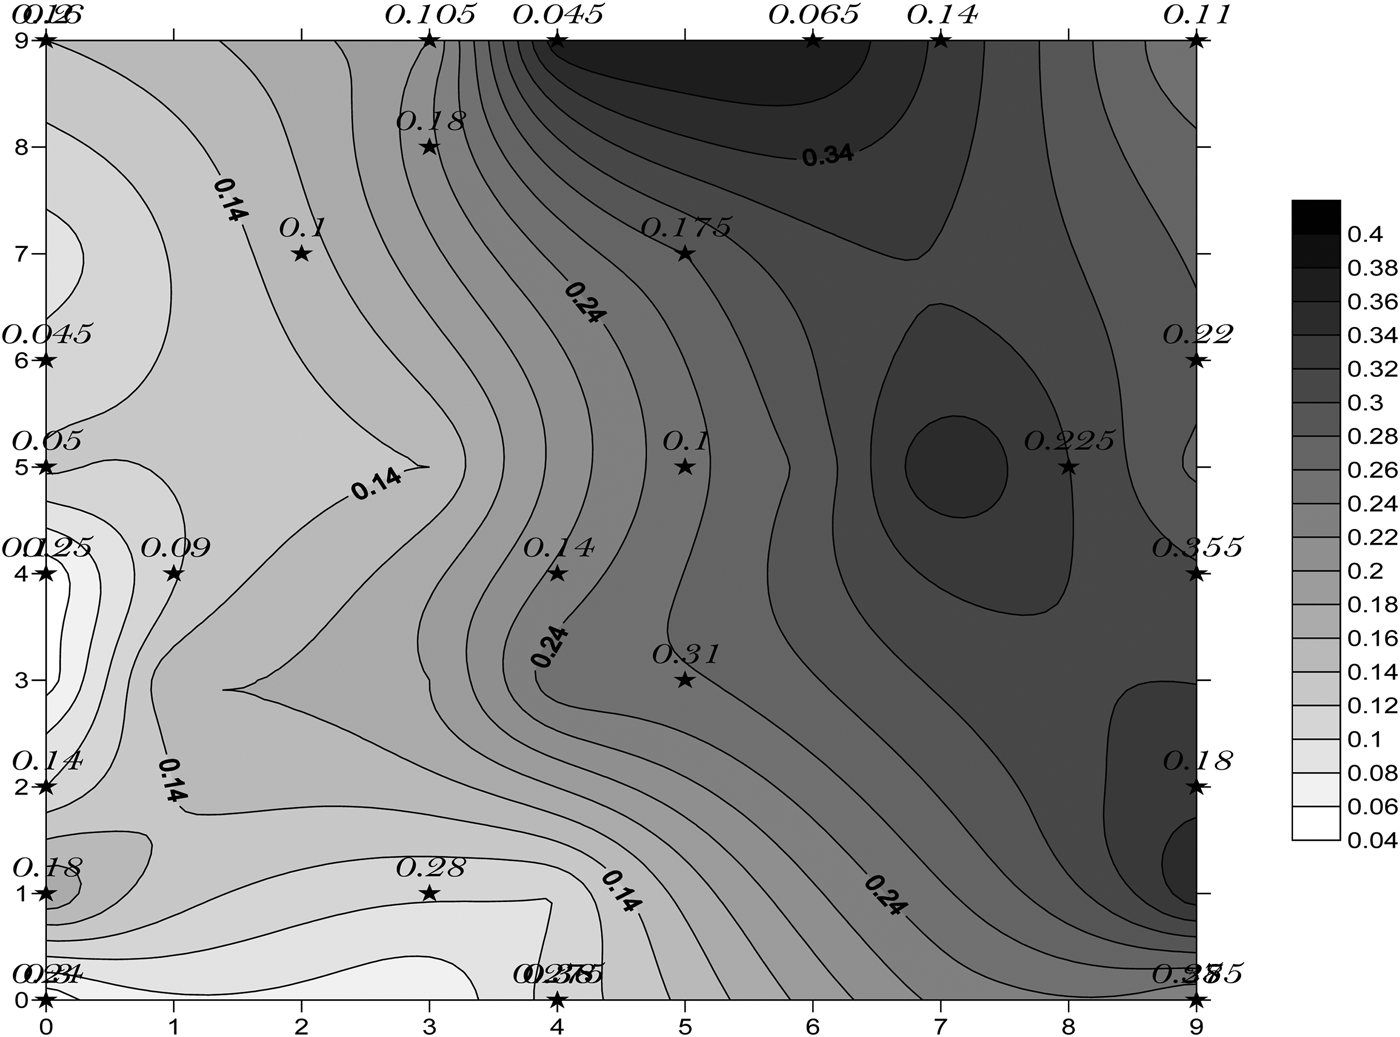
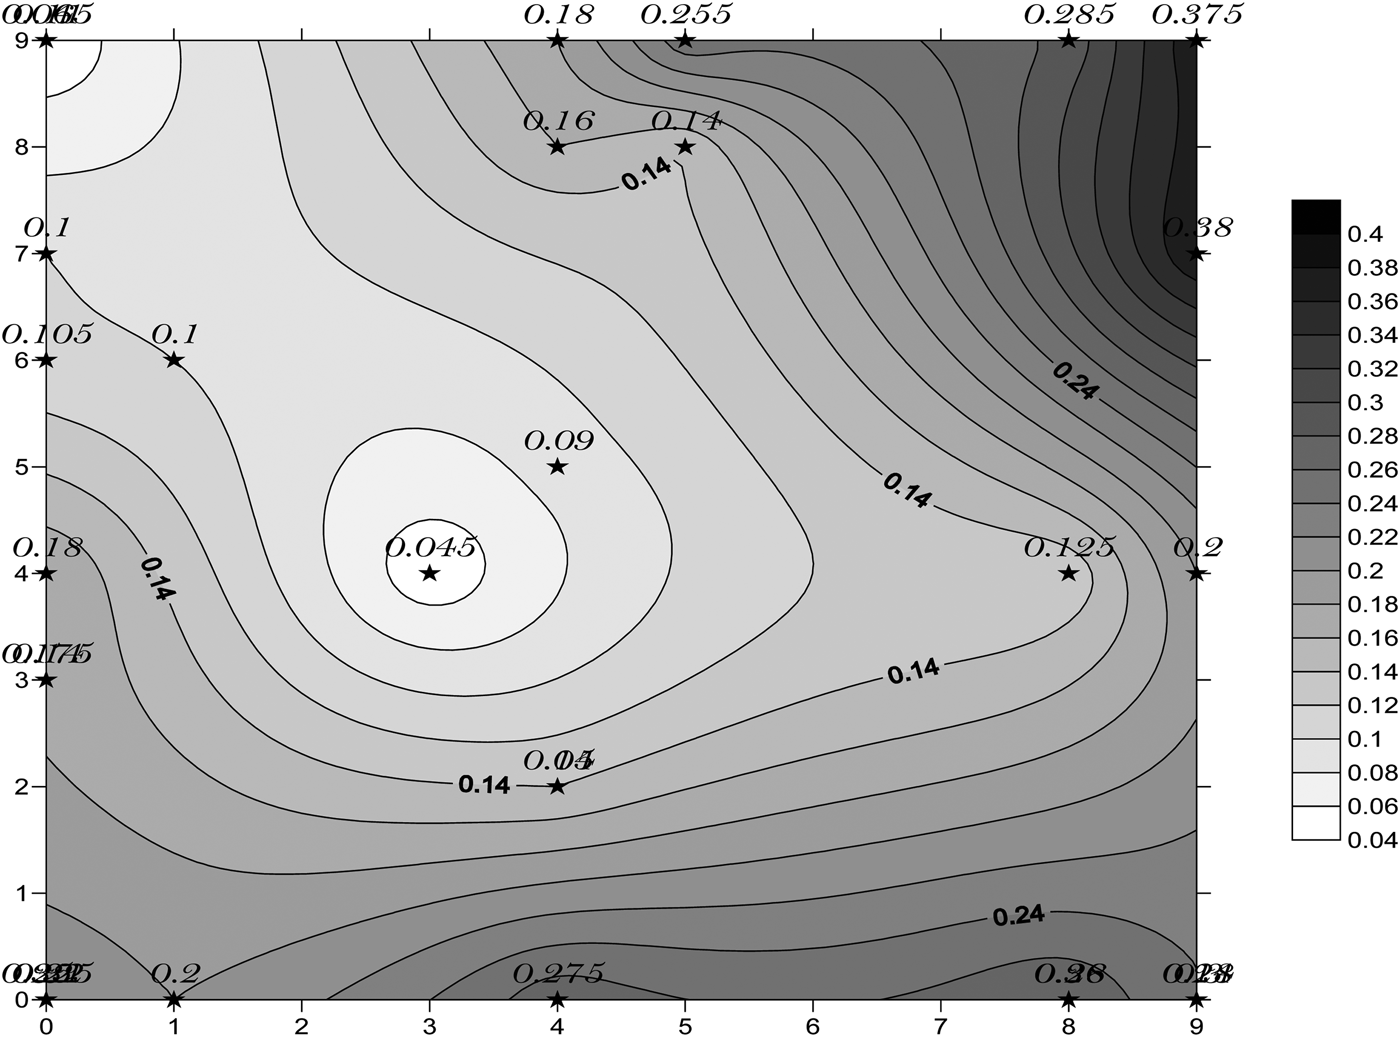
The SOM was trained for 400 epochs, and after this period, organized areas, representative of different wear levels, were created on a 10 × 10 neurone output layer (Fig. 6). The criterion used to stop the training process relied on the observation of weight changes and the assumption that when little changes occur, learning does not evolve. Interpretation of each neurone's wear representation on the output network layer, where all the test conditions are mapped, is obtained with the aid of interpolation since not all neurons had the opportunity to represent a feature vector set – 10 × 10 neurons against 37 features. Interpolation is possible and feasible given that representations of similar wear levels occupy adjacent locations on the output neurone grid and therefore pervasive to the use of surface meshing methods. Interpolation allows for all neurons on the output map to be mapped into different wear levels and thus allowing for automated tool wear level classification.
Contour map of tool wear state classification after 400 epochs trainings with full feature vector.

It can be seen in Figure 6 that self-organization occurs and similar patterns, corresponding to close tool wear classification levels, are placed nearby on the output map. Darker areas represent worn tools, while light grey areas represent new tools. Contour lines give an idea of tool wear classification labels corresponding to output neurons, and star (*) markers are the actual measured values location corresponding to each of the presented full feature vectors. Although classification results show an overall good performance, one can depict some misclassifications, and occasional sample vectors being placed not far from the correct classification, showing a small deviation from the correct classification. As previously stated, these results use the full feature vector regardless of each feature's potential contribution toward tool wear level classification despite the fact that some of them reveal no apparent correlation to tool wear and are undoubtedly contaminated with noise and spurious signals inherent to the cutting process.
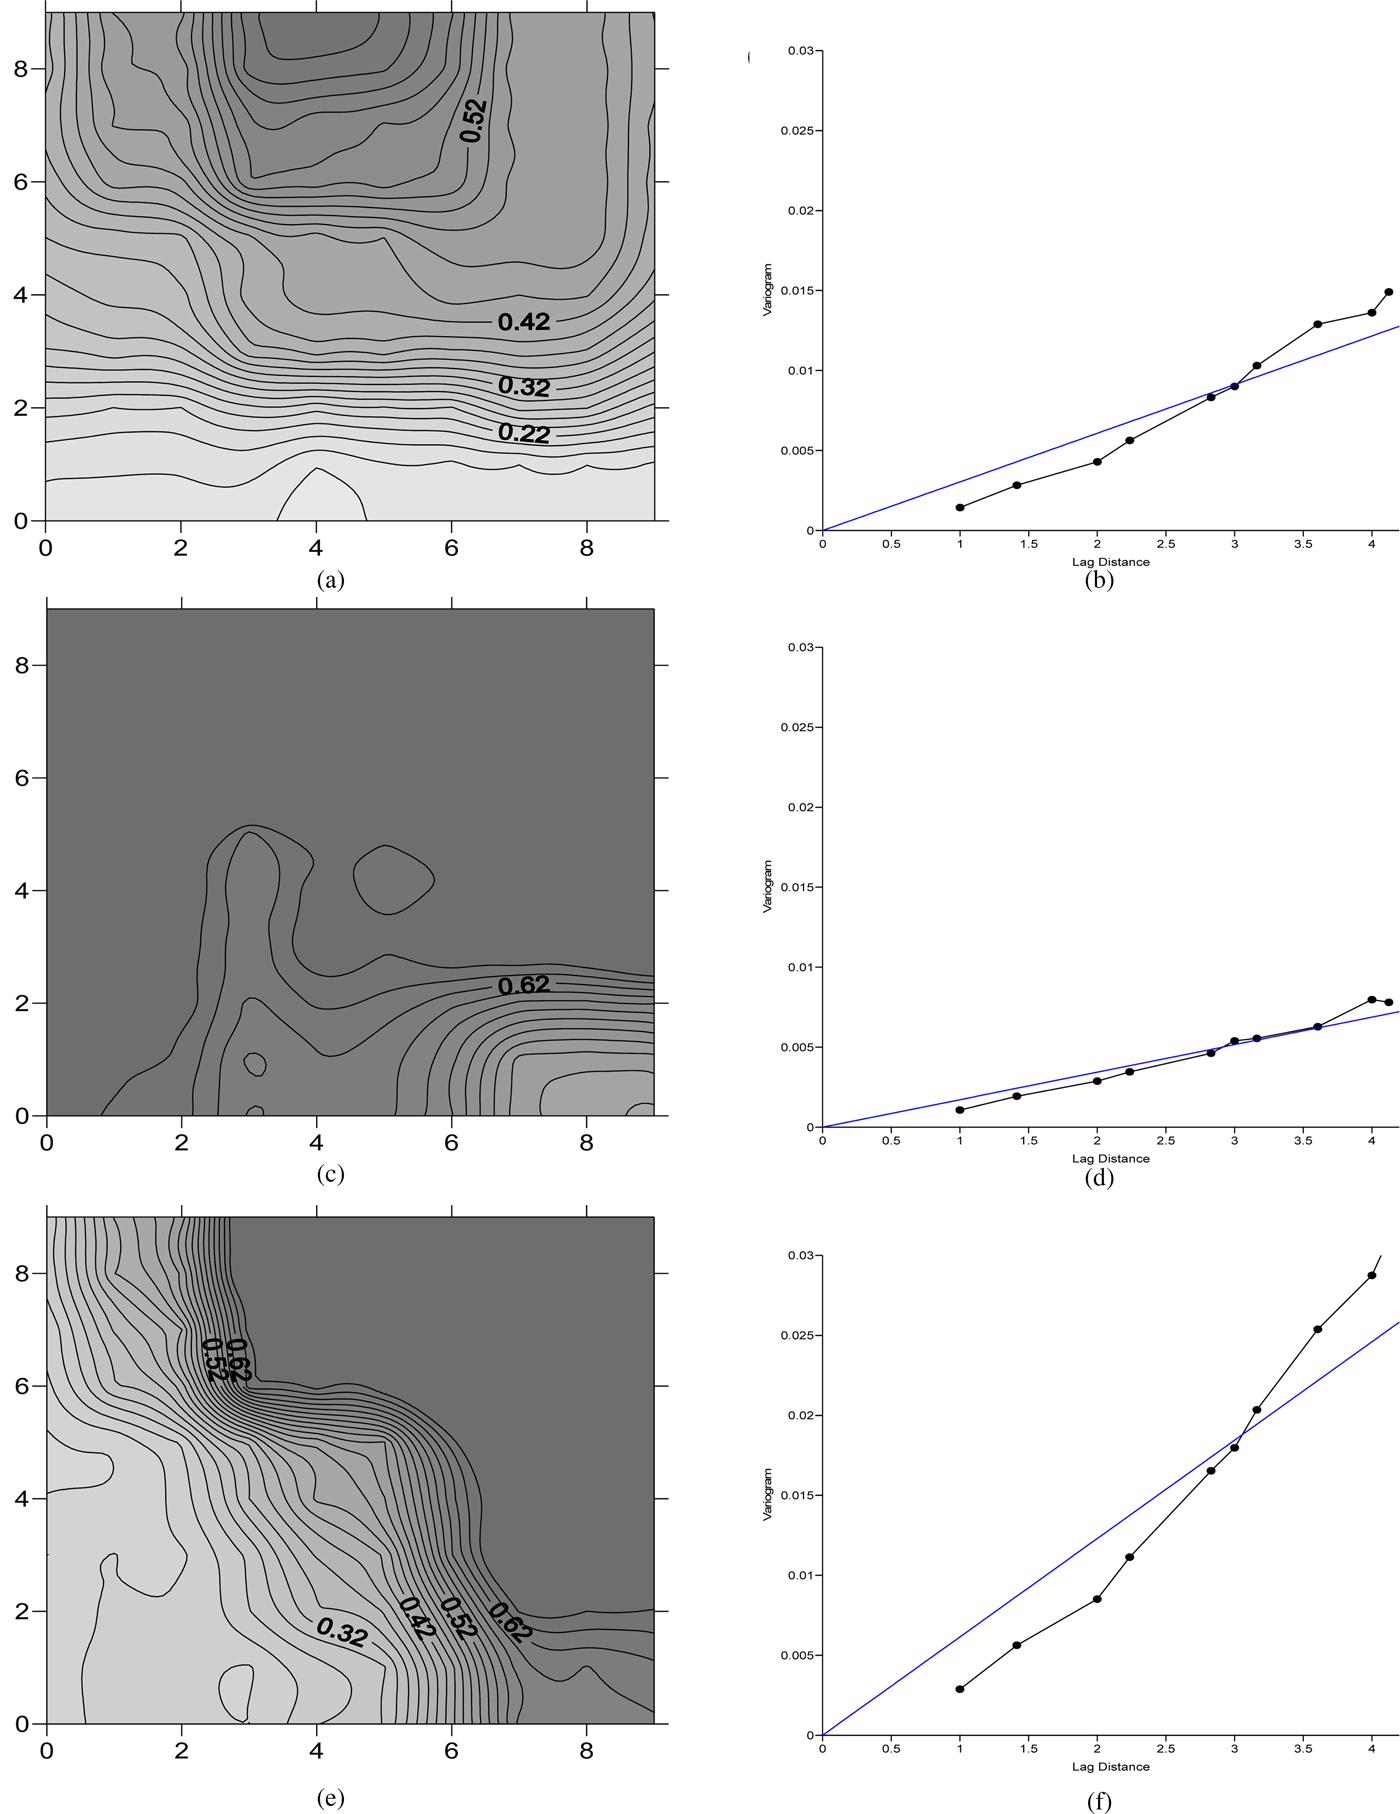
Figure 7 presents the contour map associated with the individual weights associated with input neurons – weight associated with each of the features – and the corresponding variogram spatial analysis. Since input feature vectors consist of normalized features, it is reasonable to expect that if each feature contribution is equally valid upon training, there must appear a set of associated weights that vary accordingly and similarly in a sense showing an equilibrated contribution toward classification. The spatial distribution of weights, according to Figure 7, reflects each feature's importance since each of the features are weighted against these values – if the map shows little spatial variation, it means that this feature is contributing little to the weighted sum of contributions, and therefore one can conclude that the feature under scrutiny does not allow the SOM to perform well. Performing different lag variogram analyses on the contour map of each of the weights associated with input features results in a plot approximately linear – Figure 7e shows the weight distribution map for the vibration frequency band 1 feature and in Figure 7f the corresponding variogram spatial analysis with an additional linear fit onto the attained results. The slope of the linear fit over the variogram quantifies the spatial distribution variability, and therefore provides an objective measure of weight contribution strength toward classification.
Contour maps of features strength and corresponding variogram. Feed force – feature map (a), feed force – feature map variogram (b), sound kurtosis – feature map (c), sound kurtosis – feature map variogram (d), vibration frequency band 1 – feature map (e), vibration frequency band 1 – feature map variogram (f).

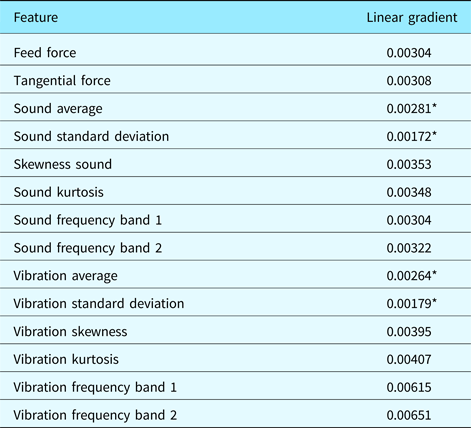
The linear gradient for the different lag distance plot regarding the spatial correlation provided by the variogram analysis is shown in Table 3. All features show an approximate linear fit upon the measured spatial correlation revealing that the SOM neural network is performing well upon training since it managed to map similar feature vectors into nearby areas in the output map. Higher values of the linear gradient reveal stronger features, or otherwise, stronger contributions toward tool wear classification – it should be emphasized that it is upon a weighted sum of all features contribution that a determined classification occur, and therefore higher gradients implicate stronger influence on the results. Surprisingly the cutting forces are not considered to be the strongest features perhaps due to noise or another factor that does not linearly correlate force to tool wear, such as changes in spindle speed due to changes in tool position during cutting.
Linear fit slope for all features

Considering that each feature presented in Table 3 provide different contributions toward tool wear level classification and that higher values of the variogram slope relate to stronger features, a new feature vector was built discarding the weaker features – features with a linear fit slope on the variogram plot under the value of 0.003 were not considered, identified in Table 3 with a star (*). The linear fit slope limit value was obtained interactively to provide best classification performance. Figure 8 presents the output result map of tool wear level classifications performed by the SOM upon training with the reduced feature vector set. The chosen number of epochs, that is, 400, was obtained after performance tests and provides best classification results. These latest results show that the SOM can attain better results considering the precision of obtained classification as shown in Figure 6 and there are also no misclassifications occurring. Results show that a smoother classification map is now attained (Fig. 8) – reduced feature vector – when comparing with the ones obtained with the full feature vector set (Fig. 6), which might indicate a more clear relationship between these features and tool wear level.
Contour map of tool wear state classification after 400 epochs trainings with the reduced feature vector.

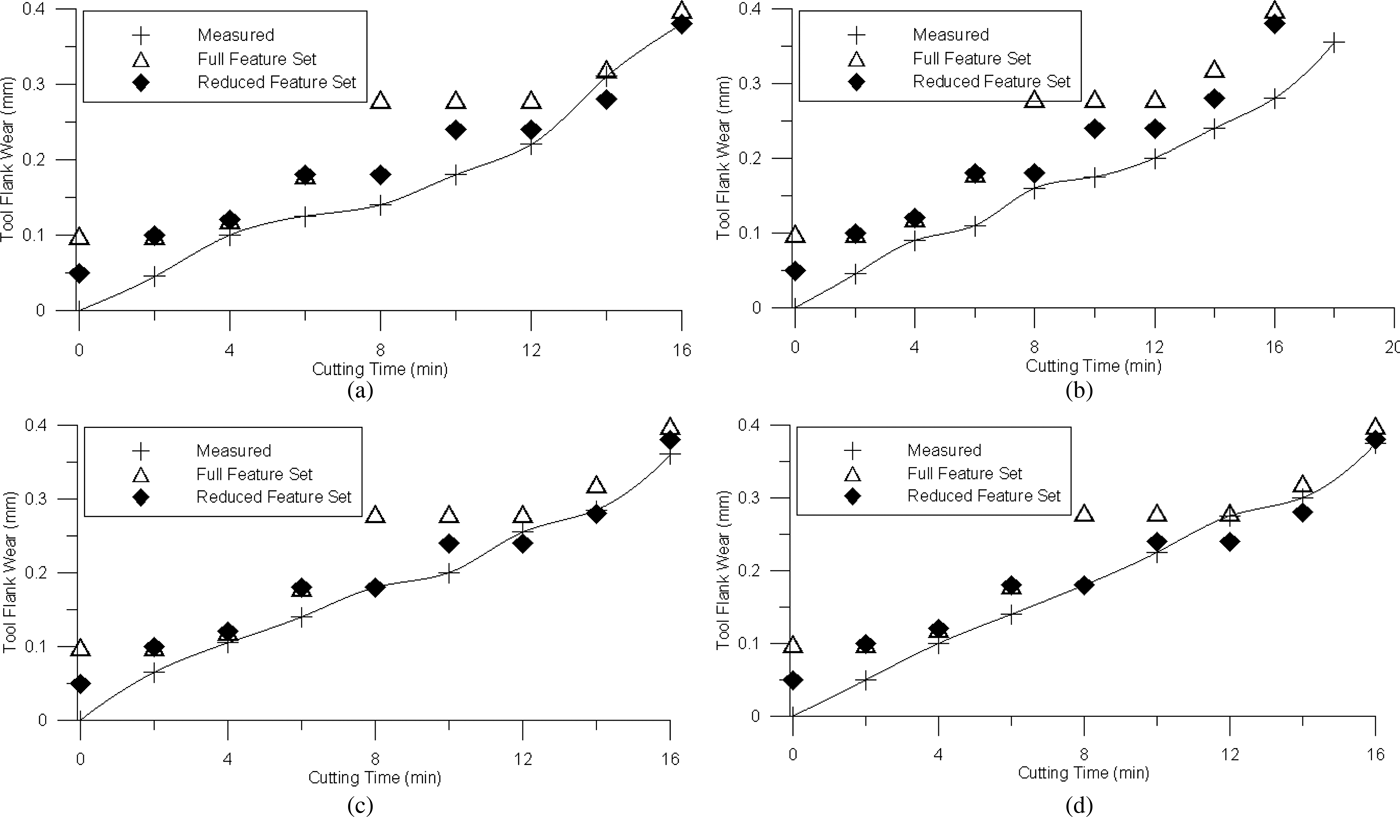
Figure 9 shows the results from the classification of the inserts providing a comparison between the original classification with the full feature set and the classification using the reduced feature set. A different number of training epochs provides slight differences in performance and the best results are attained when using 400 epochs. It can be seen from these that classification improves significantly and that at all tool wear stages, classification gets closer to the measured real value of flank wear. The results indicate that the reduced feature set performs better than the full feature set, and it suggests that those features such as average and standard deviation do not contribute in a positive manner toward condition monitoring suggesting even that they degrade classification.
Compared classification of tool wear level.

Conclusion and further work
A novel method for the evaluation and selection of features for condition monitoring is presented. This method is based on the ability of neural networks to perform modeling of non-linear systems based on noisy data using apparently weak features. Experimental data were acquired under a set of cutting conditions in order to validate the method and the following conclusions were drawn:
• The 14 features evaluated have shown to contribute differently toward tool wear level classification. Skewness and kurtosis from sound and vibration have shown to be stronger features than force features under those noisy conditions.
• The reduced feature vector set selected accordingly to the ranking provided by the presented method outperformed the full feature set revealing that some of the features were adversely contributing toward tool wear level classification.
• Spatial statistics is shown adequate to quantitatively measure the impact of each feature in the two-dimensional output of the SOM.
Further work has to be carried under different cutting conditions in order to legitimate the choice for different features regarding cutting condition monitoring including a more extensive set of features. This method should be further tested in other condition monitoring processes in order to access upon its universality.
Acknowledgement
The work presented was partially supported by Fundação para a Ciência e a Tecnologia, Portugal. Grant Project UID/EMS/04005/2016.
Rui Silva is an Associated Professor in the Engineering and Technology Faculty at Universidade Lusíada - Norte, Portugal. He holds a PhD degree in Mechanical/Systems Engineering from the University of Glamorgan, UK. His current research interests include industrial management, operations management and artificial intelligence. He is cofounder and Principal Investigator of the Engineering and Industrial Management Research Centre since 2006. He is the head of the Engineering and Technology Faculty since 2008.
Steve Wilcox completed his PhD at Heriot-Watt University in 1992 on an EU funded Brite Euram project investigating machine tool wear. He then joined the University of Glamorgan, more latterly this has become the University of South Wales, as a lecturer where he was promoted to Professor in 2003. At the University of South Wales he fulfilled various roles including Head of School (2010 to 2014), led engineering research submissions to the 2008 Research Assessment Exercise and the 2014 Research Excellence Framework and developed teaching collaborations with British Airways and the Hellenic Aerospace Industry in Greece.