Received tradition ascribes the resolution of the Panic of 1907 to a series of efforts to expand domestic liquidity. Our event study analysis shows direct intervention by the French in the U.S. money market ultimately relieved the crisis by providing an ongoing, exogenous source of international liquidity to the American system and changing U.S. equity price expectations.
We test for the U.S. equity market response to information flows regarding domestic and foreign monetary events. Equity prices are selected as indicators of which event is associated with an end to the crisis because as long as equity prices were declining, threats of loan default in the U.S. banking system were still growing. In the period leading up to the 1907 crisis, about half of all bank loans in the United States were secured by stocks in the call loan market (Myers Reference Myers1931, p. 270). O. M. W. Sprague (Reference Sprague1910, p. 301) identifies the sensitivity of the New York Clearing House banks to call loans securitized by stock exchange collateral by noting that 85 percent of the $63 million loan increase among those banks during the crisis were call or time loans. Furthermore, B. Hansen (Reference Hansen2013) notes that time and call loans accounted for half of all trust company assets in 1907. Indeed, the Moore Schley brokerage house, vulnerable because of a concentrated stock position, received a high-profile rescue during the Panic period ostensibly to avoid further problems for its bank and trust company creditors. Thus, falling equity prices could be a channel for spreading bankruptcy among financial intermediaries. Therefore, threats to the banking system would finally abate when equity prices started to rise.
The crash of United Copper stock on October 17, and the ensuing, severe runs on trust companies are renowned events studied by previous scholars of the 1907 Panic, including Sprague (Reference Sprague1910), M. Friedman and A. Schwartz (Reference Friedman and Schwartz1963), J. R. Moen and E. W. Tallman (Reference Tallman1995), Tallman (Reference Moen and Tallman2000), and E. Wicker (Reference Wicker2000). R. Bruner and S. Carr (Reference Bruner and Carr2007) provide a comprehensive rendering of the intricacies of the crash in the stock of United Copper Company, its relationship to the Knickerbocker Trust Company, and the subsequent depositor runs on the Knickerbocker Trust Company, the Trust Company of America, and Lincoln Trust Company. The domestic actions of J. P. Morgan, Treasury Secretary George Cortelyou, and the New York Clearing House banks have been credited for arresting more severe stock declines.
We challenge the conventional wisdom that domestic actions alone were sufficient to change expectations for equity prices. We find that it was the announcement by the Bank of France to accelerate its gold payments directly for U.S. crops, a truncation of the typical “bill-of-exchange” process of trade settlement, that ultimately reversed the downtrend in equity prices. In counterfactual analysis, however, we caution that the French facility would have been unlikely to end the crisis alone. We argue that domestic measures likely provided nontrivial relief, so that when the French announcement came, it was able to finally revise equity market participants’ expectations upward.
Signs of spillover to the French banking and financial systems accompanied the French decision to construct a loan facility in which French bankers could use commercial paper to pay for gold from the French reserve. Furthermore, an analysis of the discussion among the Regents of the Bank of France reveals how the facility was most likely intended to arrest the drainage of French coin in circulation. We conclude that domestic measures to increase liquidity did not by themselves reverse falling equity prices. It took commodity exports with offsetting capital account inflows, specifically shipping U.S. cotton in return for French gold, to provide the exogenous source of liquidity that ultimately improved investors’ expectations and rallied stock prices.
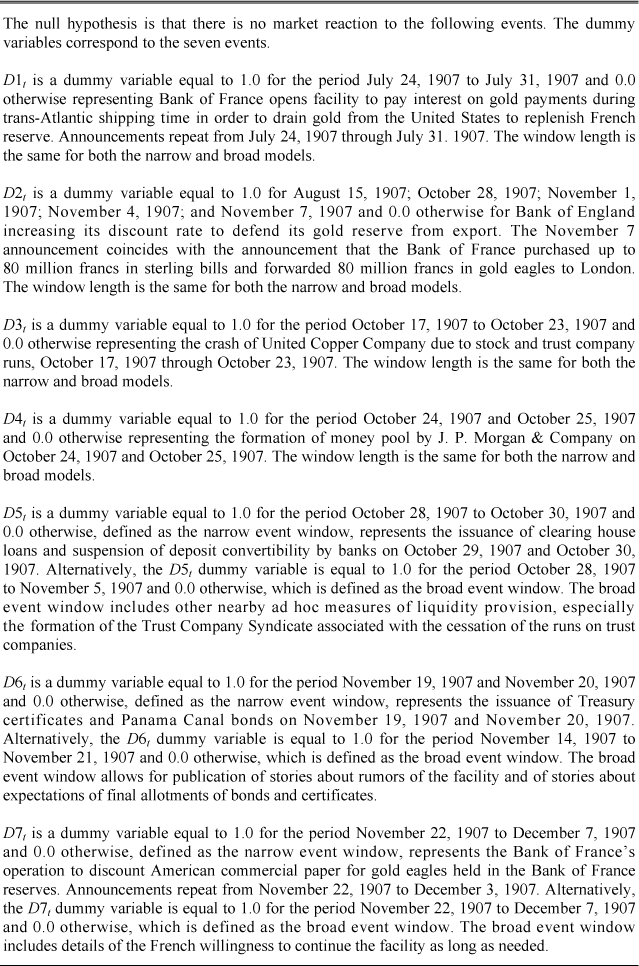
We study seven international and domestic monetary events (see Table 1) to test whether any are associated with changes in U. S. equity prices. We define monetary news as an announcement in the New York Times about central bank policy, gold flows, or other measures that might be expected to impact systemic liquidity conditions. Windows of at least two days are defined to allow for lead and lag effects. Window overlap is avoided. Often, the New York Times dripped details about ad hoc measures over several days as facilities were worked out. In those cases, longer windows are constructed to accommodate longer lag effects. We end the event windows with the news story that imparts substantially most of the new information about the action. We make allowances for our potential errors by designating both a narrow and broad dating of event windows to allow for alternative end points. We estimate two separate models, one using a narrow window length and one using a broader window length to test for robustness of window definitions.
EVENTS ONE AND TWO: ANNOUNCEMENTS BY INTERNATIONAL BANKS TO DEFEND THEIR RESERVES
France and the United Kingdom were actively seeking gold from the U.S. in 1907 to shore up their central bank reserves. The French action to open a facility to draw gold from the United States in July 1907 is examined as Event One and the British action to draw gold from all markets by raising its bank rate is examined as Event Two. Each event should have alerted investors of increasing risks associated with constrained liquidity and higher interest rates. Consequently, investors should have revised their expectations for corporate profits downward and sold equities.
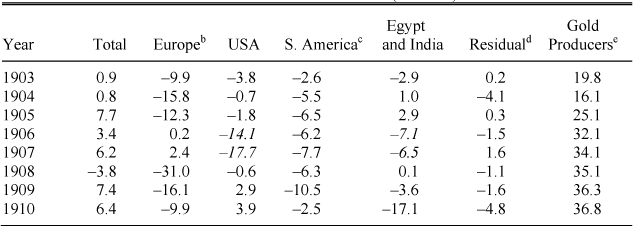
London credit markets began to feel stress long before the U.S. panic began in October 1907. Table 2 portrays the net gold movements in the United Kingdom for the period from 1903 through 1910. Despite receiving more gold from her gold producing colonies in both 1906 and 1907 compared to 1905, London still found it necessary to draw gold in from the European continent to supply the unusual demands for gold from the United States in 1906 and from Egypt, India, and the United States in 1906 and 1907. The U.S. demand for London gold to satisfy claims on British insurance companies arising from the San Francisco earthquake in 1906 is documented by K. Odell and M. Weidenmier (Reference Odell and Weidenmier2004). However, the unusual Egyptian and Indian demands upon London for gold in 1906 and 1907 are less well-understood phenomena (see Appendix Section 1).
SEVEN EVENTS TESTED

Sources:
New York Times, July 24, 1907 through December 7, 1907.
U.K. NET GOLD MOVEMENT (£million)Footnote a

a Source: Board of Trade Annual Abstracts of Statistics from Bank Rate and the Burdens of Adjustment, 1870–1914.
b Europe comprises France, Holland, Germany, and Austro-Hungary.
c South America comprises Brazil, Argentina, and Uruguay.
d Residual = (Total) less (Europe + USA + S. America + Egypt and India + Gold Producers).
e Gold Producers comprises South Africa, Rhodesia, Australia, and New Zealand (Ford 1964).
The Bank of France had experienced a significant reduction in its gold reserve from January through June 1907, partly to alleviate the Bank of England's efforts to support Egypt as shown in Figure 1 (Patron Reference Patron1910, p. 143). Rather than raising its bank rate to attract gold, the French implemented a strategy to draw gold inflows from the United States to France by initiating a special facility on July 24 of paying interest on gold in transit from the United States. The largest gold outflow from the United States in three years happened in July 1907. It matched the year's largest monthly gold inflow to France. For purposes of this study, market participants read stories in the New York Times from July 24 through July 31, which reported how the Bank of France was attempting to restore its reserves by drawing gold from the United States. On August 15, October 28, and November 1, 4, and 7, investors also read announcements in the New York Times about increases in the London bank rate that were meant to protect British gold reserves.
EVENTS THREE THROUGH SIX: ANNOUNCEMENTS OF DOMESTIC MEASURES TO INCREASE LIQUIDITY
Market participants were exposed to news stories from October 17 through October 23 about the severe trust company runs; those dates mark the boundaries of our Event Three. We consider the runs on the trust companies to be a domestic monetary event because they represented a significant withdrawal of liquidity from the banking system.Footnote 1 The announcements should have heightened uncertainty about the reliability of the banking system. Faced with such announcements, it would be logical for market agents to incorporate increasing uncertainty into their evaluation of equity prices.Footnote 2
GOLD COIN AND BULLION RESERVES, BANK OF FRANCE, WEEKLY IN POUNDS, 1906 AND 1907

The formation of the so-called Morgan money pools on October 24 and 25 is the next domestic facility around which we construct our Event Four window. This is the marquee event of the crisis, from which sprang the tradition of attributing the resolution of the crisis to J. Pierpont Morgan. Convening 20 of the 58 Clearing House Association member banks, Morgan convinced them to lend a “pool” of money to floor brokers at the New York Stock Exchange. Lending by the pool temporarily alleviated a settlement crisis on the floor of the New York Stock Exchange, avoiding its threatened closure. Market agents should have reacted positively to the news of a commitment to maintain liquidity at the Exchange.
The Event Five window is constructed around the announcement by the New York Clearing House Association on October 26 to issue Clearing House loan certificates to member banks and to suspend deposit convertibility. The decision of the New York Clearing House Association to issue clearing house loan certificates to its members provided a way in which to settle imbalances of interbank balances. The accompanying decision to suspend payment in defense of banking reserves precipitated more or less complete suspension throughout the entire country. While the decision to suspend payment of coin for deposits dismayed Sprague (Reference Sprague1910), Friedman and Schwartz (Reference Friedman and Schwartz1963, p. 163) took a different view, suggesting the decision to suspend avoided an even more acute hoarding phenomenon. As had been the case in the crises of 1873 and again in 1893, a premium on gold quickly appeared in the market. Acknowledging the thorough research previously done on this event by Sprague (Reference Sprague1910), Friedman and Schwartz (Reference Friedman and Schwartz1963), Moen and Tallman (Reference Tallman1995), Tallman (2000), and Wicker (Reference Wicker2000), this study simply notes the pivotal announcement date of October 26 as a point about which market participants might have altered their expectations of equity prices. In our test for robustness, we extend this window through November 5 to include several more remedial actions including the New York City refinancing, the Moore & Schley rescue and the formation of the Trust Company syndicate.
The announcement by Treasury Secretary Cortelyou on November 18 of the Panama Canal bond issuance marks our Event Six. Some scholars point to it as the event that ended the 1907 Panic (Carosso Reference Carosso1970; Burner and Carr 2007). In an effort to expand the collateral against which banks could issue bank notes, Cortelyou approved the issuance of $50,000,000 in 2 percent Panama Canal bonds on November 17 and the issuance of $100 million one-year 3 percent U.S. Treasury certificates on November 19. On November 16 the New York Times published the rumor that the bonds might be issued and cited November 14 as the day rumors had actually begun to circulate. Between November 17 and 21 negative details about the instruments were printed. Stories about the uncertain legality of the instruments, the inadequacy of the coupons to compete with the currency premium, the necessity of appointing each subscribing bank as a government depository, and the long lead time to coordinate payment and physical production of the bank notes all likely dampened expectations for the facility to bring immediate relief. Doubts may have arisen about what had been intended to be an unambiguously positive government measure to increase liquidity. While the event window could have conceivably been extended to December 1 to allow for the announcement of allotments (which could have overlapped with our Event Seven), we end the window on November 21 when the news of expected allotments was published. Indeed, the issue went significantly undersubscribed with only about 30 percent of the issue purchased (Sprague Reference Sprague1910, p. 316). Therefore, the effect of this event on expectations for equity prices could have been positive for some agents but ambiguous for others.
EVENT SEVEN: THE ANNOUNCEMENT BY THE BANK OF FRANCE TO RELEASE GOLD EAGLES DIRECTLY TO NEW YORK
The announcement by the Bank of France on November 22 to release U.S. gold eagle coins for discounted French commercial paper drawn against U.S. imports informed market participants of an exogenous new supply of gold to the U.S. banking system. At only 60 basis points over deposits, the gold was priced significantly lower than the 300 basis point premium charged early that week in New York. In their announcement, the Regents of the Bank of France emphasized three points. First, the Bank's charter permitted such commercial transactions while purely financial transactions were not permitted. Next, by reducing the supply of French bills of exchange for sale, it would move the French exchange rate against London closer to parity, away from the gold export point. Finally, the facility would diminish the U.S. demand for gold in London, and thus the need for the Bank of England to maintain a high discount rate. Yves Guyot, a prominent French economist of the day, estimated the eventual size of the facility at about $16,000,000 (Guyot Reference Guyot1907, p. 15). Event Seven of our study is constructed around this announcement. First appearing in the New York Times on November 23, details about the repeating transaction appear until December 3, the last day of our window. Our window begins on November 22, allowing for leakage to investors following the decision actually taken late on November 21 in Paris. In our alternative definition of a broad window, the event extends to December 7 to include news about the Bank's commitment to extend the facility as long as the United States needed gold, information about permanence not attached to any other facility during the entire crisis.
THE FRENCH FACILITY
To understand the French facility, we examine conditions in France in some detail. If not overtly spilling over, the U.S. crisis was certainly seeping into France. Indications of liquidity stress in the French banking and financial systems attended the emergence of the U.S. premium on gold. The franc/sterling exchange rate widened and spreads between English and French central bank discount rates widened, both identified as concerns by the Bank of France and examined here. Additionally, albeit not specifically mentioned by the Regents, French stock prices may have revealed incipient spillover of the U.S. crisis to France, discussed in the Appendix Section 2.
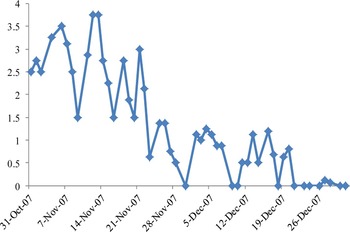
The currency premium made it profitable to export gold to New York even when the currency exchange rate was not at the gold export point.Footnote 3 Figure 2 depicts the daily premium of up to 400 basis points on gold from October 31 through December 30, 1907. U.S. bankers acted to take advantage of the premium by selling dollars to buy sterling to pay for gold in London, and the pound became more expensive. The London/Paris exchange rate was linked by gold standard arbitrage to the New York/London exchange rate.
With sterling high, reaching 25.265 francs on November 21, the franc/sterling exchange was approaching the French gold export point of 25.3 francs; it was becoming cheaper to ship gold to London to settle French purchases of British goods than it was to sell francs and buy expensive sterling bills, the typical mode of trade settlement. Because France did not have a free gold market with large quantities available for export, gold outflows would be from circulating French coin. French circulating medium was indeed declining as the U.S. crisis wore on, dropping from 5.053 billion francs to 4.817 billion between October 31 and November 21.Footnote 4 The potential loss of circulating medium alarmed market agents at the Paris Bourse and others.Footnote 5 Fewer domestic transactions would be supported by diminished circulating medium, hurting French commerce.
DAILY MIDPOINT OF HIGH AND LOW CURRENCY PREMIUM IN PERCENTAGE POINTS

Along with a deteriorating exchange rate, a related indicator of contagion surfaced with the widened spread between the discount rates offered by the Bank of England and by the Bank of France. To protect their dangerously low reserves, the British had increased their bank rate three times after the U.S. premium on gold emerged. The spread between French and British bank rates reached its widest, 300 basis points, after November 7 when the Bank of England raised its rate to 7 percent. After briefly rebounding after the rate increase, British reserves resumed their decline during the week of November 21, dropping from £21,000,000 to £19,900,000.Footnote 6 Further Bank of England rate increases were expected in the face of those declining reserves. France would seek a means to avoid matching those rate increases, after having already reluctantly raised its own bank rate to 4 percent on November 7.Footnote 7 Thus, in justifying the new lending facility, the Regents referred to the U.S. gold premium's influence on both the franc/sterling exchange rate and the bank discount rate.
Finally, we find qualitative evidence consistent with our quantitative evidence. Contagion is explicitly mentioned by Governor Pallain of the Bank and by the Rothschild family, one of whose members was a Regent. Pallain worried that “contagion” of the crisis would spread to Europe and “Paris will have to raise its discount rate.”Footnote 8 Faced with a request for short-term loans to aid a struggling project of their U.S. agent, August Belmont, Jr., the Rothschilds agreed to terms, preventing a situation they likened to the Baring Crisis during which a financial crisis in London spilled over to Paris.Footnote 9 Separately, the impact of the U.S. crisis on French industrial output was reported with the layoff of 200 workers in Limoges as orders from the United States for Haviland porcelain dropped.Footnote 10
Turning now to the question of why November 22, we examine the date of the request by Parisian bankers to the Governor of the Bank and the quick deliberations by the Regents about whether to grant the request. The minutes from the Regents’ November 21 meeting identify only “a diverse group of Parisian bankers” as the party who suggested the specific terms of the facility under consideration. But “Parisian bankers” might have been prompted by U.S. market agents. U.S. cotton exporters in New Orleans had suggested a similar transaction to Treasury Secretary Cortelyou only three weeks earlier, but had been rebuffed.Footnote 11 It is plausible that the French importers reformulated U.S. ideas and passed them along to the Regents as cotton arrived in France.Footnote 12 Alternatively, Parisian bankers who feared the drainage of French coin to London could have approached Governor Pallain.
The Regents reached a decision quickly upon receipt of the request from their constituents, and announced their approval almost immediately. We organize the factors in their deliberations as a cost-benefit analysis. The Regents found the proposal had important costs, but those costs were outweighed by significant benefits. They identified the cost of the facility as the depletion of the gold reserve. Mitigating this cost, the regents were pleased to learn that not much U.S. paper was outstanding in Paris,Footnote 13 meaning the transaction could not deplete the reserve very much.Footnote 14 In a scenario analysis in which the costs of a reduced reserve became unacceptably large, they determined that an increase in the charge for the gold eagles would be their likely policy response.Footnote 15
The consideration of the facility's benefits can be understood as a discussion about the short-term and long-term profits to the Bank, recalling that the Regents were shareholders of the Bank. By charging a modest premium for the gold, the Regents estimated the Bank would earn a small short-term profit and still leave an opportunity for French bankers to make a profit themselves by selling gold to U.S. bankers.Footnote 16 Longer-term profits from economic rents would be preserved for the Bank by garnering political support for the renewal of its charter. Avoiding another rate increase and accommodating the request would maintain good relations with the Bank's constituents.Footnote 17 In hindsight, the facility indeed produced both short- and long-term benefits. If Guyot's estimate of the size of the facility was accurate, then the short-term profits from it may have amounted to 480,000 francs, or 2 percent of 1907 profits. The Bank was decidedly profitable in 1907, earning over 25 million francs.
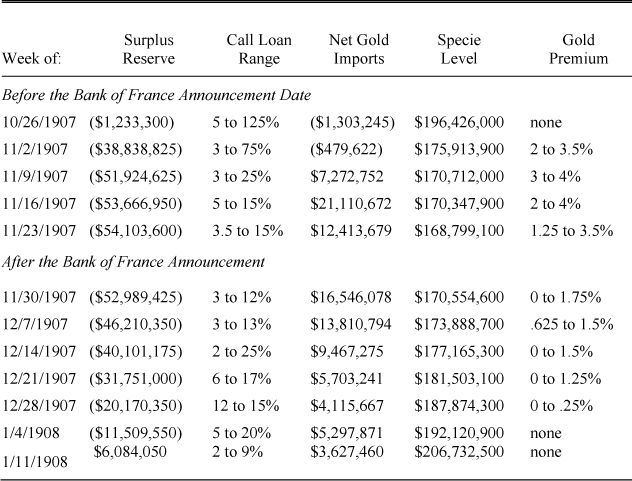
To appreciate the terms of the facility, it is useful to contrast it with the process of how payments for cotton might have otherwise occurred in the presence of a gold premium. French cotton buyers congregated at the Cotton Exchange at Le Havre, the port where almost all of the U.S. cotton supply was received (Forester 1921, p. 55). With a depreciated franc, importers would be motivated to pay for the cotton with gold instead of an expensive bill of exchange.Footnote 18 The buyers could have shipped gold withdrawn from French circulation to the U.S. growers’ New York correspondent banks, earning the gold premium upon deposit, thus reducing their cost of cotton by the net premium earned on gold.Footnote 19 Alternatively, gold to pay for cotton could have been obtained in London by the sale of francs for sterling, exacerbating the depreciation of the franc. The facility simply made it more profitable to use gold from the reserves of the Bank of France to pay for imports rather than to use gold withdrawn from French circulation. Archival evidence reveals that the Regents set the 60 basis point premium for the gold by slightly undercutting the estimated cost to remove gold from circulation.Footnote 20 In other words, in the presence of the premium on currency, gold was going to New York; the Regents simply provided an incentive for gold to go from sterilized reserves instead of from circulation. The decision by the Bank of France preceded by one day the diminution of the currency premium. While contemporaries discussed many factors contributing to the waning premium on gold,Footnote 21 the source of new, low-cost French supply would have figured prominently in its disappearance. With the disappearance of the premium on gold, a prime incentive for hoarding gold was removed, and coins and gold began returning to the banks. The reserves at the New York Clearing House banks began to recover the week after the announcement by the Bank of France as depicted in Table 3.
By accelerating the payment process for cotton, the Regents interrupted a transmission channel for contagion, the continued sale of French bills of exchange for sterling. A new supply of gold might reduce pressure on the Bank of England to increase rates again. We expect that in response to this signal of an unexpectedly early seasonal easing in monetary conditions and of a likely end to bank rate increases in London, market agents’ expectations of future profitability of U.S. companies would be revised upward.
WEEKLY RESERVE DEFICIT AT NEW YORK CLEARING HOUSE BANKS, CALL LOAN RANGE, NET GOLD IMPORTS, SPECIE LEVEL, AND GOLD PREMIUM, OCTOBER 26, 1907 THROUGH JANUARY 11, 1908

Sources:
Commercial and Financial Chronicle (1907).
DATA SET, MODEL, AND RESULTS
To infer the impact of the events outlined in the previous sections on equity prices, we collect daily data on the Dow Jones Industrial Average and Dow Jones Railroad Average indices from The Dow Jones Averages 1885–1985 (Pierce Reference Pierce1986) for the period July 1, 1907 to December 31, 1907 obtained from quotations in the Wall Street Journal. We begin the analysis by first taking the natural logs of the respective indices and examine whether the indices exhibit unit roots. Specifically, we employ the P. Perron (P Reference Perron1997) and E. Zivot-D. W. K. Andrews (ZA Reference Zivot and Andrews2002) unit root tests with allowance for endogenously determined structural breaks. The results of these tests are displayed in Table 4.
UNIT ROOT TESTS
Notes:
Structural break dates denoted in parentheses. Critical values for the Perron (P Reference Perron1997) unit root tests: a(1%) −5.92, b(5%) −5.23, and c(10%) −4.92. Critical values for the Zivot-Andrews (ZA Reference Zivot and Andrews2002) unit root tests: a(1%) −5.34, b(5%) −4.93, and c(10%) −4.58.
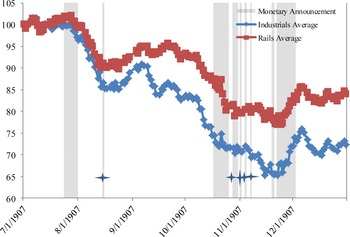
Both the Perron and Zivot-Andrews unit root tests, even in the presence of a structural break, fail to reject the null hypothesis of a unit root for the natural log of the respective indices. However, the null hypothesis of a unit root for the first differences is rejected indicating each index is difference stationary at the 1 percent significance level. The structural break identified using the Perron unit root test is November 25, 1907 and with the Zivot-Andrews unit root test is November 26, 1907. The structural break falls within the time horizon for the Bank of France's operation to discount American commercial paper for gold eagles held in the Bank of France reserve (also see Figure 3).
Given our focus on the seven events outlined previously, we employ a GARCH model to account for the presence of autoregressive conditional heteroscedasticity associated with the residuals (Engle Reference Engle1983; Bollerslev Reference Bollerslev1986). In particular, the GARCH model allows for the impact of the news announcements and the potential for volatility clusters that may emerge as a result of such announcements. Taking into account the dynamic variance of returns predicated on the prior day's information set with a GARCH model may capture a possible cascading effect of such announcements on investors’ expectations for the future.
The mean equation is specified as the respective returns (first-difference of the log of the indices) as a function of seven dummy variables representing the seven events outlined previously in regards to the 1907 Panic

where ΔPt i represents the respective returns for the Dow Jones Industrial Average and the Dow Jones Railroad Average indices; μ is the constant term; and ε t the random error term. In order to test the robustness of the seven events with respect to the dissemination of information, we construct the corresponding dummy variables based on the narrow and broad event windows as discussed in the Introduction. We do not vary the window length for the first four events, because being standard central bank actions or being less complex in nature, information flows were more discrete than for our last three events. Refer to Table 1 for events and dates of dummy variables.
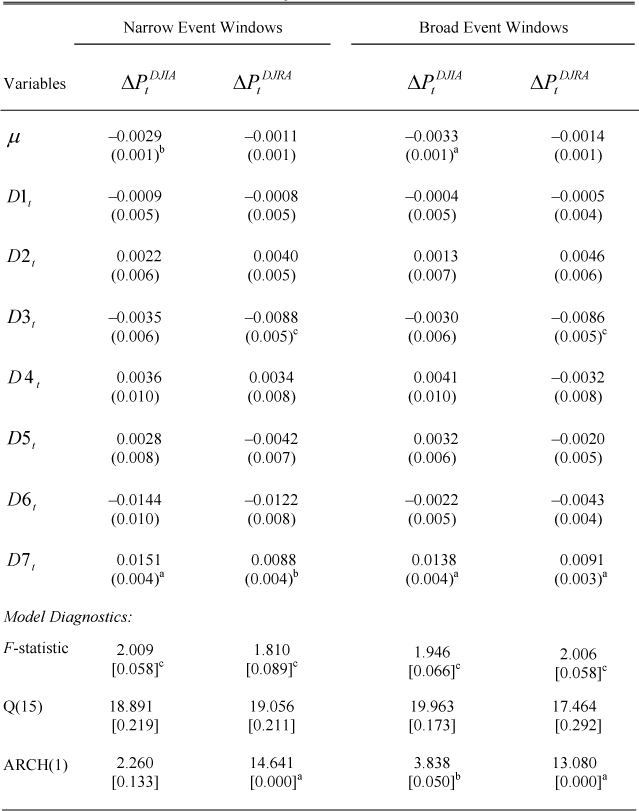
As pointed out by T. F. Cosimano and D. W. Jensen (Reference Cosimano and Jensen1988), the absence of serial correlation is important in the mean equation in order to adequately test for the presence of autoregressive conditional heteroskedasticity in the residuals. Table 5 displays the results for the mean equation for the respective returns based on both the narrow and broad event windows for the dummy variables. Irrespective of either a narrow or broad event window, only the coefficient on the dummy variable, D7t , is statistically significant and positive for the Dow Jones Industrial Average. Likewise, the returns for the Dow Jones Railroad Average yields a positive and statistically significant coefficient on the dummy variable, D7t , as well as a negative and statistically significant coefficient for D3t . Further evaluation of the model diagnostics reveals that both models exhibit predictive power with the statistical significance of the overall F-statistics at the 10 percent level. The residuals from each model are free of serial correlation up to fifteen lags based on the statistical insignificance of the Ljung-Box Q-statistic, Q(15). Though the residuals from the respective models are free of serial correlation, the residuals do exhibit time-varying variance (i.e., autoregressive conditional heteroscedasticity) given the statistical significance of the chi-square test statistics ARCH(1).Footnote 22
With the presence of autoregressive conditional heteroscedasticity, the mean equation is augmented to incorporate the presence of the time-varying variance in the residuals using the GARCH(1,1) specification.

where 

MEAN EQUATION RESULTS

Notes:
Standard errors are in parentheses and probability values in brackets. Significance levels are denoted as follows: a(1%), b(5%), and c(10%). F-statistic is the overall F-statistic for the model. Q(15) is the Ljung-Box Q-statistic for serial correlation up to 15 lags distributed as chi-square. ARCH(1) is the chi-square tests for autoregressive conditional heteroscedasticity.
where equation 2 represents the mean equation for the respective returns and equation 3 the conditional variance equation where  is the condition variance of ε
t
with respect to the information set Ω
t − 1. The moving average component (ARCH term) is εFootnote
2
t − 1 and represents volatility in returns from the previous period. The autoregressive component (GARCH term) is h
Footnote
2
t − 1 and represents the forecast variance of returns from previous period. The sum of the coefficients of the ARCH (α) and GARCH (β) terms in the conditional variance equation determine the persistence in volatility due to shocks. The closer the sum of α and β is to one, the more persistent the shock.
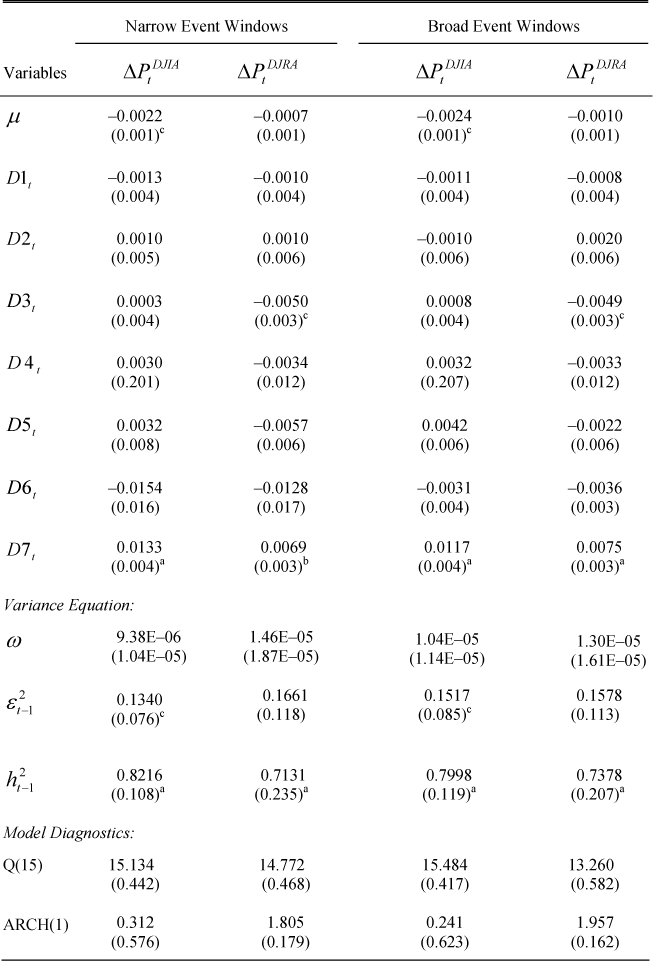
The results of the GARCH(1,1) specifications are shown in Table 6. As in Table 5 and the two event windows, the coefficient for the dummy variable, D7 t , is positive and statistically significant in the mean equation for the returns from the Dow Jones Industrial Average, regardless of the event window. Again, the coefficient for D3 t is negative and statistically significant while D7 t is positive and statistically significant in the mean equation for the returns from the Dow Jones Railroad Average. In the conditional variance equations, the coefficients for the ARCH and GARCH terms differ somewhat between the two returns. In the case of both event windows, the coefficient for the ARCH term in the conditional variance equation for the returns from the Dow Jones Industrial Average is positive and statistically significant at the 10 percent level while the ARCH term in the conditional variance equation for the returns from the Dow Jones Railroad Average is positive but statistically insignificant. As for the GARCH terms for both event windows, both coefficients are positive and statistically significant at the 1 percent level for the respective returns. Furthermore, the residuals are free of both serial correlation and autoregressive conditional heteroscedasticity.
In regards to the events surrounding the 1907 financial crisis, it appears the Bank of France intervention to discount U.S. commercial paper for gold eagles held in the Bank of France reserve provided a positive market reaction to both the Dow Jones Industrials and Railroads. These results are robust with respect to the defined event windows. In addition, the results indicate that the crash of United Copper Company and the corresponding runs on stock and trust companies yielded a greater impact on the Dow Jones Railroads than Industrials. Further evaluation shows that the sum of the coefficients for the ARCH and GARCH terms in the conditional variance equations for the Dow Jones Industrial Average (narrow event window is 0.9556 and broad event window is 0.9515) and the Dow Jones Railroad Average (narrow event window is 0.8792 and broad event window is 0.8956) exhibit a high degree of volatility persistence.Footnote 23 The difference in volatility persistence between the two returns may be attributed to the difference in company composition between the Dow Jones Industrial Average and the Dow Jones Railroad Average. Specifically, the twelve companies comprising the Dow Jones Industrial Average were generally younger companies with shorter trading histories than the twenty companies comprising the Dow Jones Railroad Average, implying perhaps more information asymmetries in the Industrial than in the Railroad stocks, and therefore more volatility. Finally, see Appendix Section 3 for an examination of bid-ask spreads in the equity market, another way to measure whether the French announcement was associated with improving information flow to market participants.Footnote 24
GARCH MODEL RESULTS

Notes:
Standard errors are in parentheses and probability values in brackets. Significance levels are denoted as follows: a(1%), b(5%), and c(10%). Q(15) is the Ljung-Box Q-statistic for serial correlation up to 15 lags distributed as chi-square. ARCH(1) is the chi-square tests for autoregressive conditional heteroscedasticity.
Figure 3 plots the course of the Industrial and Railroad equity index from July 1, 1907, through December 31, 1907. The market bottom is apparent in Figure 3, occurring on November 21. Then an enduring market bottom formed, returns turned positive, and stocks sustained their advance. With the low being registered, increasing stock prices reduced the risk of loan default in the banking system, thus ending the crisis.
DISCUSSION OF RESULTS
It is tempting to interpret our results as support for the notion that domestic actions by Morgan and others had no effect on ending the 1907 Panic. But that interpretation would be naive. A counterfactual discussion of our events sheds light on the relative role played by the French facility for ending the crisis.Footnote 25 Would the facility have been of a sufficient size on its own to have met the liquidity demands in New York? Earlier facilities were substantial. Morgan arranged at least $35 million in liquidity and Cortelyou deposited at least $25 million in government gold to New York banks and urged additional bank note issuance. Additional gold inflows from securities arbitrage have been estimated at up to $12 million (Rodgers and Wilson Reference Rodgers and Wilson2011, p. 52). A. P. Andrew (Reference Andrew1908, p. 458) estimated the substitutes for cash at over $300 million. The reserve deficit of the Clearing House banks reached $54 million at its nadir. Small by comparison, the estimated $16 million release of gold eagles in November was not large enough on its own to have met systemic demands for liquidity. Furthermore, the Bank of France would likely have been unwilling to supply all the liquidity demanded during the Panic even if had it been able.Footnote 26 Our results are probably best interpreted to mean that the reliable seasonal inflows of gold to pay for U.S. crops were meaningfully accelerated, with equity market participants recognizing that the coming tide of gold would be large enough to replenish the U.S. banking system. The fact that the source of acceleration was the central bank with the largest gold reserve likely amplified the strength of the signal.
DAILY CHANGE IN DOW JONES AVERAGES WITH TESTED EVENTS SUPERIMPOSED

The significance of our findings is that the action could have mitigated the contraction in industrial output by shortening the period of convertibility restrictions by several weeks. The New York Clearing House banks’ resumption of deposit convertibility during the week of January 4, 1908 coincided with full reserve restoration, likely aided by the acceleration of gold shipments from the Bank of France.Footnote 27 C. Frydman, E. Hilt, and L. Zhou (Reference Frydman, Hilt and Zhou2012) and J. James, J. McAndrews, and D. Weiman (Reference James, McAndrews and Weiman2013) find linkages between the disruption in intermediation and economic activity in 1907. James, McAndrews, and Weiman (Reference James, McAndrews and Weiman2013) examines the relation between the convertibility restriction period and industrial production, estimating a 5 percentage point larger decline in industrial production for an additional four weeks of suspension when comparing the 1893 and 1907 disruptions. In the absence of the three to five week French acceleration, industrial production might have declined by several more percentage points.Footnote 28 However, as those authors note, it is impossible to precisely isolate the real impact of payments disruptions from other effects of the credit contraction during panics.
While the purpose of this study was to examine the effect of a news announcement on U.S. equity prices, we also illuminated an interesting but neglected episode in French monetary policy formation.Footnote 29 In our quest for background about Event Seven, we found motivations behind the Bank's decision to liquefy sterilized balances, its reserve ratio dropping to 69 percent at the end 1907 from 79 percent in 1905 and 75 percent in 1906.Footnote 30 Curiously, we find no reference in the Regents’ November deliberations about our Event One, the July facility during which France drained gold from New York.Footnote 31 We do not find evidence that they regretted the July draw of gold from New York, nor that the November facility was designed to offset the July action. Finally, we offer a suggestion for why the announcement of the French intervention is largely unknown in the received historiography of the 1907 Panic, especially if it evidently mattered so much to market participants at the time.Footnote 32 Much of what we know about the 1907 Panic is from research done by the National Monetary Commission, the purpose of which was to build public support for the formation of a Central Bank. The public, however, would not have been receptive to a centralized solution such as the model offered by the Bank of France (Wicker Reference Wicker2005, p. 40). Indeed, Senator Nelson W. Aldrich directed research concentration on the Reichsbank because the German model allowed for a more decentralized, banknote issuing system that might work in the United States (Mitchell Reference Mitchell1911, p. 568). Therefore, even though the French facility is mentioned in one of the National Monetary Commission's publications,Footnote 33 it is not surprising that political expediency might have led to the neglect of the facility. Alternatively, in the aftermath of the crisis, the importance of an accelerated arrival of gold may have simply been lost on contemporary researchers.
CONCLUDING REMARKS
The capacity for the Bank of France's announcement to change expectations of market participants for equity prices seems to have been underappreciated by financial historians. In the 1907 crisis, we find that market agents attached significant importance to a meaningfully accelerated seasonal gold inflow to pay for crops. Indeed, recent research indicates that a three to five week shortening of convertibility restriction could have significantly mitigated the decline in industrial production.
The degree to which the Regents of the Bank of France worried about contagion of the crisis also appears to be fresh insight from this study. Prior impressions had been that the Bank had not felt threatened by the crisis. In the presence of the U.S. premium on gold, French policymakers could not prevent gold outflows from circulation, but by constructing the lending facility they could influence the source of the outflows, favoring the liquefaction of reserves over drainage of the circulating coin. A counterfactual analysis of our results suggests that on its own, the facility could not likely have ended the crisis; only by following several domestic efforts undertaken to improve liquidity including Morgan's lionized actions, could the French facility have so significantly revised expectations upward.
Finally, our findings relate to other very recent scholarly work. Drainage of coin in circulation threatened economic output, be it in the U.S. experience examined by James, McAndrews, and Weiman (Reference James, McAndrews and Weiman2013) or in the conversations and calculations of the French Regents. D. Irwin (Reference Irwin2010) examines the powerful effects attendant upon the Regents’ decision in the 1930s to manage their circulating coin; we uncover a powerful effect of the Regents to manage their circulation in 1907. Lastly, while C. Hanes and P. Rhode (Reference Hanes and Rhode2013) study how cotton-related gold flow precipitated crises, we find how one cotton-related gold flow may have relieved a crisis.
Appendix Section 1
In Egypt, the movement of two larger than normal cotton crops, the construction of large port and rail projects, and an associated boom in land and stock prices were factors which would have drained the £13,600,000 gold from London to Alexandria beginning in 1906 (Onyeiwu Reference Onyeiwu2000).Footnote 34 Following the burst in the Egyptian real estate bubble, a failure of a prominent mortgage-lending bank prompted a liquidity infusion from London (Muhleman Reference Muhleman1907). The Bank of England enlisted the aid of the Bank of France for this purpose. In India, the failure of the 1906/07 monsoon rains caused the failure of the wheat and rice crops (Keynes Reference Keynes1909). With its seasonal sources of gold inflows thus interrupted, the Council of India drew down its reserves and then sought credit in the London money markets by selling Council bills. Not until the harvest began in November 1907 and grain exports began to earn gold for India, did the Council's borrowings in London end.
Appendix Section 2
First, an index of prices of four rail stocks, the Northern Railway, Western Railway, Lyons Railway, and the Southern Railway reveal very little volatility for the year.Footnote 35 During the period of the U.S. panic, however, the index displays its most volatile movement in 1907, forming a local bottom on November 14, then rallying to a local peak on December 19. It is possible that market agents anticipated a cyclical contraction in rail profits, brought on by high interest rates, a diminution of circulating medium, and a decline in U.S. demand for French luxury goods. Next, we examine the spread between an index of French commercial bank share prices and the share price of the Bank of France as a proxy for bank counterparty risk in the absence of direct measure for confidence in the banking system.Footnote 36 Anecdotal evidence of counterparty mistrust and of interruption of intermediation channels emerges from several sources.Footnote 37 Furthermore, memories of failures of French commercial banks may have been present in market agents’ assessment of risks. (Hautecoeur and White Reference Hautecoeur and White2011). On the other hand, the spread may only have indicated an increasing expectation of lower bank profitability if the U.S. crisis resulted in fewer business transactions between the two countries.Footnote 38 In New York, the weakness of French bank stocks was attributed to rumors of increasing rates in London and Frankfurt.Footnote 39 The spread reached its widest point, 13.25 percentage points on November 21, the day Parisian bankers sought help from the Regents.Footnote 40 Importantly, the day after the announcement, the spread began to narrow. It declined to 6 percentage points by January 1908 as the Bank of France shares declined and the French commercial bank stocks rallied.
BID-ASK SPREADS AS A PERCENTAGE OF THE BID

Appendix Section 3
Widening (narrowing) spreads would indicate that market makers’ accumulated knowledge was inadequate (adequate) to rule out the presence of informed traders. Wider spreads would indicate greater risk in holding inventory. Wide spreads portrayed in Appendix Figure 1 seem to be associated with days of the Heinz-Morse failure, days of Morgan's money pools, and days after the disappointing reception of Cortelyou's Panama Bond flotation. Spreads seem to narrow after remedial measures, including Event Seven, are announced following dislocations.