Introduction
Climate change is a concern for food security as it might alter the environmental context within which regional agricultural production systems have developed. While food security encompasses consumer access to food and the distribution of raw and processed materials, we consider here the reliability of food production systems (Gregory et al., Reference Gregory, Ingram and Brklacich2005), specifically crop production in temperate regions. At least among those regions integrated into global commodity markets, climate change-driven shifts in food production will largely be ameliorated for consumers as other regions shift production (Lobell and Gourdji, Reference Lobell and Gourdji2012). But food producers must consider how their current systems will respond to climate change, and whether different crops should be considered.
Globally, climate change is characterized by elevated atmospheric CO2 concentration—hereafter, e[CO2]—which has increased dramatically since the beginning of the industrial era, from 277 ppm in 1755 to 391 ppm in 2011; projections for 2100 range from 421 to 946 ppm based on continued rates of greenhouse gas emissions (IPCC, Reference Prather, Flato, Friedlingstein, Jones, Lamarque, Liao and Rasch2013). At a global scale, crop yields are expected to increase in response to e[CO2] as more carbon is available for assimilation (Long et al., Reference Long, Ainsworth, Rogers and Ort2004), although subsequent research has identified several caveats (discussed below).
Global trends might either be dampened or exacerbated locally depending on alteration in regional trends such as moisture availability. At regional levels, climate change is also likely to be characterized by altered hydrological regimes, which in the US Great Plains—as well as other temperate regions—is projected to produce intense, discrete rainfall events punctuated by periods of drought (Sorenson et al., Reference Sorenson, Goldberg, Root and Anderson1998; Smith, Reference Smith2011). Altered water availability affects crop production because primary productivity in the Great Plains is tied to rainfall (Sala et al., Reference Sala, Parton, Joyce and Lauenroth1988; Padbury et al., Reference Padbury, Waltman, Caprio, Coen, McGinn, Mortensen, Nielsen and Sinclair2002) and crop production systems in the Northern Plains, specifically, are largely rain-fed.
A clear understanding of climate change impacts on crop production is confounded by the substantial interaction between climate change components, and the nature of these interactions are again confounded by differences in plant biology. While many studies suggest increased e[CO2] effect mitigates yield reduction due to drought, negative impacts of drought (Wall, Reference Wall2001; Fitzgerald et al., Reference Fitzgerald, Tausz, O'leary, Mollah, Tausz-Posch, Seneweera, Mock, Löw, Partington and McNeil2016), in some plants e[CO2] only enhances physiological performance under otherwise ideal conditions, but not under limited water (Gray et al., Reference Gray, Dermody, Klein, Locke, McGrath, Paul, Rosenthal, Ruiz-Vera, Siebers and Strellner2016; Osborne, Reference Osborne2016).
Differences in photosynthesis can modulate the effect of e[CO2], water, and the extent of their interaction. Although both C3 and C4 plants benefit from lower stomatal conductance under e[CO2], plants with the ancestral C3 photosynthetic pathway are considered more efficient at taking advantage of atmospheric carbon fertilization than C4 species because the C4 pathway separates chloroplasts from ambient air via mesophyll cells, which moderates gas exchange (Long et al., Reference Long, Ainsworth, Rogers and Ort2004). But with the ability to pump CO2 up a concentration gradient, C4 plants can close their stomata to reduce water loss and still continue photosynthesizing, meaning the same anatomical characteristics that limit the ability of C4 species to benefit from carbon fertilization confer an advantage to C4 plants under drought (Edwards et al., Reference Edwards, Osborne, Stromberg, Smith, Bond, Christin, Cousins, Duvall, Fox, Freckleton, Ghannoum, Hartwell, Huang, Janis, Keeley, Kellogg, Knapp, Leakey, Nelson, Saarela, Sage, Sala, Salamin, Still and Tipple2010; Osborne and Sack, Reference Osborne and Sack2012).
Because climate change impacts are complex, many predictions for crop- or region-specific responses are derived from models (Lobell and Asseng, Reference Lobell and Asseng2017). Many such models have been created for major crop species worldwide; species like wheat have been so frequently modeled that a suite of simulations have themselves been summarized in a meta-analysis (Wilcox and Makowski, Reference Wilcox and Makowski2014), which concluded that overall e[CO2] effects should outweigh other impacts from environmental change. But among the challenges to a good model are good experimental data (Tubiello and Ewert, Reference Tubiello and Ewert2002), and many important crop species have limited experimental data, to begin with. Under increasing climate variability, stability in crop production will depend on crops that are resistant to environmental change or the ability to introduce new crops that perform under novel conditions. Thus, crop scientists and producers alike must know how a broad range of crops—across photosynthetic types and functional groups—respond to the primary elements of global environmental change.
Physiological trait measurements are helpful in scaling the effects of the environmental change from the individual plant to broad ecosystem function, and differences in functional characteristics between species can lead to variable trait responses to common conditions (Suding et al., Reference Suding, Lavorel, Chapin, Cornelissen, Díaz, Garnier, Goldberg, Hooper, Jackson and Navas2008). Because plant responses to even singular elements of environmental change, such as drought, are multidimensional (Blum, Reference Blum1996), predicting the consequences of environmental change at an ecosystem level requires measurements of multiple traits across multiple species (Hatfield et al., Reference Hatfield, Boote, Kimball, Ziska, Izaurralde, Ort, Thomson and Wolfe2011). In an annual cropping system, the primary ecosystem function is crop yield, which has a close association with net photosynthesis (Zelitch, Reference Zelitch1982). But multiple physiological traits relate to photosynthesis, and interactions between these traits can dictate their ultimate effect on yield (Mehta and Sarkar, Reference Mehta and Sarkar1992).
Thus, despite the singular function—yield—of annual crops, scaling up the effect of environmental change on individual plants requires measurement of multiple physiological traits related to photosynthesis. Here, we test a suite of annual C3 and C4 grass crops (barley, oats and wheat; maize and sorghum, respectively) and a leguminous and an herbaceous food crop (pinto bean and sunflower, respectively) under controlled conditions to determine physiological responses to e[CO2] and water limitation.
We analyzed these data with a regression approach designed to (1) test for interaction between e[CO2] and water limitation and (2) focus on relative effect sizes of climate change impacts across species. We emphasize here that rather than attempt to simulate the broad gradient of potential field conditions, our experimental design enacted categorical treatments—and in the case of water limitation, a qualitative simulation of drought stress—to identify which species and traits demonstrate sensitivity to e[CO2] and water limitation, and determine whether the effect is positive or negative. This focus on estimating regression coefficients rather than a statistical comparison of means increases the utility of these data for regional crop response to climate change models as mentioned above (Cottingham et al., Reference Cottingham, Lennon and Brown2005).
Methods
Experimental design
We used a Percival PGC-40L2 (Geneva Scientific, Fontana, WI, USA) reach-in growth chamber with [CO2] control. Light intensity inside the chamber was 900 micromoles m−2 s−1 set to a 16:8 diurnal light:dark cycle. Temperature and relative humidity were held to a constant 20°C and 60%, respectively, to reflect average growing season conditions in the study region.
Experimental e[CO2] levels were chosen from projections described by several scenarios provided by the Intergovernmental Panel on Climate Change's Fifth Assessment Report (IPCC, Reference Prather, Flato, Friedlingstein, Jones, Lamarque, Liao and Rasch2013). To focus on crop plant sensitivity to future climate change—rather than current, soon-to-be-historical conditions—we selected three values that represent near-term and long-term atmospheric CO2 concentrations. The first value, 450 ppm, approximates near-term projections for the year 2040 under three IPCC scenarios: RCP2.6, RCP4.5 and RCP6.0, which predict [CO2] of 440, 461 and 451 ppm, respectively. Atmospheric [CO2] is expected to reach our middle value, 575 ppm, by 2075 under RCP6.0 or by 2055 under RCP8.5, while our highest value, 700 ppm, represents the year 2075 projection under the long-term, fastest-increasing scenario RCP8.5 and is just above the moderate RCP6.0 scenario's 670 ppm projection for the year 2100 (IPCC, Reference Prather, Flato, Friedlingstein, Jones, Lamarque, Liao and Rasch2013).
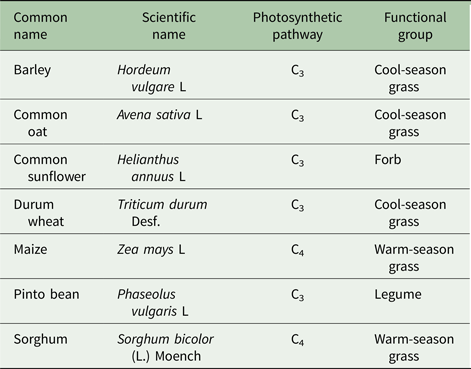
We selected a suite of annual crop species important to both the US Northern Great Plains—one of the most diverse cropping regions in the country—as well as globally-important crops used in other temperate regions worldwide (Table 1). We also focused on a selection of crops representing physiological and functional diversity, including C3 and C4 photosynthetic pathways, warm- and cool-season growth periods, and grasses, legumes and forbs (Table 1). Unfortunately, a broader range of crops was attempted than is reported here; three species—lentils Lens culinaris, Mexican grain amaranth Amaranthus cruentus, and quinoa Chenopodium quinoa—failed to grow under the 700 ppm treatment, and with insufficient plant material to sample, they were excluded from analysis. Proso millet Panicum miliaceum generally failed to germinate and was excluded entirely from the study.
Annual crop species included in growth chamber study, identified by photosynthetic pathway and functional group

We conducted one complete experimental round (i.e., 4 weeks of growth for replicated pots of all species followed by measurement and harvest) per e[CO2] level and each round was split by a soil moisture treatment. Ten days prior to each round, for each species, 30 pots with 10 cm diameter and 10 cm depth were filled with standard 75% sphagnum moss per perlite growth media and seeded with at least five seeds. Plants were allowed to germinate in the greenhouse under 20°C air temperature and ambient light and CO2 conditions; after approximately 7 days pots were thinned to a single individual. After 10 days, we randomly selected 20 pots per species from among those of the 30 with established seedlings and randomly assigned 10 pots per species to each of the two soil moisture treatments in the growth chamber.
Due to difficulty in regulating individual pot soil moisture in the growth chamber, we modified an approach for categorical water treatments (McGranahan and Yurkonis, Reference McGranahan and Yurkonis2018) designed to simulate reduced frequency of substantial precipitation events as predicted by regional climate change models. A ‘Full water’ group received three soil-soaking watering events per week—Monday, Wednesday and Friday—while a ‘Water-limited’ group received 2 weekly soil-soaking events—Monday and Thursday—to allow soil dry-down.
To ensure soil moisture conditions differed between our categorical water treatments, we regularly measured soil moisture from 15 soil-only pots per water treatment, which we aggregated into 5, 10 cm diameter × 12 cm deep pots per water treatment and measured volumetric soil water content with a HydroSense II volumetric water content meter (Campbell Scientific, Logan, UT, USA) with 12 cm probes; the full-water treatment averaged 45% VWC (±1.3 s.e.) after its longest dry-down period (3 days post-soaking) while the water-limited treatment averaged 15% VWC (±2.8 s.e.) after its 4-day dry-down period. Due to unquantified differences in transpiration between species and developmental stages, actual soil moisture in experimental pots was likely less than these values, but such monitoring confirmed qualitative differences between the full-water and water-limited treatments.
Data collection
After 4 weeks in the chamber, we measured two non-destructive physiological variables followed by two additional destructive variables. Non-destructive physiological measurements were taken immediately upon removal from the chamber from the top three developed leaves of each plant and averaged for a plant-level mean for each parameter. These response variables include the following:
• Chlorophyll content is the density of photosynthetic pigments present in an area of the leaf, which is a measure of the plant's ability to assimilate carbon, grow and produce fruit. Drought stress reduces chlorophyll content (Nyachiro et al., Reference Nyachiro, Briggs, Hoddinott and Johnson-Flanagan2001; Mafakheri et al., Reference Mafakheri, Siosemardeh, Bahramnejad, Struik and Sohrabi2010). We measured leaf chlorophyll content as Chlorophyll Fluorescence Ratio, or fluorescence emission ratio of intensity at 735 nm/700 nm, with an Opti-Sciences CCM-300 (Opti-Sciences, Inc, Hudson, NH, USA).
• Photosynthetic yield relates to the efficiency of plants in assimilating carbon and has a positive correlation with crop yield (Fischer et al., Reference Fischer, Rees, Sayre, Lu, Condon and Saavedra1998). Water stress can reduce photosynthetic rate and efficiency (Kawamitsu et al., Reference Kawamitsu, Driscoll and Boyer2000; Nyachiro et al., Reference Nyachiro, Briggs, Hoddinott and Johnson-Flanagan2001), with subsequent negative impacts on crop yield (Vanaja et al., Reference Vanaja, Maheswari, Sathish, Vagheera, Jyothi Lakshmi, Vijay Kumar, Yadav, Razzaq, Singh and Sarkar2015). We measured quantum yield of photosystem II with an Opti-Sciences OS1p (Opti-Sciences, Inc, Hudson, NH, USA).
Following non-destructive measurements, we separated aboveground biomass from belowground biomass at the growth media surface and collected data for the following destructive measurements:
• Leaf area, the total two-dimensional size of individual leaves, represents the functional amount of plant tissue exposed to the sun for photosynthesis and stomata available for gas exchange. Both drought stress and e[CO2] decreases gas exchange by inducing lower leaf area (Anyia, Reference Anyia2004; Faralli et al., Reference Faralli, Grove, Hare, Kettlewell and Fiorani2017). We measured the leaf area of the three top-most developed leaves with a bench-mounted LI-3000C leaf area meter fitted with an LI-3050C transparent belt conveyor (LI-COR, Inc, Lincoln, NE, USA).
• Root:shoot ratio describes biomass allocation between belowground and aboveground tissue. Previous research suggests greater R:S under drought stress as plants invest in water-acquiring versus water-losing organs (Blum and Arkin, Reference Blum and Arkin1984; Liu and Stützel, Reference Liu and Stützel2004), whereas e[CO2] has been shown to increase allocation to aboveground biomass (Ziska and Bunce, Reference Ziska and Bunce1997; Hager et al., Reference Hager, Ryan, Kovacs and Newman2016). We collected belowground biomass by washing the contents of each pot individually with high-pressure water through a fine stainless steel sieve and collecting all root material. All plant biomass—separated into one aboveground and one belowground paper envelope per plant—was dried at 50°C for 48 h and weighed to calculate root:shoot ratio for each plant.
Data analysis
To highlight the relative effects of e[CO2] and water limitation for each annual crop species, our statistical analysis focused on estimating regression coefficients and associated confidence intervals to determine effect size, rather than null hypothesis significance testing of group means (Nakagawa and Cuthill, Reference Nakagawa and Cuthill2007; Rinella and James, Reference Rinella and James2010), as applied to perennial grasses in a similar growth chamber experiment (McGranahan and Yurkonis, Reference McGranahan and Yurkonis2018). Prior to regression modeling we matched data distribution models to each response variable based on the nature of the data and support for distributions. Because photosynthetic yield ranges from zero to one, we modeled these data with a beta distribution using the betareg function in the betareg package for the R statistical environment (Cribari-Neto and Zeileis, Reference Cribari-Neto and Zeileis2010; R Core Team, 2016). All other response variables were modeled with generalized linear models using Gamma distributions with the glm function in R.
Analysis began with an information-theoretic model selection approach to determine whether e[CO2] and water limitation had interactive effects (Burnham and Anderson, Reference Burnham and Anderson2002; Symonds and Moussalli, Reference Symonds and Moussalli2011). For each response variable within each species, we defined a candidate model set consisting of five regression models: a null, intercept-only model; two single regression models each with e[CO2] and water limitation; a multiple regression model with e[CO2] and water limitation as additive terms; and a multiple regression model with e[CO2], water limitation and interaction term between these variables. We then calculated AICc statistics for each model and ranked them by cumulative model weight using the aicctab function in the AICcmodavg package in R (Mazerolle, Reference Mazerolle2015). We identified species-variable model sets for which the interactive regression model was either the top-ranked model or was competitive with the top-ranked model, i.e., was within three AICc values of the top-ranked model.
When the interactive model was top-ranked or competitive, we assessed the influence of the interaction on the response variable via visual inspection of interaction plots to determine whether the interaction was a crossover interaction—i.e., whether the relationship between the two variables was reversed depending on the level of one term, or simply whether the interaction simply described a dampened or exacerbated but otherwise consistent relationship between e[CO2] and water limitation (VanderWeele and Knol, Reference VanderWeele and Knol2014). In the case of crossover interactions, conclusions on the individual effects of e[CO2] and water limitation are confounded, and as such are clearly identified in our Results.
To quantify the relative effect of e[CO2] and water limitation, we extracted model-averaged beta coefficients of regression parameters and associated 95% confidence intervals from all non-interactive models in the above model sets for each species-response variable combination using the aiccmodavg function in the AICcmodavg package for R. Beta coefficients effectively report an effect size for each regression term, giving the sign and magnitude of the effect; when 95% confidence intervals do not overlap zero, the effect is considered significant (Nakagawa and Cuthill, Reference Nakagawa and Cuthill2007; Rinella and James, Reference Rinella and James2010). Because e[CO2] is a three-level categorical variable in this study, beta coefficients are calculated separately for both 575 and 700 ppm and each value is to be interpreted independently with respect to the baseline 450 ppm (rather than an additive effect from 575 to 700 ppm), although the difference between beta coefficients for 700 and 575 ppm can be interpreted as the marginal effect of the increase. As a two-level factor, a single beta coefficient for water limitation is returned by each model and represents the effect of simulated drought independent of e[CO2]. Complete R script is available in Appendix 1.
Results
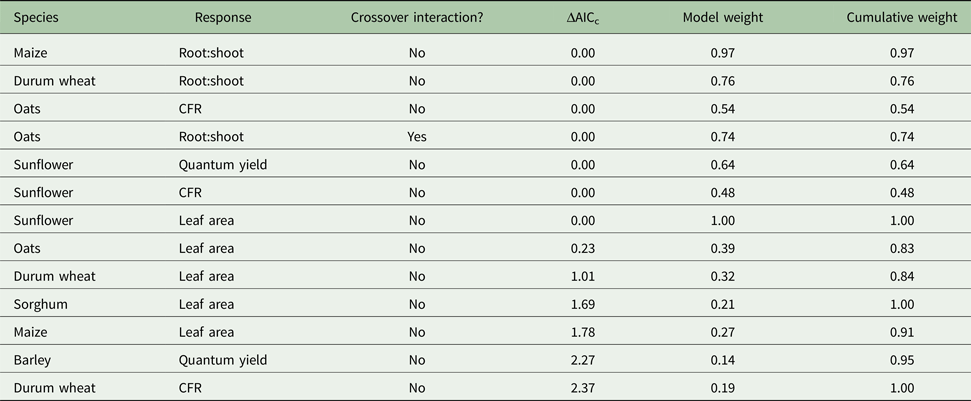
We found statistical evidence of an interaction between e[CO2] and water limitation on several physiological parameters across six of our seven study species, but substantial crossover effects were only apparent in a single model (Table 2). Of 28 regression model sets compared across all four response variables for all seven species, the model with an interaction term between e[CO2] and water limitation was the top-ranked model in seven sets and competitive (ΔAICc < 3.00) in six others. We observed no pattern in terms of which species or which physiological response variables were prone to interaction effects, although notably, pinto bean was the only species without a single trait showing such an effect. In terms of crossover interactions, in which the effect of water limitation is reversed from one e[CO2] level to another, only one model—root:shoot ratio among oats—were so confounded (Fig. 5, Appendix 2). As such, the main effects of e[CO2] and water limitation on root:shoot ratio in oats in this study cannot be directly interpreted.
Regression models in which the multiple regression model that included an interaction term between e[CO2] and water limitation was either the top-ranked (ΔAICc = 0.00) or competitive (ΔAICc < 3.00) model among candidate model sets in AICc-based model selection.

Models are ordered by their rank within candidate model sets (ΔAICc) and identified by the crop species and response trait of the model set. Crossover interactions are those in which the nature of the relationship between the response variable and water limitation depends on the level of e[CO2]; non-crossover interactions do not switch the relationship but the effect of water limitation on the response variable might be dampened or exacerbated at different e[CO2] levels (see Fig. 5, Appendix 2). Model weights give the relative importance of the individual model to the candidate model set, while cumulative weight sums the weight of the listed model and those models ranked above it in the candidate model set (see Table 1, Appendix 2).
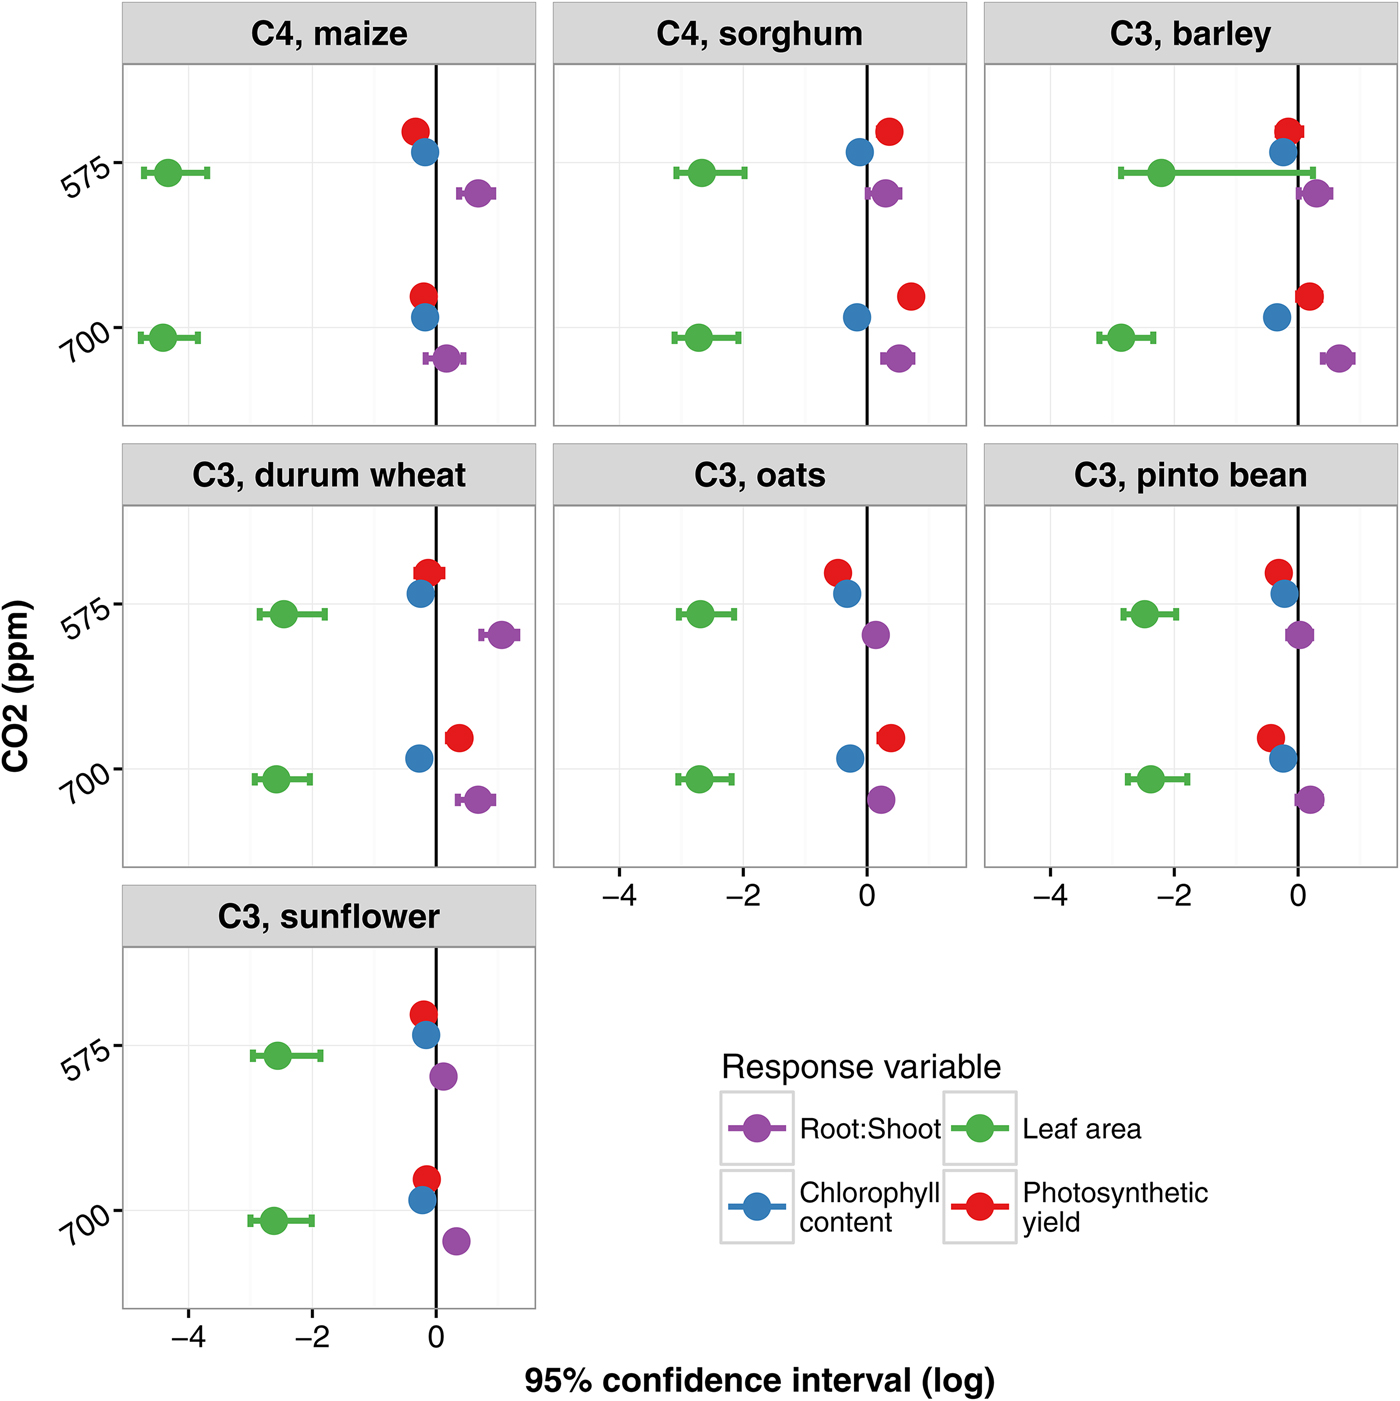
All species responded to e[CO2], with the most substantial effect driven by the increase from 450 to 575 ppm (Figs. 1–4, Appendix 2). For most response variables across most species, a further increase from 575 to 700 ppm had zero to marginal continued effect. Across all species, leaf area had by far the strongest response, decreasing as [CO2] levels increased (Fig. 1). Chlorophyll content also declined with e[CO2], while root:shoot ratio tended to increase, although the significance of this latter effect varied by species and e[CO2] level (95% CIs overlapped zero for at least one e[CO2] level per species, except for durum wheat, which showed the greatest response in root:shoot ratio) (Fig. 1). Quantum photosynthetic yield was the least consistent response, both among and within species (Fig. 1). Photosynthetic yield was the only trait to show non-zero decreases (maize, pinto bean), non-zero increases (sorghum) and a reversal of response at the two different e[CO2] levels (oats). As noted above, the root:shoot response for oats was the only crossover effect in which the interaction between e[CO2] and water limitation confound the interpretation of their main effects.
Estimated beta coefficients and associated 95% confidence intervals for two levels of e[CO2] from multiple generalized linear regression models testing four physiological parameters against e[CO2] and water limitation (see Fig. 2) for seven annual crop species. Species are labeled first by photosynthetic pathway followed by a common name. Note that due to the large magnitude of leaf area effect sizes, all data have been plotted on a log scale.

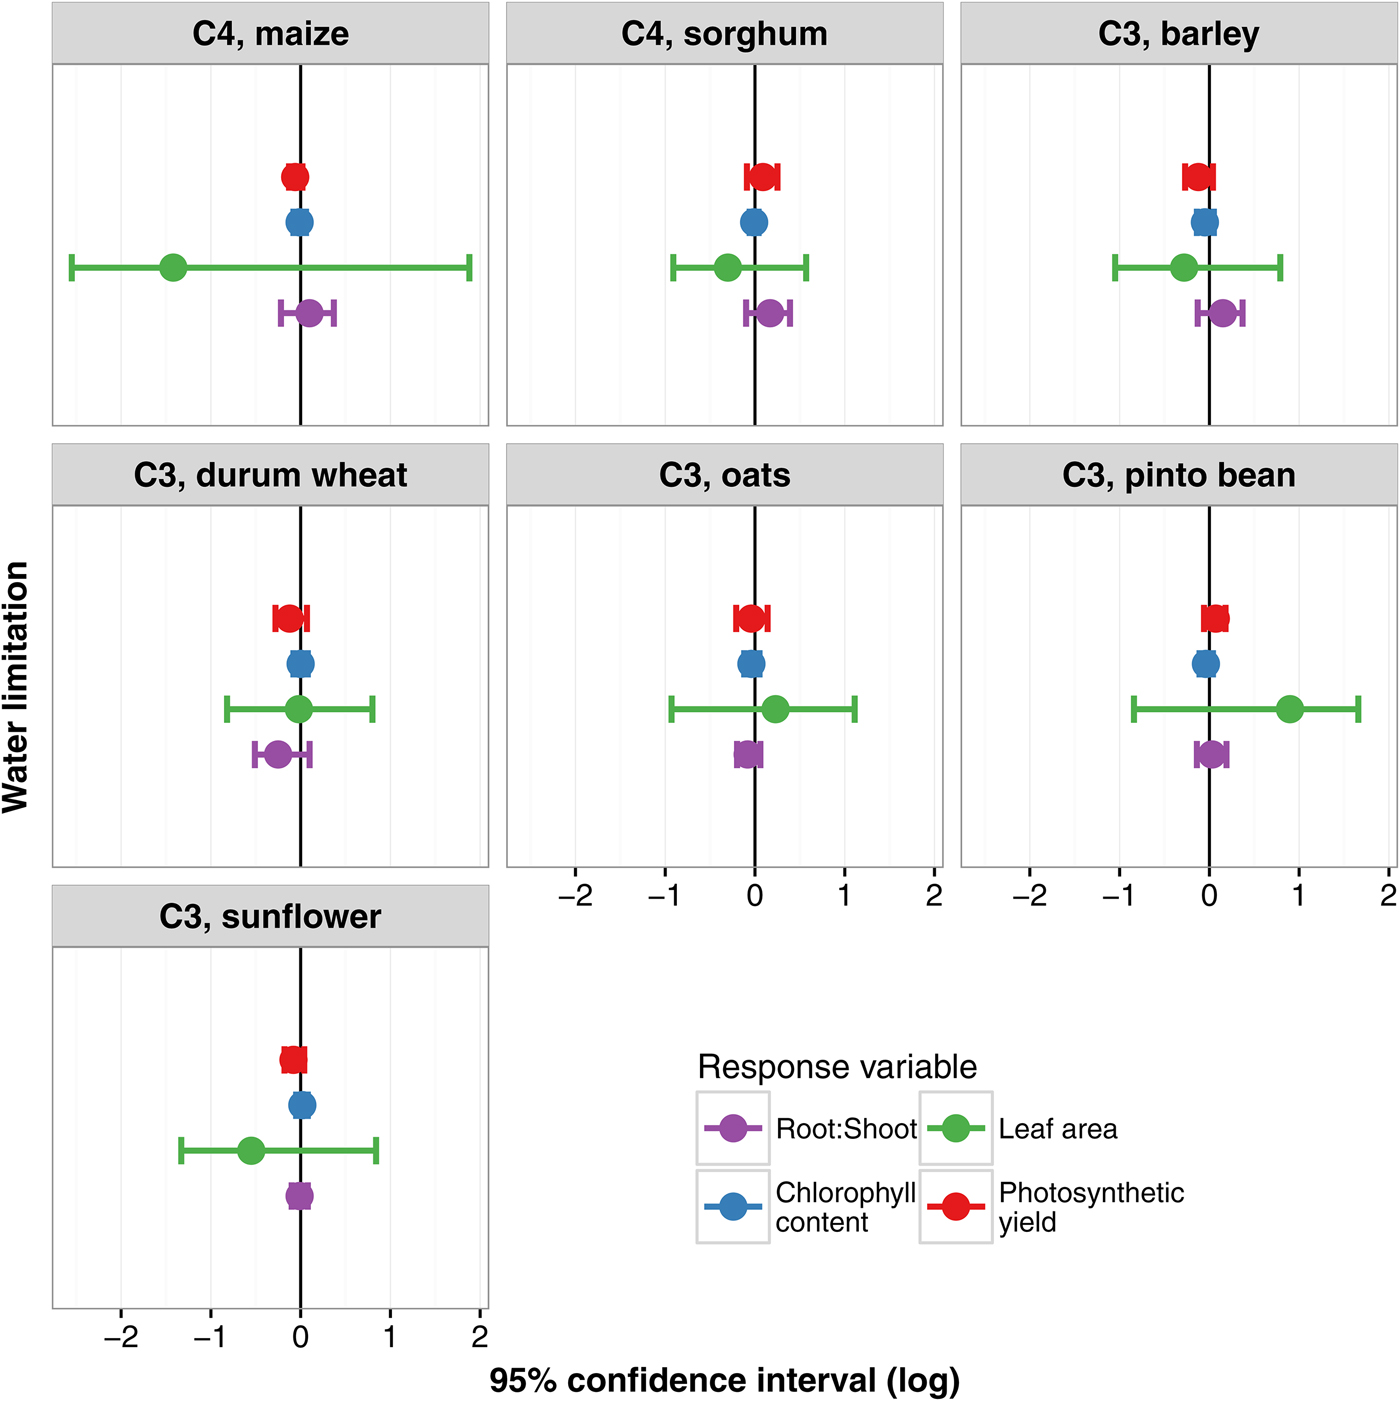
Estimated beta coefficients and associated 95% confidence intervals for the water limitation term from multiple generalized linear regression models testing four physiological parameters against water limitation and e[CO2] (see Fig. 1) for seven annual crop species. Species are labeled first by photosynthetic pathway followed by a common name. Note that due to the large magnitude of leaf area effect sizes, all data have been plotted on a log scale.

Discussion
Overall, all species in this study showed at least one response to e[CO2], lending support to existing claims that, should the industrial-age trend of atmospheric CO2 increases continue, the plants humans rely upon for food will be affected physiologically. Furthermore, we found these responses were most pronounced between 450 and 575 ppm, which represent certain near-term/conservative long-term levels and moderate long-term levels, respectively (IPCC, Reference Prather, Flato, Friedlingstein, Jones, Lamarque, Liao and Rasch2013); only marginal responses occurred between 575 to 700 ppm, which represents an extreme long-term projection. These results suggest an obvious threshold beyond which any atmospheric fertilization effect is negated or even reversed, and our data suggest this threshold occurs at the lower end of projected atmospheric CO2 concentrations.
A trait-based approach to environmental change facilitates scaling responses from individual plants to functional responses at the ecosystem level (Suding et al., Reference Suding, Lavorel, Chapin, Cornelissen, Díaz, Garnier, Goldberg, Hooper, Jackson and Navas2008). Because the primary functional response in annual cropping systems is often yield, we measured plant traits that affect photosynthesis, which has a close relationship with crop yield (Zelitch, Reference Zelitch1982). More specifically, the physiological variables used here relate to either the amount of light intercepted by plants, or how efficiently intercepted light is used (Monteith and Moss, Reference Monteith and Moss1977).
By far the strongest and most consistent response among the four physiological variables we measured was a substantial reduction in leaf area under e[CO2], which in terms of performance corresponds to reduced light interception and indicates lower biomass productivity. Our results are contrary to those from Faralli et al. (Reference Faralli, Grove, Hare, Kettlewell and Fiorani2017), who showed increased and leaf area in rape/canola Brassica napus as [CO2] increased from 300 to 700 ppm. Leaf area responses are reported to be quite variable, even within a genus; e.g., work from three Populus species concludes that e[CO2] drives leaf area through expansion of the cell wall, but there are different specific cellular mechanisms by which e[CO2] affects leaf growth (Ferris et al., Reference Ferris, Sabatti, Miglietta, Mills and Taylor2001).
We observed no difference between C3 and C4 species in any trait response. In theory, the ancestral C3 photosynthetic pathway is better suited to advantageously assimilate additional ambient atmospheric carbon than the C4 pathway, which is moderated by the transfer of carbon through the mesophyll cells (Bond and Midgley, Reference Bond and Midgley2000; Long et al., Reference Long, Ainsworth, Rogers and Ort2004). But differences across photosynthetic pathways are not always apparent: In natural systems, enhanced productivity for C3 versus C4 species under e[CO2] has only been shown across broad functional and taxonomic groups like woody plants versus grasses (Kgope et al., Reference Kgope, Bond and Midgley2009), and not across C3 and C4 grasses (Wand et al., Reference Wand, Midgley, Jones and Curtis1999). At play in the case of our data might be our focus on high to very high CO2 increases, as the fertilization effect appears to diminish as e[CO2] increases from 450 to 700 ppm and above (Lloyd and Farquhar, Reference Lloyd and Farquhar1996).
Unexpected in our data was the lack of response to water limitation. Drought is obviously one of the most important constraints to agricultural production, as it has been for centuries, but none of our species showed an effect of water limitation at any CO2 level (Fig. 2). However, assessing variability among the physiological traits might offer insight. For example, despite no consistent, non-zero effects, each species showed substantial variability in leaf area (wide 95% CIs, Fig. 2), which indicates variation in effectiveness of—and biomass response to—the water-limitation treatment. Reflecting this variability, Faralli et al. (Reference Faralli, Grove, Hare, Kettlewell and Fiorani2017) showed temporal variation in rape/canola leaf area under drought stress despite a clear increase under full water availability. Our other three responses did not show such wide variability, indicating that even when aboveground biomass accumulation is affected by a degree of water limitation, physiological parameters related to light use efficiency are not necessarily affected in kind (Monteith and Moss, Reference Monteith and Moss1977).
Overall, the water limitation component of our study appeared not to simulate drought stress, likely because we could not simulate drought conditions without totally desiccating soil and roots in small pots. This difficulty in imposing drought stress precisely underscores the challenges of reproducing even a few important variables under controlled conditions, not to mention other environmental variables that affect crop production. For example, under field situations, drought imposes additional stress on crop plants by lowering relative humidity and increasing moisture loss through both evapotranspiration and evaporation from the soil directly. To focus on e[CO2] and water limitation, we held relative humidity constant.
We also held constant a related variable: air temperature. On one hand, warming is an important component of global environmental change and air temperature has been widely shown to affect crop production (Deryng et al., Reference Deryng, Conway, Ramankutty, Price and Warren2014; Ruiz-Vera et al., Reference Ruiz-Vera, Siebers, Drag, Ort and Bernacchi2015). On the other hand, the focus of our study was on individual crop response to the conditions a producer cannot manage—global [CO2] and local hydrological regimes—while species can be avoided or adopted as local temperature zones change. While simulating a cooler nighttime period might have an unquantifiable absolute effect on plant physiology versus holding air temperature constant, our analysis focuses on calculating relative effect sizes of focal variables (e.g., McGranahan and Yurkonis, Reference McGranahan and Yurkonis2018).
The stability of food production at local and regional scales is essential for continued financial viability of producers, not to mention the supply aspects of food security. Stability is widely associated with resilience—often defined as the return of a property to a reference state following a temporary disturbance—but when considering the stability of food production, agroecologists might put greater emphasis on resistance, or remaining unchanged despite perturbation (Grimm and Wissel, Reference Grimm and Wissel1997). In their study of many species’ responses to e[CO2], Temme et al. (Reference Temme, Liu, Cornwell, Cornelissen and Aerts2015) concluded that ‘winners always win,’ which might explain our lack of observed negative physiological responses across domestic crops grown under conditions that failed to be sufficiently stress-inducing. But on the other hand, novel conditions created by climate change alter the context under which many modern crops—the ‘winners’ at present—have been developed. For example, in the Northern US Great Plains, maize production is expanding into areas formerly used for grazing or small grains/pulse crop production, leading to declines in local crop diversity (Wright and Wimberly, Reference Wright and Wimberly2013; Johnston, Reference Johnston2014), but the varieties that contribute to greater maize yield in the region appear increasingly sensitive to drought (Lobell et al., Reference Lobell, Roberts, Schlenker, Braun, Little, Rejesus and Hammer2014).
Agroecologists must work to understand how crops interact with environmental change before regional crop diversity and cultural knowledge are lost. Doing so will require testing crops under more realistic field scenarios. A useful link between the growth chamber and the field is the large-scale free-air CO2 enrichment design (Ainsworth and Long, Reference Ainsworth and Long2004). But such projects are resource-intensive and growth chamber studies like ours help target experimental factors and levels. Based on our growth chamber results, we recommend studies on e[CO2] focus on levels below 575 ppm and drought treatments that simulate constant water stress on the scale of weeks rather than frequency of soil saturation and dry-down, to which these crops appear resistant under experimental conditions.
Supplementary material
The supplementary material for this article can be found at https://doi.org/10.1017/S1742170517000692.
Acknowledgements
We acknowledge support from the North Dakota State Agricultural Experiment Station and USDA-NIFA Hatch project 1009910, and help from K. Feiring and C. Staiger, who received funding from the NDSU College of Agriculture's Duncan Scholarship program for undergraduate research. We also appreciate constructive feedback from two anonymous reviewers and the guest editors.