I. INTRODUCTION
Adhesion between soft matter is a universal mechanical problem in bio-engineering and bio-integration. For example, tissue-engineered cell sheets are transferred from their culturing scaffold to in vivo tissues for the reconstruction of cornea, Reference Nishida, Yamato, Hayashida, Watanabe, Yamamoto, Adachi, Nagai, Kikuchi, Maeda, Watanabe, Okano and Tano1 periodontium, Reference Iwata, Yamato, Tsuchioka, Takagi, Mukobata, Washio, Okano and Ishikawa2 and heart Reference Miyahara, Nagaya, Kataoka, Yanagawa, Tanaka, Hao, Ishino, Ishida, Shimizu, Kangawa, Sano, Okano, Kitamura and Mori3 via the adhesion between soft tissues. The intimate, conformal contact between flexible/stretchable electronics and soft organs like the brain, Reference Kim, Viventi, Amsden, Xiao, Vigeland, Kim, Blanco, Panilaitis, Frechette, Contreras, Kaplan, Omenetto, Huang, Hwang, Zakin, Litt and Rogers4 heart, Reference Kim, Ghaffari, Lu, Wang, Lee, Keum, D'Angelo, Klinker, Su, Lu, Kim, Ameen, Li, Zhang, de Graff, Hsu, Liu, Ruskin, Xu, Lu, Omenetto, Huang, Mansour, Slepian and Rogers5 and skin Reference Kim, Lu, Ma, Kim, Kim, Wang, Wu, Won, Tao, Islam, Yu, Kim, Chowdhury, Ying, Xu, Li, Chung, Keum, McCormick, Liu, Zhang, Omenetto, Huang, Coleman and Rogers6 also demonstrates the significance of adhesion between soft abiotic and biotic materials. In fact, contact and adhesion between soft polymers also play an important role during the fabrication of those bio-integrated stretchable electronics. While polydimethylsiloxane (PDMS) is widely used as the stamp material during the transfer printing process, Reference Meitl, Zhu, Kumar, Lee, Feng, Huang, Adesida, Nuzzo and Rogers7 Ecoflex is popular as a tissue-like elastomeric substrate of epidermal electronics. Reference Kim, Lu, Ma, Kim, Kim, Wang, Wu, Won, Tao, Islam, Yu, Kim, Chowdhury, Ying, Xu, Li, Chung, Keum, McCormick, Liu, Zhang, Omenetto, Huang, Coleman and Rogers6 Measuring and understanding the adhesion between soft matter is critical to the success of these advanced technologies. For these reasons, PDMS and Ecoflex will be used as model elastomers in this study.
As one of the most popular elastomers, the work of adhesion/separation of PDMS, especially the Dow Corning Sylgard® 170 (Refs. Reference Chaudhury and Whitesides8 and Reference Silberzan, Perutz, Kramer and Chaudhury9) and Sylgard® 184 (Refs. Reference Olah and Vancso10–Reference Ebenstein and Wahl14) PDMS, has been studied extensively in the literature. Three key factors have been identified to significantly affect the adhesion of soft elastomers: the mixing ratio of the base polymer to curing agent, Reference Choi, Kim and Ulman15,Reference Perutz, Kramer, Baney, Hui and Cohen16 the solvent extraction of free (i.e., uncross-linked) chains, Reference Silberzan, Perutz, Kramer and Chaudhury9 and the ultraviolet ozone (UVO) treatment of the elastomer surface. Reference Olah, Hillborg and Vancso13 Despite numerous measurements, the adhesion mechanism remains vague or even contradictory. In this study, we will explore various adhesion scenarios induced by the first two factors in a systematic manner. In addition, we will also investigate the adhesion between PDMS and Ecoflex®. The goal is to propose a unified, consistent adhesion mechanism for soft elastomers based on a series of systematic studies.
While double cantilever beam and four point bending tests are widely applied to quantify adhesion between stiff layers, we choose to perform Johnson–Kendall–Roberts (JKR) test Reference Johnson, Kendall and Roberts17 to measure adhesion between soft elastomers because it minimizes the sample volume, which reduces bulk viscoelastic losses Reference Vaenkatesan, Li, Vellinga and de Jeu18 and makes it easy to implement for future adhesion measurements including bio-tissues. In fact, JKR test has been widely validated for measuring the adhesion between different types of soft materials. Reference Olah and Vancso10,Reference Crosby and Shull19,Reference Shull20 The three commonly measured parameters in a JKR experiment are load, displacement, and contact radius but only two are required to extract the adhesion energy and the combined elastic modulus. In the first method, the applied load and the contact radius are measured simultaneously and then fitted with the JKR equation to obtain the work of adhesion/separation and the combined elastic modulus. Reference Chaudhury and Whitesides8,Reference Silberzan, Perutz, Kramer and Chaudhury9,Reference Deruelle, Leger and Tirrell21,Reference Mangipudi, Huang, Tirrell and Pocius22 In the second method, the load penetration curve is measured and the pull-off force is directly used to calculate the work of separation. Reference Ebenstein and Wahl14,Reference Ebenstein23 In this setup, the combined elastic modulus can also be obtained through a two point formula once the load penetration curve is available. Reference Ebenstein and Wahl14,Reference Ebenstein23 While the adhesion between soft materials can be obtained both ways, the applicability of the JKR theory is often overlooked. We summarize three complimentary applicability criteria against which the result of a JKR measurement should always be examined. If any of the three criteria is not satisfied, subsequent corrections need to be carried out to reveal the true work of adhesion. The examination and correction procedures will be illustrated using our own JKR measurements. Considering the difficulty of having aligned imaging, loading, and force sensing setups in the first method, we chose to use the second method where contact radius is not measured. The results will be explained by the trade-off among three different adhesion mechanisms: matrix–matrix interaction, chain–matrix interaction, and chain–chain interaction.
In this study, Sec. II reviews the JKR theory and three dimensionless parameters that govern the applicability of the JKR theory. Section III offers the experimental details of using a dynamic mechanical analyzer (DMA) to carry out the JKR tests. Section IV summarizes the experimental results including the Young's moduli of Sylgard® 184 PDMS with five different mixing ratios (10:1, 20:1, 30:1, 40:1, and 50:1) and the work of adhesion/separation measured for pristine and extracted PDMS in self contact or in contact with Ecoflex® 0030. A unified adhesion hypothesis is proposed to interpret the different adhesion behaviors. Concluding remarks are given in Sec. V.
II. JKR THEORY
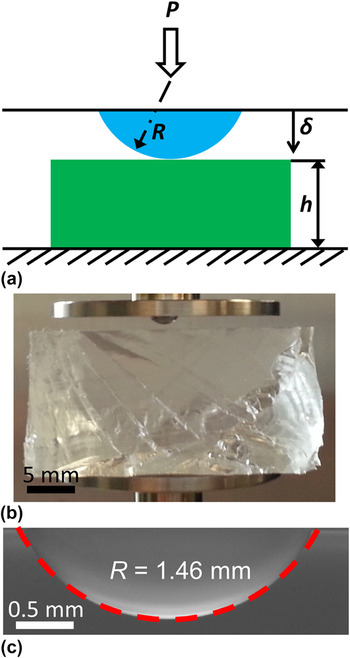
In a standard JKR experiment, a hemispherical lens and a flat substrate are first brought into contact (loading) and then separated (unloading) [see Fig. 1(a)]. The two contact equations relating the applied load P (positive in compression), the contact radius a, and the penetration δ are Reference Johnson, Kendall and Roberts17,Reference Shull20
 $${a^3} = {{3R} \over {4{E^*}}}\left[ {P + 3\pi WR + \sqrt {6\pi WRP + {{\left( {3\pi WR} \right)}^2}} } \right]\quad ,$$
 $$\delta = {{{a^2}} \over {3R}} + {P \over {2{E^*}a}}\quad ,$$
where R is the radius of curvature of the lens and W is the work of adhesion. E ∗ is the combined elastic modulus defined as
 $${1 \over {{E^*}}} = {{1 - v_1^2} \over {{E_1}}} + {{1 - v_2^2} \over {{E_2}}}\quad ,$$
where E 1, E 2, v 1, and v 2 are the Young's moduli and Poisson's ratios of the two bodies in contact, respectively.
Lens–substrate configuration used in our JKR experiments: (a) schematic of the JKR setup, (b) image of the PDMS lens and substrate on the DMA holders, and (c) side view of the PDMS lens under an optical microscope and the fitted circle for the radius of the lens.

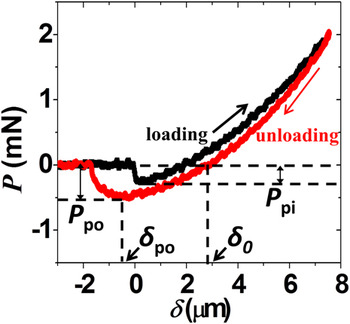
A typical JKR curve looks like the one in Fig. 2, which will be discussed in greater detail in Sec. IV. When the contact occurs at an almost zero penetration during loading, i.e., when δ = 0, the force becomes negative due to the attractive interaction at the lens–substrate interface. From Eqs. (1) and (2), the force at zero penetration P 0 can be readily obtained as Reference Deruelle, Leger and Tirrell21
 $${P_0} = - {4 \over 3}\pi {W_{\rm{a}}}R\quad ,$$
where W a is the work of adhesion. In real experiments, it is technically tricky to determine the point of zero penetration Reference Ebenstein and Wahl14,Reference Cao, Yang and Soboyejoy24–Reference Notbohm, Poon and Ravichandran27 and find the corresponding force P 0. Therefore, we use the pull-in force, P pi, i.e., the maximum negative force during the loading to approximate the force at zero penetration since the pull-in phenomenon is expected to occur near the contact point. Reference Nishi, Nagai, Fujinami and Nakajima28
Load penetration curve for the self-contact of pristine PDMS 10:1. P pi is the pull-in force and P po denotes the pull-off force. δo is the penetration at zero load during unloading and δpo is the penetration at the pull-off moment.

In order for the contact radius to take on real values, the expressions under the square root in Eq. (1) should be no less than zero and the critical value of the load gives the pull-off force to separate the two bodies:
 $${P_{{\rm{po}}}} = - {3 \over 2}\pi {W_{\rm{s}}}R\quad ,$$
where W s is the work of separation.
Notice that both the pull-in and pull-off forces are proportional to the work of adhesion and separation, respectively, as well as the radius of the lens, but are independent of any elastic properties. P pi and P po can be readily determined from the load penetration curve. With measured lens tip radius, Eqs. (4) and (5) can be used to calculate the work of adhesion and separation. When there is no hysteresis, the work of adhesion and separation should be the same, although P pi and P po are not the same as they occur at different δ. When hysteresis is present, however, W a and W s are generally different.
Based on the JKR theory, the following equation can be used to calculate the combined elastic modulus of the two contacting bodies Reference Ebenstein and Wahl14,Reference Ebenstein23,Reference Grunlan, Xia, Rowenhorst and Gerberich29,Reference Sun, Akhremitchev and Walker30 :
 $${E^*} = {{ - 3{P_{{\rm{po}}}}} \over {\sqrt R }}{\left[ {{{3\left( {{\delta _0} - {\delta _{{\rm{po}}}}} \right)} \over {1 + {4^{ - 2/3}}}}} \right]^{ - 3/2}}\quad ,$$
where δ0 is the penetration at zero load during unloading and δpo is the penetration when the pull-off occurs. Since Eq. (6) involves information at only two points, this method is often called the two-point method, Reference Ebenstein and Wahl14,Reference Ebenstein23 which yields the combined modulus comparable to that obtained by the slope of the unloading curve. Reference Ebenstein23 As the combined modulus is determined by the difference between two penetration depths, δ0 and δpo, it does not require the accurate identification of the point of zero penetration, which could be tricky to obtain due to the complicated pull-in process.
The applicability of the JKR model is determined by the basic assumptions the model makes. For example, the JKR model neglects the adhesive forces outside the contact area between two homogenous elastic solids. Therefore, this model is only valid when the elastic deformation occurs in a much larger domain compared with the range of surfaces forces within the contact area. That is, the nondimensional Tabor parameter satisfies the following requirement Reference Johnson and Greenwood31,Reference Johnson32 :
 $$\mu = {\left( {{{R{W^2}} \over {{E^{*2}}z_0^3}}} \right)^{{1 \over 3}}} > 5\quad ,$$
where z 0 is the equilibrium separation at which the traction between two contacting surfaces vanishes (∼0.3 nm). Reference Johnson and Sridhar33
Another important assumption in the derivation of the JKR theory is the small contact radius assumption such that the tip of the lens can be approximated by a paraboloidal instead of spherical shape. Theoretical analysis using the exact spherical profile indicates that when:
 $$m = {\left( {{{4R{E^*}} \over {3\pi W}}} \right)^{{1 \over 3}}} > 10\quad .$$
JKR limit is approached. Reference Maugis34
The third basic assumption of the JKR theory is that the substrate is an infinite elastic domain. For the JKR theory to be valid, the thickness of the substrate should be large enough to mimic an elastic half-space. Numerical results obtained by finite element method have validated that Eq. (5) is accurate when the dimensionless adhesion parameter α satisfies the following condition Reference Sridhar, Zheng and Johnson35 :
 $$\alpha = {\left( {{{2W{R^2}} \over {{{\bar E}_1}{h^3}}}} \right)^{{1 \over 2}}} \lt 0.02\quad ,$$
where
 ${\bar E_1}$
is the plane strain Young's modulus and h is the thickness of the substrate.
To carry out a genuine JKR experiment, the three requirements given by Eqs. (7)–(9) should be double checked once the work of adhesion/separation is obtained by Eq. (5) and the modulus is calculated by Eq. (6). If any of the three criteria is not satisfied, corrections should be made to obtain the true values of work of adhesion/separation. More than one hundred JKR experiments are carried out in this study and fourteen results require corrections when the combined moduli are too small or the work of adhesion/separation are too large to satisfy Eq. (8).
If a valid estimate of the work of adhesion/separation and modulus is available, combining Eqs. (7)–(9), the following specifications on samples dimensions can be obtained to satisfy these three criteria:
 $$R > \max \left( {{{125{E^{*2}}z_0^3} \over {{W^2}}},\,{{750\pi W} \over {{E^*}}}} \right)\quad ,$$
 $$h\, > \,10\left( {{{5\,R^2 W} \over {\bar E_1 }}} \right)^{{1 \over 3}} \quad .$$
From the two inequalities above, it is obvious that lenses with large radius of curvature and substrates with large thickness can comply better with the JKR theory.
III. EXPERIMENTS
A. Sample preparation
A popular PDMS, Sylgard® 184 (Dow Corning Corporation), is used in our JKR experiments. It comes with a prepolymer (base) and a cross-linker (curing agent). The data sheet recommends mixing them in a 10:1 weight ratio to achieve a fully cross-linked elastomer. As the cross-linking density strongly affects the surface properties of PDMS, we prepare PDMS samples of 5 different mixing ratios: 10:1, 20:1, 30:1, 40:1, and 50:1. The mixture is manually stirred for 10 min with a clean glass rod and then degased in a desiccator for one hour.
To make PDMS substrates, the degased mixture is simply poured into a glass petri dish. For the lenses, small droplets of the mixture are placed on triethoxysilane (Tridecafluoro-1,1,2,2-Tetrahydrooctyl-1-Triethoxysilane, United Chemical Technologies) treated glass slides with a pipette. The treatment makes the removal of the PDMS lenses easier after the curing, and it also helps the droplet form a spherical crest via a desirable contact angle. In experiments, the volume of the droplet is set to be 2 μL and the resulting radii of curvature at the crest of the droplets vary from 1.3–2.0 mm. Both the PDMS lenses and substrates are fully cured in a convection oven at 120 °C for 24 h, which is more than enough energy for the cross-linking reaction to fully take place. “Pristine PDMS” refers to the PDMS samples freshly taken out of the oven and naturally cooled down.
After obtaining pristine PDMS, there is one more step to produce “extracted PDMS”. To remove the uncross-linked oligomers on the surface of the PDMS samples, both the lenses and substrates are immersed in chloroform for 24 h after they are taken out of the oven and cooled to room temperature. Chloroform is a good solvent to swell PDMS and dissolve the uncross-linked oligomers and therefore it is often used to extract PDMS samples. Reference Silberzan, Perutz, Kramer and Chaudhury9,Reference Lee, Park and Whitesides36 The solvent has to be changed 3 times during the 24 h soaking period to prevent oligomer saturation in the solvent. After that, the samples are taken out of the solvent and dried in a desiccator for 24 h at room temperature.
Ecoflex® 0300 (Smooth-On, Inc.) is a silicone elastomer containing two parts of prepolymers: Part A and Part B. To prepare Ecoflex® 0300 samples, Part B is added first and stirred for 3 min with a glass rod and then Part A of the same weight is added. The mixture is stirred for another 3 min before it is degased for 10 min in a desiccator. The degassed mixture is then cured at 70 °C for 4 h in the oven. No solvent extraction is needed as Ecoflex® 0300 with 1:1 mixing ratio of the two parts is supposed to be fully cross-linked according to the data sheet.
B. Measurements
Both the JKR and uniaxial tension experiments are conducted with a DMA, RSA G2 (TA Instruments, New Castle, DE), at room temperature (25 °C). The load and displacement are measured and recorded simultaneously during the tests. The resolutions for the load and displacement measurements are 10 μN and 1 nm, respectively.
For JKR experiments, a hemispherical lens and a thick and flat substrate are brought into contact at the rate of ∼100 nm/s [Fig. 1(b)]. When the compressive force reaches the set preload (1–2 mN as suggested in literature Reference Chaudhury and Whitesides8,Reference Silberzan, Perutz, Kramer and Chaudhury9,Reference Perutz, Kramer, Baney, Hui and Cohen16,Reference Vaenkatesan, Li, Vellinga and de Jeu18 ), the unloading procedure is initiated and will last until the two samples are separated. The preload is chosen to be low enough that the penetration is much smaller than the substrate thickness but not so low such that the work of separation is independent of the preload. Reference Greiner, del Campo and Arzt37
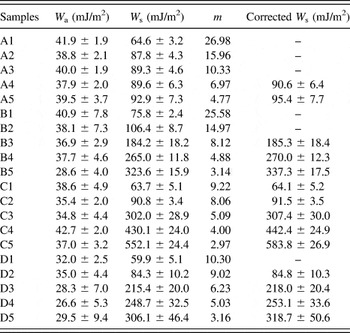
Twenty types of lens–substrate pairs are tested and summarized in Table I. For example, A1 means the contact between pristine PDMS lenses and pristine PDMS substrates both in 10:1 mixing ratio; B2 represents the contact between extracted PDMS lenses and extracted PDMS substrates both in 20:1 mixing ratio; C3 denotes the contact between pristine 30:1 PDMS lenses and Ecoflex substrates; and D4 stands for extracted 40:1 PDMS lenses and Ecoflex substrates.
Codes for different types of pairs of lenses and substrates.

To measure the radius of curvature of the PDMS lenses, the lens is placed on a glass slide and its side profile is captured by a stereo microscope (Carl Zeiss Axio Zoom V16) with a magnification of 30–35, as shown in Fig. 1(c). Based on the intensity information of the image, the edge of the lens can be detected by a customized Matlab script. Fitting the crest of the edge into a circle yields the radius of curvature.
Uniaxial tension tests are performed to measure the Young's moduli of PDMS and Ecoflex. Pristine PDMS and Ecoflex samples are cut into long strips with gage lengths of ∼65 mm and widths of ∼10 mm. The thickness of the samples varies from 1 to 2 mm, which is close to the radius of curvature of the lenses used in the JKR experiments. The samples were clamped at the top and bottom by parallel plates. Tensile strains of ∼10% are applied to all samples in a loading and unloading process. Both the loading and unloading strain rates for PDMS samples are 6.15 × 10⁻⁴ s−1 while for Ecoflex samples, a lower strain rate (3.43 × 10⁻⁴ s−1) is used to reduce viscoelastic effects. Both rates are slightly higher than the estimated local strain rates in our JKR experiments, 1.4 × 10⁻⁴ s−1.
IV. RESULTS AND DISCUSSION
A. Results
An example load penetration curve of a pristine 10:1 PDMS lens in contact with a pristine 10:1 PDMS substrate is given in Fig. 2. The pull-in force P pi can be found as the maximum negative force during loading and the pull-off force P po is the maximum negative force during unloading. The penetrations at zero load during unloading (δ0) and at pull-off (δpo) can also be determined.
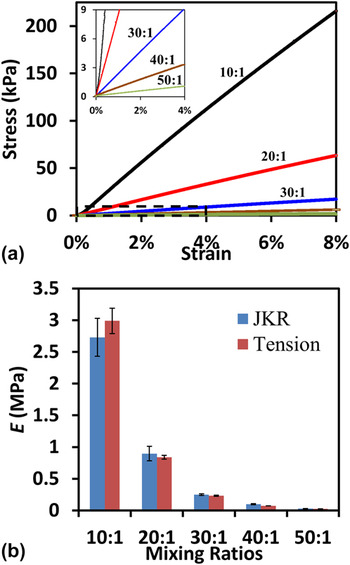
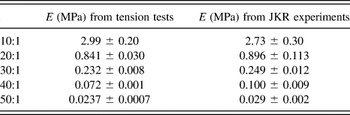
As modulus is an important parameter when examining the applicability of the JKR theory [see Eqs. (7) and (8)], we will first find out the Young's modulus of each material used in our JKR experiments. Uniaxial tension tests as described in the last part of Sec. III. B are performed as a standard test of Young's modulus. The uniaxial stress–strain curves of PDMS with five different mixing ratios are offered in Fig. 3(a). The slope of these linear curves indicates the Young's modulus of the material. The Young's modulus of Ecoflex is 59.0 ± 9.6 kPa, which is in good agreement with values in the literature. Reference Kim, Lu, Ma, Kim, Kim, Wang, Wu, Won, Tao, Islam, Yu, Kim, Chowdhury, Ying, Xu, Li, Chung, Keum, McCormick, Liu, Zhang, Omenetto, Huang, Coleman and Rogers6 Young's moduli of PDMS from the tension test are compared with those measured by the JKR experiments using Eq. (6), as summarized in Table II and Fig. 3(b). It is concluded that the JKR and the tension tests offer consistent Young's modulus measurements (within the error bars) even for ultrasoft elastomers.
Measured PDMS Young's moduli: (a) the stress strain curves of PDMS strips with different mixing ratios obtained by tension tests, and (b) the comparison between Young's moduli measured by JKR (blue) and tension (red) experiments, which are also listed in Table II.

Young's modulus of pristine PDMS.

The work of adhesion and separation for the twenty different contact pairs are calculated via Eqs. (4) and (5) and are summarized in Table III. Now that we have measured Young's moduli and obtained nominal values of work of adhesion, it is necessary to use Eqs. (7)–(9) to confirm the applicability of the JKR theory to our experiments before the true values of the work of adhesion and separation are claimed. The Poisson's ratios of all elastomers used in our experiments are assumed to be 0.5. Reference Wypych and Wypych38 To obtain the Tabor parameter [Eq. (7)] of our experiments, a minimum value can be calculated with the lowest work of adhesion, W = 20 mJ/m2, the highest Young's modulus, E = 3 MPa, the smallest radius of lens, R = 1 mm, and the equilibrium spacing z 0 = 0.3 nm. Reference Johnson and Sridhar33 According to Eq. (7), the smallest possible μ is 1547, which is much larger than 5. Therefore, the requirement on the Tabor parameter is well satisfied for all experiments. Generally, this requirement is easy to satisfy when performing JKR experiments on soft elastomers.
Results of the work of adhesion.

To validate Eq. (9), the maximum adhesion parameter α can be calculated with a much higher value than the nominal work of adhesion/separation, e.g., W = 1000 J/m2, the largest radius of the lenses, R = 2 mm, the lowest Young's modulus, E = 23.7 kPa, and the lower limit of the substrate thickness h = 10 mm. The largest possible α calculated by Eq. (9) is 0.016, which is smaller than 0.02. Therefore, Eq. (9) is valid for all experiments.
For the work of adhesion, the minimum value of m is calculated according to Eq. (8) with the lowest Young's modulus, E = 23.7 kPa, the highest average work of adhesion, W = 42.7 mJ/m2, and the average radius of the lens, R = 1.5 mm. The value of m = 6.176 does not fully satisfy Eq. (8) and an error less than 2% can be expected. Reference Maugis34
For the work of separation, typical values of m are calculated and summarized in Table III for each experiment. For the experiments with m smaller than 10, the JKR assumption of small contact radius is not quite satisfied. As a result, these adhesion values need to be corrected. An iterative Matlab code based on Maugis' extension of the JKR theory Reference Maugis34 is written to correct the work of separation using the following equation,
 $$\bar P = {{3m} \over 8}\left( {{m^2} + {A^2}} \right)\ln {{m + A} \over {m - A}} - {3 \over 4}{m^2}A - A\sqrt {6A} \quad ,$$
where
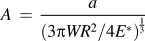 $A\, = \,{a \over {\left( {{{3\pi WR^2 } \mathord{\left/ {\vphantom {{3\pi WR^2 } {4E^* }}} \right. \kern-\nulldelimiterspace} {4E^* }}} \right)^{{1 \over 3}} }}$
and
 $\bar P\, = \,{P \mathord{\left/ {\vphantom {P {\pi WR}}} \right. \kern-\nulldelimiterspace} {\pi WR}}$
are dimensionless contact radius and applied load, respectively. For a given m, the curve of
 $\bar P$
versus A can be plotted and the minimal value of
 $\bar P$
,
 ${\bar P_{\min }}$
, which corresponds to the pull-off force can be obtained. The updated work of separation can be calculated with the updated pull-off force using Eq. (5) and hence an updated m can be found using Eq. (8). The iteration terminates when the difference of m between the last iteration and the current iteration is smaller than 0.001. The updated results of the work of separation are included in Table III.
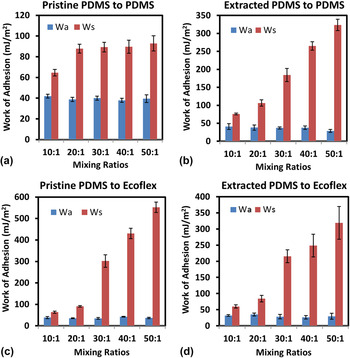
The corrected work of adhesion and separation for the twenty different contact pairs is plotted in Fig. 4, where pristine PDMS-to-PDMS results are given in Fig. 4(a), extracted PDMS-to-PDMS results in Fig. 4(b), pristine PDMS-to-Ecoflex results in Fig. 4(c), and extracted PDMS to Ecoflex results in Fig. 4(d). The effect of cross-linking density within each type is discussed here, whereas the comparison across different types of contacts will be offered in Fig. 5. Figure 4(a) shows that the measured work of adhesion and separation between pristine 10:1 PDMS is 41.9 ± 1.9 mJ/m2 and 64.6 ± 3.2 mJ/m2, respectively. This work of separation measured by DMA is found consistent with the values in the literature for Sylgard® 184 10:1 PDMS. Reference Qi11,Reference Rundlof, Karlsson, Wagberg, Poptoshev, Rutland and Claesson12,Reference Ebenstein and Wahl14,Reference Greiner, del Campo and Arzt37 As the mixing ratios increase, i.e., cross-linking density decreases, there is no obvious change in the work of adhesion. However, the work of separation becomes 87.8 ± 4.3 mJ/m2 for 20:1 PDMS and only increases marginally as the mixing ratio turns even larger. Figure 4(b) indicates that the work of adhesion between extracted PDMS slightly decays as the mixing ratio increases, whereas the work of separation increases significantly to a maximum of 337.3 ± 17.5 mJ/m2 for 50:1 PDMS. The increase is even more dramatic for pristine PDMS lenses in contact with Ecoflex substrates as shown in Fig. 4(c). The work of adhesion 583.8 ± 26.9 mJ/m2 is the highest value ever achieved for fully cured (not fully cross-linked) pristine Sylgard® 184 PDMS, which has not gone through any surface modifications such as UVO treatment. Figure 4(d) indicates that the work of separation also increases with mixing ratio for extracted PDMS lenses in contact with Ecoflex substrates.
The work of adhesion and separation for four different contact types, each consisting of five different mixing ratios of PDMS: (a) pristine PDMS to pristine PDMS, (b) extracted PDMS to extracted PDMS, (c) pristine PDMS to Ecoflex, and (d) extracted PDMS to Ecoflex.

Summary of the work of separation for the twenty different contact pairs.

B. Discussion
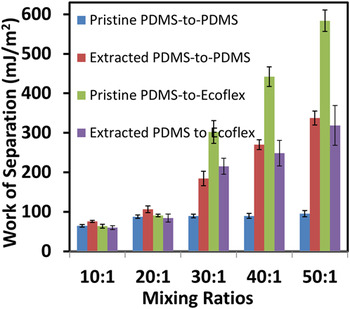
All of the work of separation data given in Table III and Fig. 4 are consolidated into one single plot in Fig. 5 so that we can make comparisons across the board. While there is negligible variation among the four different contact types with 10:1 and 20:1 PDMS, pristine PDMS-to-Ecoflex contact stands out as the most adhesive one when the PDMS mixing ratio is between 30:1 and 50:1. Therefore, we expect a change in the adhesion mechanism when the mixing ratio increases from 20:1 to 30:1. An explanation for the different effects of mixing ratio on the four different contact types is also required.
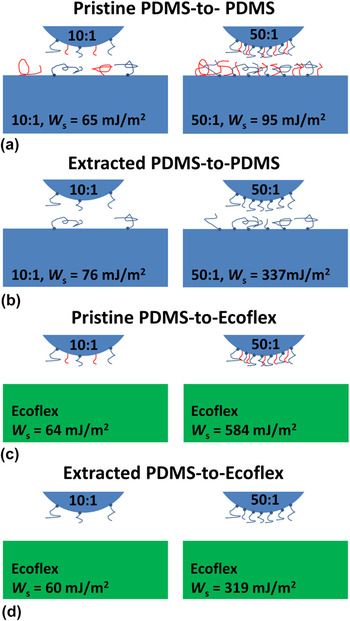
Inspired by the proposed elastomer contact mechanism in literature, Reference Kroner, Maboudian and Arzt39 we speculate that the elastomer–elastomer interface adhesion depends on the trade-off among three types of surface interactions: matrix to matrix, chain to chain, and chain to matrix (or matrix to chain). Hypothetical schematics of the various interfaces for the four different contact types are illustrated by the four figures in Fig. 6, with 10:1 mixing ratio in the left frames and 50:1 mixing ratio in the right frames. The values of the work of separation are labeled for each contact pair for quick comparison. Blue is used to represent PDMS matrices and green the Ecoflex matrix. Although Ecoflex is fully cross-linked and can be assumed chain-free on the surface [Figs. 6(c) and 6(d) right frames], there can be plenty of surface chains in sub-cross-linked PDMS. Reference Palchesko, Zhang, Sun and Feinberg40 To validate this point, we perform 5 contact angle measurements on each sample using an FTA200 contact angle goniometer (First Ten Angstroms, Portsmouth, VA). Contact angles for pristine Ecoflex, 10:1 PDMS, and 50:1 PDMS are measured to be 105.88° ± 0.45°, 102.68° ± 1.98°, and 117.05° ± 1.56°, respectively, which indicates the following order of wettability: 10:1 PDMS > Ecoflex > 50:1 PDMS. Since high energy substrates are more easily wet than low energy substrates Reference Degennes41 and cross-linked PDMS exhibit higher surface energy than uncross-linked PDMS chains, Reference Hillborg, Tomczak, Olah, Schonherr and Vancso42 our contact angle experiments have provided evidence to support the fact that 10:1 PDMS and Ecoflex are fairly well cross-linked (i.e., with few surface chains) while 50:1 PDMS has much more uncross-linked chains on its surface. Two types of PDMS surface chains need to be differentiated: tethered chains with one end anchored (cross-linked) to the matrix and the other end dangling on the surface, which are drawn in blue color, versus free chains with one end embedded but not tethered to the matrix and the other dangling on the surface, which are depicted in red color. It has been shown that the chloroform extraction can remove the free chains but not the tethered chains. Reference Lee, Park and Whitesides36,Reference Almutairi, Ren and Simon43 As 10:1 is the recommended mixing ratio for Sylgard® 184 PDMS, it is expected that 10:1 PDMS should be almost fully cross-linked so that there are none or only very limited amount of tethered chains and free chains on its surface, which are also sparsely located, as depicted in Figs. 6(a) and 6(c) left frames. Free chains are fully removed after chloroform extraction as illustrated by Figs. 6(b) and 6(d) left frames. When the mixing ratio is very high, e.g., 50:1, PDMS is highly under-cross-linked such that the surface of 50:1 PDMS will be full of tethered and free chains, as illustrated by Figs. 6(a) and 6(c) right frames. Although free chains can be removed after solvent extraction, there is still a dense layer of tethered chains remaining on the surface, as shown in Figs. 6(b) and 6(d) right frames. Comparing the left frames with the right frames in Fig. 6, it is proposed that the adhesion of 10:1 and 20:1 PDMS (represented by the left frames) is mainly due to the contact between the matrices of the lens and the substrate, while the surface chains are playing marginal roles. As a result, the adhesion values of these contact pairs are small (<100 mJ/m2) with or without extraction or between PDMS–PDMS or PDMS–Ecoflex contact. The very similar adhesion results also indicate that it is hard to differentiate Ecoflex from PDMS as a matrix so the difference between different matrices is neglected in the following discussion. The chain–matrix interaction (e.g., penetration) and chain–chain interaction (e.g., entanglement) start to dominate adhesion when higher surface chain density presents, starting from a mixing ratio of 30:1, as represented by the right frames of Fig. 6. More detailed adhesion mechanisms involving surface chains can be differentiated when we make the following one-to-one comparisons.
Representations of the lens–substrate interaction with tethered (blue) and free (red) surface chains for (a) pristine PDMS-to-PDMS, (b) extracted PDMS-to-PDMS, (c) pristine PDMS-to-Ecoflex, and (d) extracted PDMS-to-Ecoflex. The mixing ratio and work of separation are labeled.

Six pairs of comparison can be made out of the four different contact types given by Fig. 6 right frames. Among the six pairs, three of them are direct comparisons, i.e., only one ingredient (either the lens or the substrate) is different, whereas the other three are indirect comparison, i.e., both the lens and the substrate are different. First, let's examine a direct comparison between Figs. 6(c) and 6(d) right frames, both of which have Ecoflex substrate. The only difference between them is the lens: pristine PDMS lens in Fig. 6(c) and extracted PDMS lens in Fig. 6(d). Since pristine PDMS exhibits significantly higher adhesion in contact with Ecoflex than the extracted PDMS, it is concluded that the free chains on the pristine PDMS lens can enhance the adhesion when contacting a chain-free elastomer substrate, i.e., the Ecoflex substrate. The second direct comparison is between Figs. 6(a) and 6(c), where the lenses are both pristine PDMS but the substrate is pristine PDMS in Fig. 6(a) but Ecoflex in Fig. 6(c). It is assumed that the surface of pristine 50:1 PDMS is covered by a dense layer of both free and tethered chains. In Fig. 6(a), as both the lens and the substrate are full of surface chains, the chain–chain interaction on the interface can effectively block the chain–matrix interaction whereas in Fig. 6(c), the surface chains of the PDMS lens can fully interact with the matrix of the Ecoflex substrate. This has been validated by repeated JKR experiments on PDMS contact pairs similar to Fig. 6(c) right frame, Reference Kroner, Maboudian and Arzt39 which concluded that the surface oligomers of one PDMS surface can be transferred to the matrix of the contacting PDMS whose surface is clean. As the adhesion is several times higher in Fig. 6(c), it is concluded that the chain–chain interaction is much less effective than the chain–matrix interaction in boosting elastomer adhesion. Two fundamental conclusions have been derived so far: (i) chain–matrix interaction enhances adhesion and (ii) if chain–chain interaction gets in the way of chain–matrix interaction then it impairs adhesion. These two conclusions can be used to explain the following four pairs of comparison.
The last direct comparison would be between Figs. 6(b) and 6(d) right frames, which have the same extracted PDMS lenses but different substrates: extracted PDMS [Fig. 6(b)] versus Ecoflex [Fig. 6(d)]. As we do not differentiate between PDMS and Ecoflex as a matrix (50:1 PDMS and Ecoflex also have similar Young's modulus), the only difference between the substrates of Figs. 6(b) and 6(d) is that there are many tethered chains on the surface of extracted 50:1 PDMS, whereas Ecoflex surface is assumed to be chain-free. The tethered chains on the substrate in Fig. 6(b) have two conflicting effects: on the one hand, they might be able to interact with the matrix of the lens because the free chains removed during extraction have emptied up some space for the substrate chains to access the matrix of the lens, which should result in an adhesion higher than Fig. 6(d); on the other hand, the tethered chains on the substrate partially block the tethered chains on the lens from accessing the substrate matrix, which would lead to a degradation of adhesion compared to Fig. 6(d). The combination of the two effects ultimately leads to only a slightly higher adhesion in Fig. 6(b) compared to Fig. 6(d).
After discussing the three direct pairs of comparison, we now turn to the three indirect pairs. The first indirect comparison is between Figs. 6(a) and 6(b) right frames. In Fig. 6(a), both the lens and the substrate are pristine PDMS, the surfaces of which are almost fully covered by a layer of free and tethered chains whereas in Fig. 6(b), some space is emptied up after extracting the free chains from both the lens and the substrate. Therefore, almost purely chain–chain interaction in Fig. 6(a) yields lower adhesion compared to both chain–chain and chain–matrix interaction in Fig. 6(b). The second indirect comparison is between Fig. 6(a) (pristine PDMS-to-pristine PDMS) and 6d (extracted PDMS-to-Ecoflex). Since it is mostly chain–chain interaction in Fig. 6(a) but purely chain–matrix interaction in Fig. 6(d), it is expected that Fig. 6(d) demonstrates higher adhesion. The last indirect comparison is between Figs. 6(b) and 6(c). As the chain–chain interaction blocks the chain–matrix interaction in Fig. 6(b) but it is purely chain–matrix interaction in Fig. 6(c), Fig. 6(c) exhibits significantly higher adhesion as expected.
To summarize, chain–matrix interaction is the most effective adhesion mechanism compared to chain–chain or matrix–matrix interactions. Chain–chain interaction obstructs chain–matrix interaction as it either blocks or entangles with surface chains which could have interacted with the matrix. Free chains can only enhance adhesion if they are not blocking chain–matrix interaction. As a result, the highest adhesion is observed between pristine 50:1 PDMS, which is full of both tethered and free chains, and Ecoflex, which is free of surface chains.
V. CONCLUSIONS
Based on the JKR theory, the work of adhesion, the work of separation, and the combined elastic modulus can be readily calculated when the load penetration curve between a hemispherical elastomeric lens and a flat elastomeric substrate can be measured. Three dimensionless parameters are summarized to check the applicability of the JKR theory. More than one hundred JKR experiments are carried out by a DMA to measure the work of adhesion/separation of pristine and extracted PDMS with five different mixing ratios in self contact or in contact with Ecoflex. The applicability of the JKR theory is always examined after the Young's modulus and the work of adhesion/separation is measured and a procedure to correct the adhesion values of incompliant experiments has been undertaken. The wide range of adhesion values for twenty different contact pairs can be explained by a unified hypothesis that chain–matrix interaction is the most effective adhesion mechanism compared to chain–chain or matrix–matrix interactions. The three interactions are exclusive to each other and hence maximizing the chance of chain–matrix interaction can yield the highest elastomeric adhesion before any surface modification is done.
ACKNOWLEDGMENT
This work is supported by the NSF CMMI award under Grant No. 1301335. Y.Y. acknowledges the George J. Heuer, Jr. Ph.D. Endowed Graduate Fellowship. The inspiring critiques and helpful edits made by our close collaborator, Prof. Kenneth Liechti, are greatly appreciated. We also thank the suggestions from Prof. Chad Landis.