Introduction
There are many papers devoted to the studies of runaway electrons and X-ray radiation taken place at discharges in atmospheric-pressure air (Babich, Reference Babich2003; Tarasenko, Reference Tarasenko2016a, Reference Tarasenko2016b). Most of them are concerned with high-energy electrons generated in “tip-plane” gaps due to applying high-voltage pulses with nanosecond or subnanosecond rise times. However, many applications deal with voltage pulses with the rise times of tens of nanoseconds and more (Martin, Reference Martin, Martin, Guenther and Kristiansen1996; Mesyats, Reference Mesyats2005; Peng et al., Reference Peng, Liu, Song and Su2011). Moreover, there is no information about X-ray radiation and runaway electrons in significant part of papers dealt with researches involving voltage pulses of long duration. From the other extreme, it is necessary to mention a number of papers regarding the experiments in atmospheric-pressure air with voltage pulses with microsecond front duration (Loiko, Reference Loiko1980; Dwyer et al., Reference Dwyer, saleh, Rassoul, Concha, Rahman, Cooray, Jerauld, Uman and Rakov2008; March and Montanyá, Reference March and Montanyà2008; Nguyen et al., Reference Nguyen, van Deursen and Elbert2008; Babich and Loiko, Reference Babich and Loiko2009; Kochkin et al., Reference Kochkin, van Deursen and Ebert2015; Kostyrya and Tarasenko, Reference Kostyrya and Tarasenko2015; Oreshkin et al., Reference Oreshkin, Barengolts, Chaikovsky and Oreshkin2015). In these papers, it is reported about generation in interelectrode gaps of different width of runaway electron beams (RAEBs), as well as X-ray radiation resulting from the beam braking at the anode and/or gas particles. As well, it was reported that X rays at corona discharge in atmospheric-pressure air were registered (Bosamykin et al., Reference Bosamykin, Karelin, Pavlovskii and Repin1980; Shao et al., Reference Shao, Tarasenko, Zhang, Rybka, Kostyrya, Kozyrev, Yan and Kozhevnikov2011; Rybka et al., Reference Rybka, Andronikov, Evtushenko, Kozyrev, Kozhevnikov, Kostyrya, Tarasenko, Trigub and Shut'ko2013; de Silva et al., Reference da Silva, Millan, McGaw, Yu, Putter, Labelle and Dwyer2017). It should be noted that when using several-meters-length interelectrode gaps and several-megavolts-amplitude voltage pulses, only X-ray radiation pulses were registered (Dwyer et al., Reference Dwyer, saleh, Rassoul, Concha, Rahman, Cooray, Jerauld, Uman and Rakov2008; March and Montanyá, Reference March and Montanyà2008; Nguyen et al., Reference Nguyen, van Deursen and Elbert2008; Kochkin et al., Reference Kochkin, van Deursen and Ebert2015; Oreshkin et al., Reference Oreshkin, Barengolts, Chaikovsky and Oreshkin2015). It can be assumed that recording of RAEB current pulses under these conditions is difficult due to their small amplitude, as well as the complexity of collector placement near the discharge zone providing emission of high-energy electrons.
Apparently, RAEBs at voltage pulses of microsecond duration were first observed by Loiko (Reference Loiko1980). According to this paper, a spark discharge occurred in the gap. The presence of runaway electrons was associated with the imprints on the RT-1 film. The number of electrons estimated by film blackening was 107 pcs. It was suggested that fast electrons are generated during a time interval corresponding to the rise time of the conduction current. According to the author, their energy eU m (e – elementary charge of an electron, U m – maximum breakdown voltage) at the breakdown voltage of 70 kV is about 70 keV, that is, it is in accordance with the amplitude value of the applied voltage. It was also reported that RAEBs were registered at the voltage pulse rise times of 0.4 and 2 µs. Nevertheless, there were no data on the effect of the rise time of the voltage pulse on the RAEB parameters. The duration [full width at half maximum (FWHM)] of the beam current pulse was measured with the detector consisted of a scintillator and a photomultiplier tube (PMT). At the temporal resolution of the detector of 4 ns, the measured FWHM of the beam current pulse did not exceed 4 ns. In the paper by Babich and Loiko (Reference Babich and Loiko2009), which is a continuation of research started in Loiko (Reference Loiko1980), it was shown that when using sensors with higher temporal resolution, the FWHM of the beam current pulse does not exceed 0.8 ns. In addition, it was reported the registration of up to 108 of electrons in certain pulses. However, there were no images illustrating the construction of the gas diode, as well as the Faraday cup or the collector. Therefore, it is difficult to analyze the data presented there.
In Kostyrya and Tarasenko (Reference Kostyrya and Tarasenko2015), two modes of generation of RAEB and X rays at microsecond rise time of the voltage pulse were found. In the first mode, short-duration pulses of beam current and X-ray radiation are generated. In this mode, as in Loiko (Reference Loiko1980) and Babich and Loiko (Reference Babich and Loiko2009), the voltage across electrodes is rapidly decreasing and a spark channel is observed in a gap. The second mode was realized at partial decrease in voltage pulse amplitude. The duration of X-ray radiation pulses in this case was ranged from tens to hundreds of nanoseconds. In addition, this mode has not been studied in detail.
The objectives of the paper are as follows. The first of them is to determine and investigate the conditions providing the generation of long-duration pulses of RAEBs and X-ray radiation, when applying to the gap high-voltage pulses with the rise time of ≈500 ns. The second one is to determine the energy spectrum of X-ray radiation, which is emitted at pulse-periodic discharge fed by voltage pulses with the rise time of ≈50 ns.
Experimental setups and measurement techniques
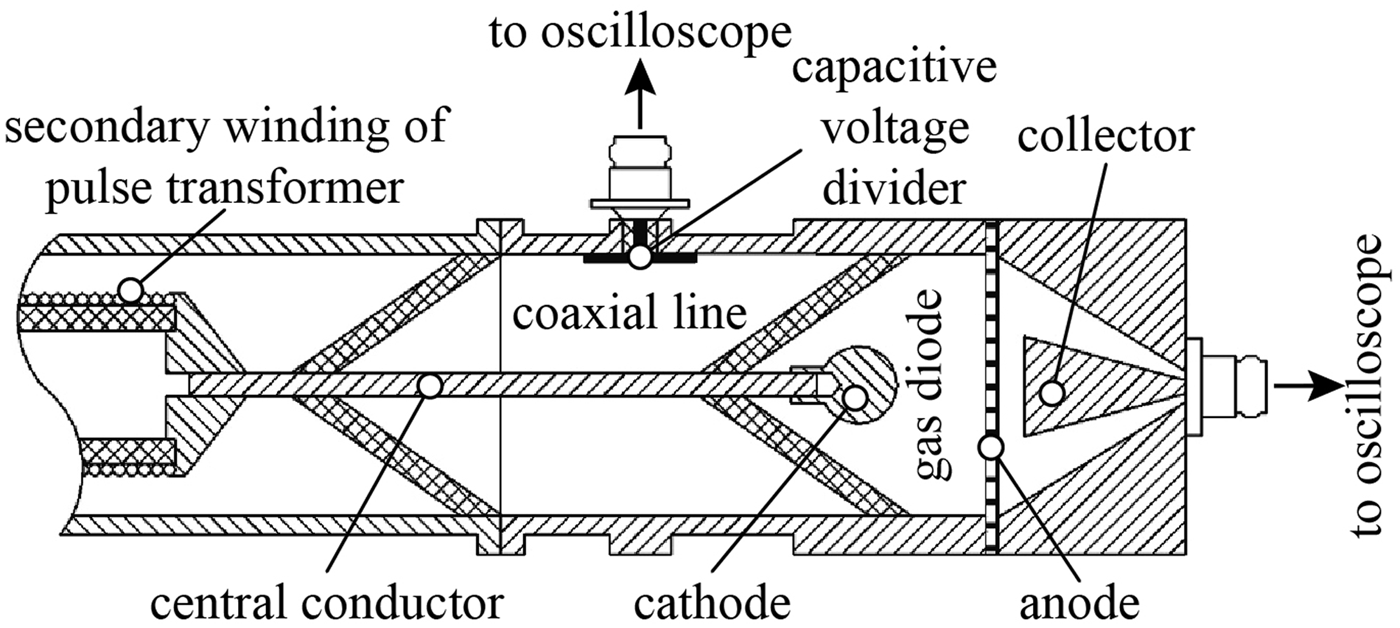
All studies were performed at two setups in atmospheric-pressure air. The first setup included a metal gas diode connected to a voltage pulse generator of the SLEP-150M type (Tarasenko et al., Reference Tarasenko, Kostyrya, Baksht and Rybka2011). To increase the rise time of the voltage pulse, a peaker was removed from the coaxial line. A 20 cm-length segment of the high-voltage coaxial line with the impedance of 100 Ω was charged with a pulse transformer. One of the ends of the central conductor of the coaxial line served as a cathode holder in the gas diode. The inner part of the gas diode had a cylindrical shape and its diameter corresponded to the inner diameter of the coaxial line and was 64 mm. This circumstance provided a minimum inductance of the circuit formed by the coaxial line and gas diode. A part of the secondary winding of the pulse transformer, a coaxial line, a gas diode formed by a ball-shaped cathode and flat anode, as well as a collector are schematically presented in Figure 1.
Schematic diagram of the part of the setup including coaxial line, collector, and gas diode formed by a ball-shaped cathode and flat anode.

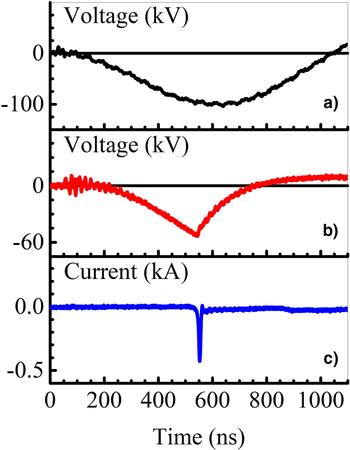
The amplitude of a voltage pulse in idling depended on the charging voltage of the capacitor connected to the primary winding of the pulse transformer. A waveform of the voltage across the gap in the absence of a breakdown is presented in Figure 2a.
Waveforms of the voltage in idling (a), as well as of the voltage across the gap (b) and discharge current (c) when breakdown occurs.

It is seen that the voltage reaches its maximal value in 0.5 µs. A delay of the breakdown depended on the voltage in idling, the cathode design, the gap width. Its value varied from 0.3 to 0.5 µs. Three types of cathodes were used in the experiments. Tubular cathode was made of 100 µm-thick stainless steel foil. It was of 6 mm in diameter. The second one was cone-shaped with a base diameter of 6 mm and an apex angle of 45°. A radius of the rounding of the cone vertex was 3 mm. Cathodes of the third type had a shape of a ball or hemisphere. Ball-shaped cathodes were 9.5, 12.5, and 15.1 mm in diameter. A hemisphere-shaped one had the diameter of 17.5 mm and rounded edges. Cathodes of the second and third types were also made of stainless steel. An anode had a flat form. It was a grid with the light transparency of 14 or 64%. Either aluminum foils with thicknesses of 10, 20, and 30 µm or a 2 µm-thick kimfol (C16H14O3) film coated with a 0.2 µm-thick aluminum layer was installed behind the grid. To initiate X rays, anodes made of copper (20 µm-thick foil) or aluminum (10, 30, and 100 µm-thick foils) were used. An interelectrode space could be varied from 6 to 27 mm. The voltage pulse generator was operated in a single-pulse mode.
To register RAEB, a collector was mounted behind the anode. A signal from the collector was transmitted via coaxial cable with the impedance of 50 Ω. Two collectors with aluminum receiving parts were used in the experiments. The first one had a cone-shaped receiving part of 20 mm in diameter and a temporal resolution of 80 ps. When using this collector, the distance between the anode and the receiving part was 5 mm. The receiving part of the second collector was a 62 mm-diameter disk. Although, this collector made it possible to register electron current from the whole anode area, this provided the temporal resolution of ~1 ns. The distance between the receiving part of this collector and the anode was 2 mm.
X-ray radiation was registered with a scintillator equipped with a PMT-100. The temporal resolution of this detector was no worse than 10 ns. Integral images of discharge plasma glow were taken with a Zenith-11 camera. To investigate the time behavior of radiation of the discharge plasma in different spectral ranges, a photodiode FEK-22 and a set of color filters were used.
A capacitive voltage divider calibrated by a voltage divider Tektronix РЗ60115А was used to measure the voltage across the gap. The current through the diode was measured with a shunt based on chip resistors.
Signals from all the detectors were recorded with real-time digital oscilloscopes of TDS 3034 (300 MHz, 2.5 GS/s) and DPO 70604 (6 GHz, 25 Gs/s).
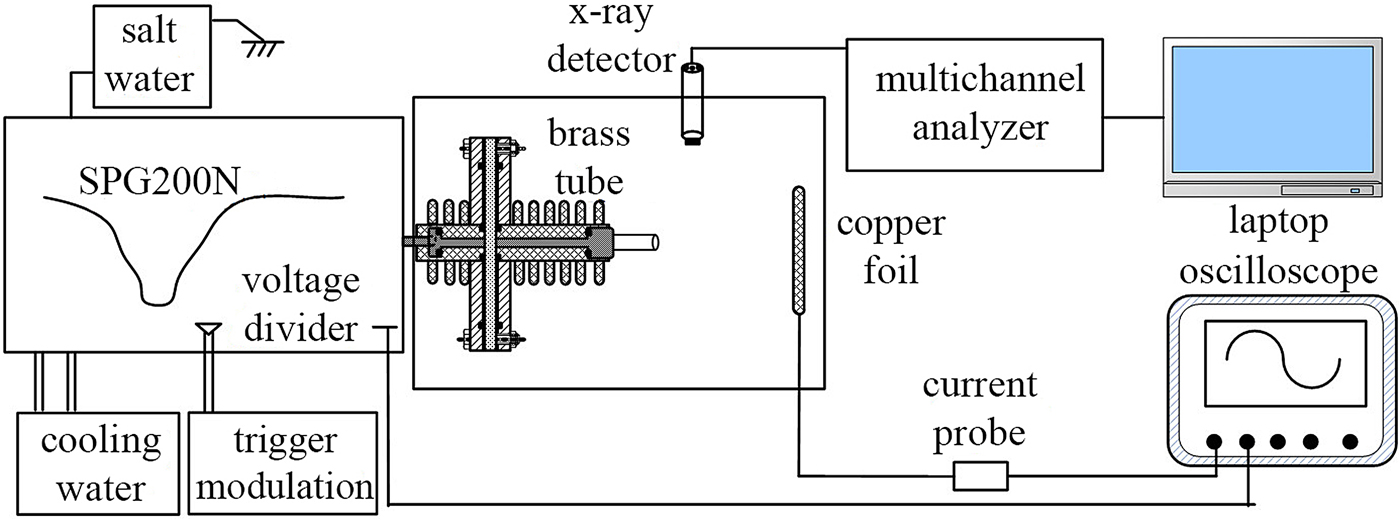
A schematic diagram of the second experimental setup is presented in Figure 3. This setup included a solid-state pulse generator SPG200N produced pulses with nanosecond duration and operated in repetitive mode. The SPG200N is based on an inductive energy storage, consisting of a primary charging unit, a magnetic compression unit, and an amplifying unit, which includes SOS diodes. As a power switch of the SPG200N, a trigger modulator was used. This device also allowed to adjust pulse repetition rate, which could be varied from fractions of hertz to 2 kHz. In order to obtain stable output voltage, a saline solution was used. A container with salt water was connected in parallel with the discharge load. This prevents the influence of the discharge load on the output voltages. The output voltage could be varied from 0 to 200 kV by change in density of the solution. A voltage pulse produced by this generator has three steps at the front. Its rise time is of about 50 and 15 ns at the levels of 0.1–0.9 and 0.2–0.9, respectively. The FWHM of the voltage pulse is 30–40 ns.
Schematic diagram of the second experimental setup.

The discharge was ignited in a gap having “tube-plane” geometry. The cathode was a 12 mm-diameter tube made of a 1 mm-thick copper sheet. A 50 µm-thick copper foil with an area of 120 mm × 80 mm or the set of several such foils was used as an anode. The discharge chamber was 400 mm in diameter and 400 mm in length.
The corresponding registration system is also shown in Figure 3. A real-time digital oscilloscope Lecroy WR204Xi (B w = 2 GHz, sampling rate is 10 GS/s) was used to record signals from detectors. Wide-bandwidth voltage and current probes were used to monitor the electrical parameters of the nanosecond discharge. The voltage probe was a capacitive voltage divider with a dividing ratio of 15732. It was connected to the high-voltage output of the SPG200N. The current one was a reverse current shunt based with the resistance of ~0.118 Ω. It provided registration of high-frequency signals. To investigate X-ray emission under discharge conditions, an online registration system consisted of a NaI (Tl) scintillator, a PMT, and an integrated multi-channel analyzer was used. This allowed to obtain energy distribution of emitted X rays. A detailed description of the detector, as well as information on measurement and calibration procedures are presented in Zhang et al. (Reference Zhang, Shao, Yu, Niu, Yan and Zhou2010). In addition, a Canon EOS500D digital camera with a Tamron Lens (Model A001) was used to capture the images of the discharge plasma glow. The camera was installed in parallel to the discharge area and was situated ~1 m away from it.
Experimental results for the rise time voltage pulse of 500 ns
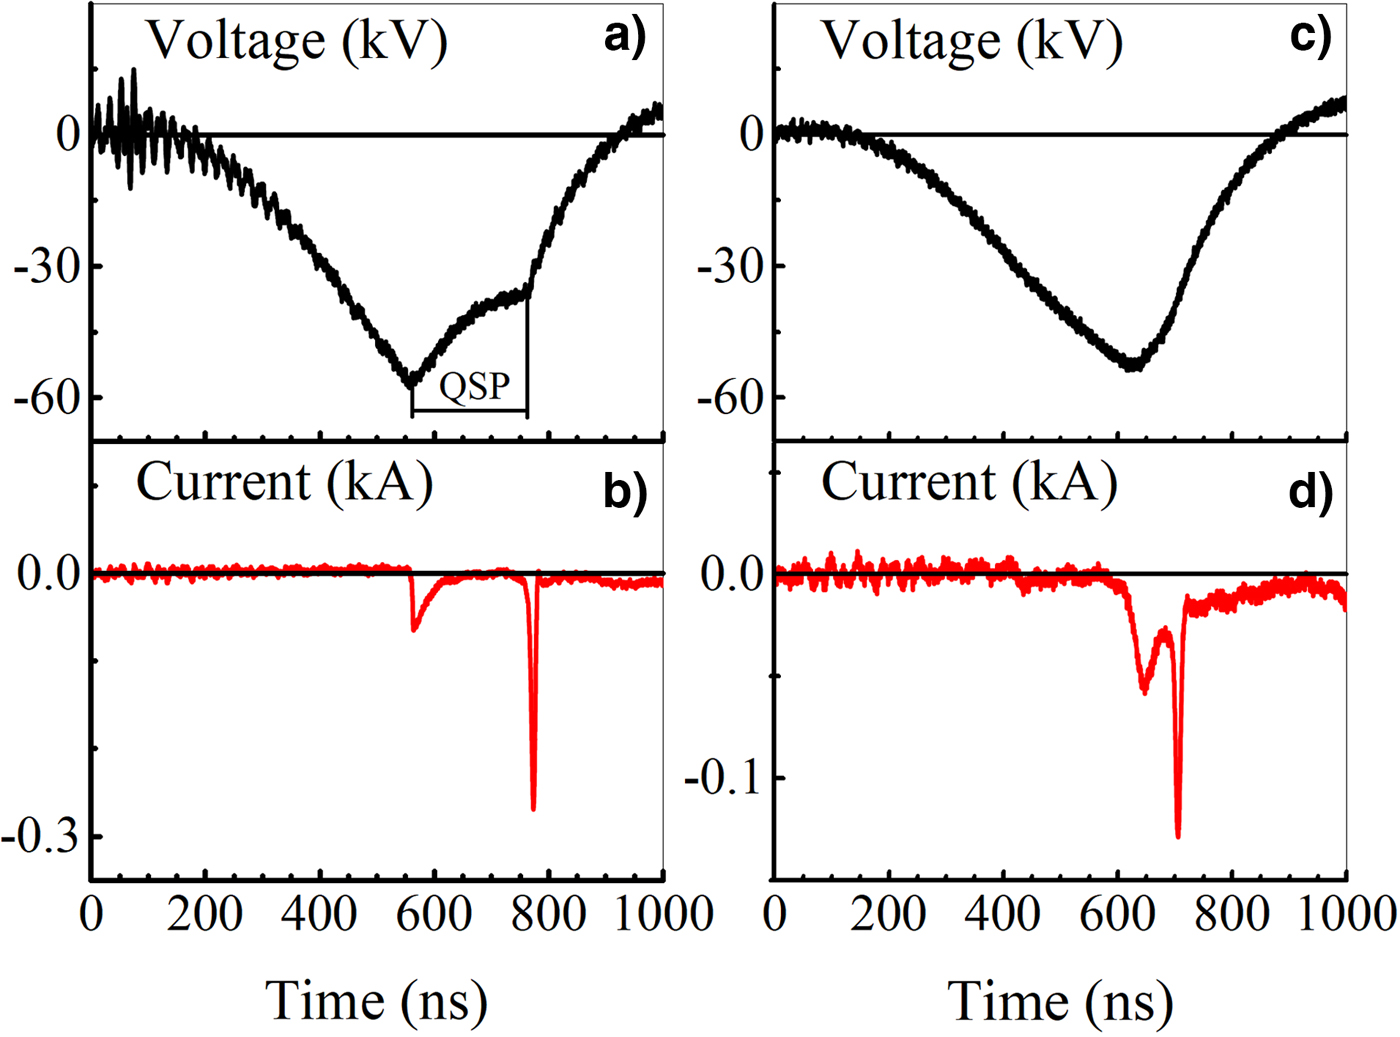
In these experiments, a voltage pulse with microsecond duration and the amplitude of ~100 kV was applied to the gas diode. It should be noted that breakdown of the gap, in this case, occurred at a rise time of the voltage pulse even when the gap width was 27 mm. The breakdown voltage and waveform of the voltage across the gap depended on the cathode design and the voltage in idling. There were several modes of the discharge development. Waveforms of the voltage across the gap and discharge current are presented in Figure 2b–2c and Figure 4a–4c.
Waveforms of the voltage across the gap (a, c) and current through the gap (b, d). Cathode – stainless steel hemisphere with the radius of 17.5 mm. The gap width is 20 mm.

They are corresponded to the approximately equal breakdown voltage. The breakdown delay time was about 400 ns. The greatest amplitude of a discharge current pulse was realized at fast breakdown. In this case, a discharge current pulse had one peak (e.g., Fig. 2c) and a bright spark channel was observed between electrodes. From pulse to pulse, the position at the anode of the anchor point of the current channel was different.
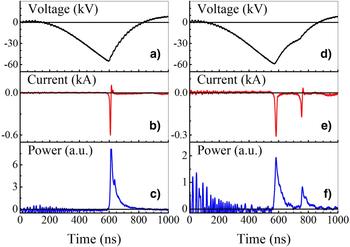
The waveforms in Figure 4 were being recorded when a spark channel had occurred in the gap. Nevertheless, there was a weak diffuse glow in the gap. This glow could be detected by using a color filter with transparency in the range 300–400 nm. As it is seen from Figure 4, waveforms of the voltage and discharge current at this discharge mode differ significantly from those for pure spark discharge. There is a region corresponding to the quasi-stationary phase (QSP) on the voltage waveform. It follows the first rapid voltage drop (see Fig. 4a). The voltage at this phase depends on the cathode design. It is ~70% of the breakdown voltage for the case in Figure 4a. There are two pulses on the waveform of discharge current. The QSP terminates before the voltage pulse ending because of the spark formation indicated by the second rapid drop on the voltage pulse waveform (Fig. 4a). The QSP duration, amplitudes of current pulses, and time interval between them were varied from pulse to pulse. For example, the time interval between the peaks on the current waveform in Figure 4a is ≈210 ns, while the one in Figure 4b is only ≈70 ns. As a rule, the first peak has a lower amplitude and longer duration.
Waveforms of radiation intensity pulses of the discharge plasma recorded with the FEK-22 are presented in Figure 5c–5f. They are correlated with those of the discharge current (Fig. 5b–5e). It is seen from Figure 5 that a number of pulses in the radiation waveforms corresponds to that on the waveforms of the discharge current. The second pulses of the discharge current and radiation correspond to a repeated decrease in voltage (Fig. 5d). Change in the cathode design does not affect significantly the observed modes. This leads only to a change of the breakdown voltage, duration of the QSP, and voltage across the gap during this phase.
Waveforms of the voltage across the gap (a, d), discharge current (b, e), and radiation intensity of the discharge plasma (c, f) for two different modes. Cone-shaped cathode. The gap width is 20 mm.

It was established by means of spectroscopic measurements that the first radiation pulse on the waveform is formed mainly by transitions between energy levels of the second positive system of a nitrogen molecule. A radiation spectrum corresponding to the second pulse falls within the visible range, which is due to radiation of a spark channel (Lomaev et al., Reference Lomaev, Rybka, Sorokin, Tarasenko and Krivonogova2009). Thus, the following occurs in mode with the QSP. First, the diffuse discharge is ignited. The first pulses on the waveforms of the discharge current and radiation correspond to this discharge form. Then discharge constriction occurs. This leads to a decrease in the voltage across the gap and the second pulses on the waveforms of the discharge current and radiation are observed. When the discharge current waveform consists of a single pulse, a discharge exists in the diffuse phase having a short duration. Therefore, it is necessary to carry out investigations at higher temporal resolution using voltage pulses of shorter duration (see Shao et al., Reference Shao, Tarasenko, Zhang, Baksht, Yan and Shut'ko2012; Tarasenko et al., Reference Tarasenko, Baksht, Beloplotov, Burachenko, Lomaev and Sorokin2016 and results in the next section).
As in Kostyrya and Tarasenko (Reference Kostyrya and Tarasenko2015), current of a RAEB behind the anode foil was measured with a collector. These measurements were made for the both modes. When the breakdown voltage was maximum (~100 kV), the FWHM of some beam current pulses behind the 10 µm-thick aluminum foil was ~100 ps. The maximum voltage amplitudes at this setup were achieved when using hemispherical- and ball-shaped cathodes with the radii of curvature of 17.5 and 15.1 mm, respectively. Apparently, such a RAEB generation mode is realized when using both microsecond-duration voltage pulses (Loiko, Reference Loiko1980; Babich and Loiko, Reference Babich and Loiko2009) and voltage pulses with a short rise time (Babich, Reference Babich2003; Tarasenko et al., Reference Tarasenko, Skakun, Kostyrya, Alekseev and Orlovskii2004, Reference Tarasenko, Shpak, Shunailov and Kostyrya2005; Shao et al., Reference Shao, Tarasenko, Zhang, Baksht, Yan and Shut'ko2012; Tarasenko, Reference Tarasenko2016a, Reference Tarasenko2016b; Tarasenko et al., Reference Tarasenko, Baksht, Beloplotov, Burachenko, Lomaev and Sorokin2016; Zhang et al., Reference Zhang, Tarasenko, Gu, Baksht, Beloplotov, Burachenko, Yan, Lomaev and Shao2017). However, in our experiments, the energy of electrons in the first mode did not exceed 50 keV.
Pulses of the RAEB current were registered with the collector mounted behind the Al foil with the thickness of 10 µm. A foil with such thickness does not pass electrons with energy <30 keV. When increasing the foil thickness twofold, there was no desired signal from the collector. Consequently, the energy of electrons was not higher than 50 keV. This is in contradiction with the results presented in Loiko (Reference Loiko1980) and Babich and Loiko (Reference Babich and Loiko2009), where the electron energy corresponded to the breakdown voltage.
When replacing an Al foil with a metallized kimfol film passing electrons with the energy higher than 10 keV, in the experiments with the 17.5 mm-dimeter hemispherical cathode a beam containing 108 electrons was obtained. The transmittance of the anode grid was 64%. It should be noted that when the grid and kimfol film were used, the duration of the beam current pulse increased. In addition, it was found that the duration of the RAEB current pulse varies from pulse to pulse. By using spherical-shaped cathodes at a gap width of 20 mm, the effect of the cathode diameter on the RAEB current pulse amplitude was studied. The highest amplitude of the beam current pulse was realized when using the 17.5 mm-diameter hemisphere-shaped cathode. The measurements were carried out with a 62 mm-diameter collector. In this case, the voltage across the gap was the greatest. When using the tubular and cone-shaped cathodes, the breakdown voltage decreased. This led to a decrease in the RAEB current pulse amplitude. The beam current with the cone-shaped cathode was more than that with the tubular one.
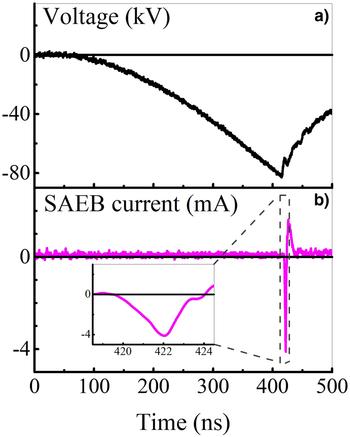
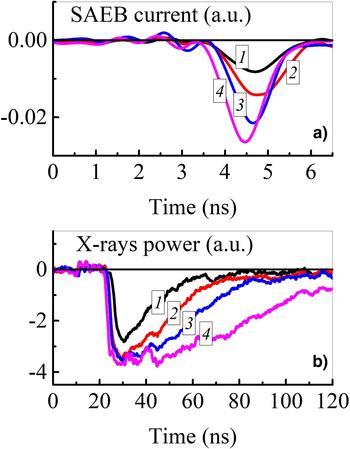
In the experiments with ball-shaped cathodes at the voltage <100 kV, but in the presence of the QSP, the FWHM of the RAEB current pulse became higher than 1 ns (see Fig. 6). It was about 2 ns. Since the mode of generation of a RAEB with the FWHM of the current pulse of ≥1 ns had not previously been studied, special attention was paid to it. It was established that the FWHM of the RAEB current and X-ray radiation pulses increase with decrease in the breakdown voltage relatively to its maximum amplitude values. Similar increase in the FWHM of the beam current pulse was observed only in the presence of the QSP. However, in this case, the electron energy decreases. Therefore, to measure the RAEB current, anode foils of minimum thickness must be used. There are waveforms of beam current pulses with different FWHMs in Figure 7.
Waveforms of the voltage across the gap (a) and RAEB current (b). A 15.1 mm-diameter ball-shaped cathode. The gap width is 20 mm.

Waveforms of the RAEB current behind the anode made of kimfol film (a) and X-ray radiation with a 30 µm-thick Al anode foil (b). A 15.1 mm-diameter ball-shaped cathode. The gap width is 22 mm.

All of the waveforms in Figure 7 were recorded at approximately the same breakdown voltage (≈80 kV). As a rule, an increase in the amplitude of the beam current pulse led to a decrease in its FWHM. Nevertheless, even when registering the RAEB current pulses with the 62 mm-diameter collector from the whole area of the kimfol anode, their FWHM did not exceed several nanoseconds. It could be related with a decrease in the electron energy during the phase of rapid voltage drop.
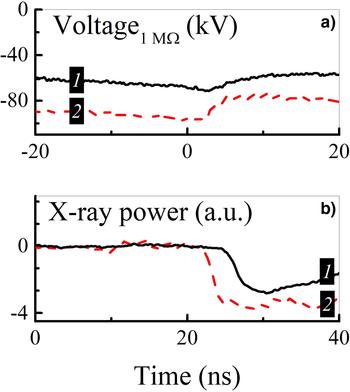
By using filters of different thickness and changing the distance between the grid anode and the receiving part of a collector, it was shown that the electron energy in the beam during the QSP is ≤10 keV. This explains the difficulty of registration of low-energy runaway electrons with a collector in atmospheric-pressure air. Therefore, X-ray radiation having greater penetration power was registered in the experiments. Aluminum foils of thicknesses of 10, 30, and 100 µm or a copper foil of thickness of 20 µm were used as an anode. Luminescence of the scintillator arising due to the action of X rays was registered with the PMT-100. Waveforms of the scintillator luminescence caused by X-ray radiation are presented in Figure 7b and Figure 8b.
Waveforms of the voltage (a) and corresponding their waveforms of the luminescence from the scintillator exposed by X rays (b).

There are voltage pulses synchronized with X-ray radiation pulses in Figure 8. The duration of X-ray radiation pulses, like a breakdown voltage, varied from pulse to pulse. It is seen from Figure 7 that under the same conditions the duration of the X-ray pulses radiation does essentially exceed that of the RAEB current pulses. When there is a QSP on the voltage waveform, X-ray radiation pulses with the duration of tens or hundreds of nanoseconds are observed (Figs 7b and 8b). As in Kostyrya and Tarasenko (Reference Kostyrya and Tarasenko2015), in these experiments maximum values of the FWHM and the base duration of the X-ray radiation pulse were ~100 and ~200 ns, respectively. The difference in the durations of RAEB current and X-ray radiation pulses is due to the decrease in the voltage across the gap during the QSP and, consequently, the decrease in the energy of runaway electrons. In the second mode, high-energy electrons generated at the highest voltage across the gap during the breakdown stage are registered with a collector. As it was established in Naidis et al. (Reference Naidis, Tarasenko, Babaeva and Lomaev2018), breakdown of the gap occurs due to the movement of a front of the ionization wave (streamer) from the cathode to the anode. After the breakdown, the diffuse discharge forms in the gap and the voltage across the gap decreases slowly. As mentioned earlier, a RAEB, which is leading to the generation of X-ray radiation pulses of long duration, is not registered with the collector. The duration of a registered RAEB current pulse is approximately equal to the fall time of the voltage pulse at the phase of rapid drop (Fig. 6).
Experimental results for the rise time voltage pulse of 50 ns
In the experiments at this setup, measurements with a collector of RAEB current behind the 20 µm-thick Al foil were failed. This can be explained by the high inductance of the gas diode. Therefore, using the above-mentioned high sensitive system, spectra of X-ray radiation were studied under different conditions in pulse-periodic mode. This ensured the possibility of measuring in a short time. In addition, because of shorter duration and rise time of the voltage pulse, the diffuse discharge could be formed when changing in wide limits the charging voltage and the gap width.
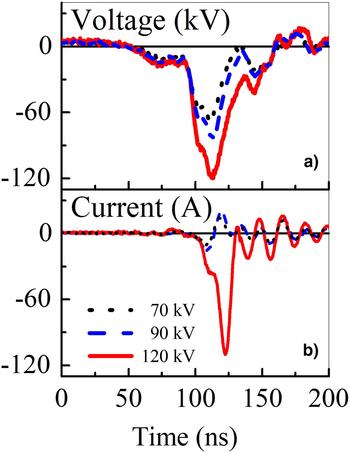
Compared with the gas discharge formed by microsecond-duration voltage pulses (see previous section), a discharge realized at higher dV/dt has different characteristics. This section is devoted to study the effect of the voltage pulse amplitude on discharge properties. An interelectrode unit had the “tube-plane” geometry. A brass tube served as a cathode. An anode had a 50 µm-thick Cu foil. The gap width was kept to 8 cm. The pulse repetition rate was set to 1 kHz. The experiments were carried out at the following amplitudes of the voltage pulse: 70, 90, and 120 kV. Waveforms of the applied voltage and discharge current are shown in Figure 9.
Waveform of the applied voltage (a) and discharge current (b).

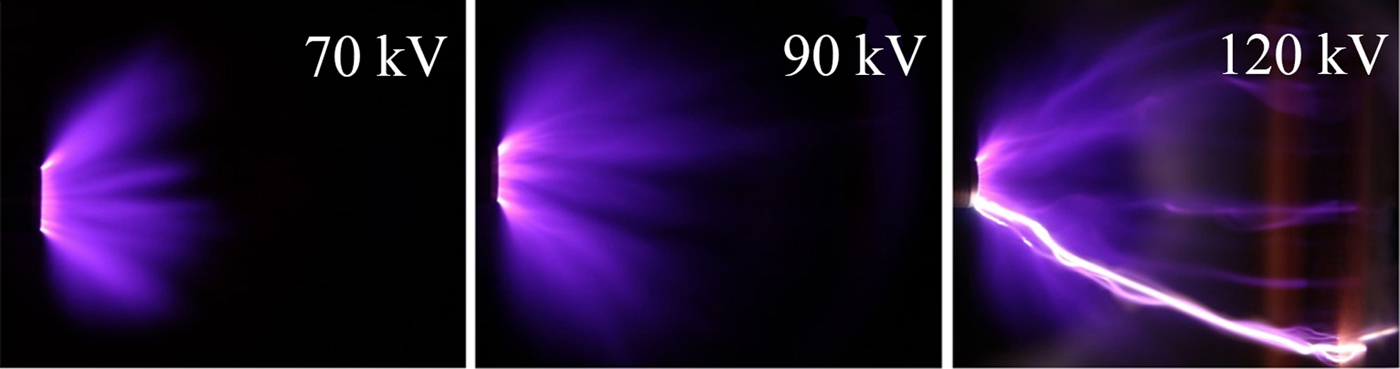
The discharge current amplitude increases with an increase in the voltage pulse amplitude. When the amplitude of applied voltage is 70 or 90 kV, the registered discharge current pulse is bipolar and its amplitude is <30 A. This indicates that the discharge does not turn into the spark mode. While at the applied voltage of 120 kV, there is a unipolar pulse with the amplitude more than 100 A on the waveform of the discharge current. This, in turn, indicates the presence of a spark discharge in the gap. Integral images of discharge plasma glow under different voltage pulse amplitudes captured with the digital camera are shown in Figure 10.
Integral images of the discharge plasma glow at different voltage pulse amplitudes. The gap width is 6 cm. The exposure time is 1 s.

When the applied voltage is 70 kV, a corona discharge is realized. The cone-shaped discharge region centers around the brass tube and spreads outwards. The distance at which the glow of the discharge plasma is still observed does not exceed 3 cm from the tubular cathode. The glow region looks fairly homogeneous. When the applied voltage is 90 kV, several diffuse jets appear on the background of the uniform discharge. These channels propagate toward the anode and some of them can reach it at the end of the voltage pulse. The discharge has a diffuse form. When the voltage is increased to 120 kV, some bright channels appear on the background of several diffuse jets. The form of the discharge ceases to be completely diffuse. The current amplitude becomes over 100 A (Fig. 9). The amplitude of X-ray radiation pulse increases with the increase in the voltage pulse amplitude.
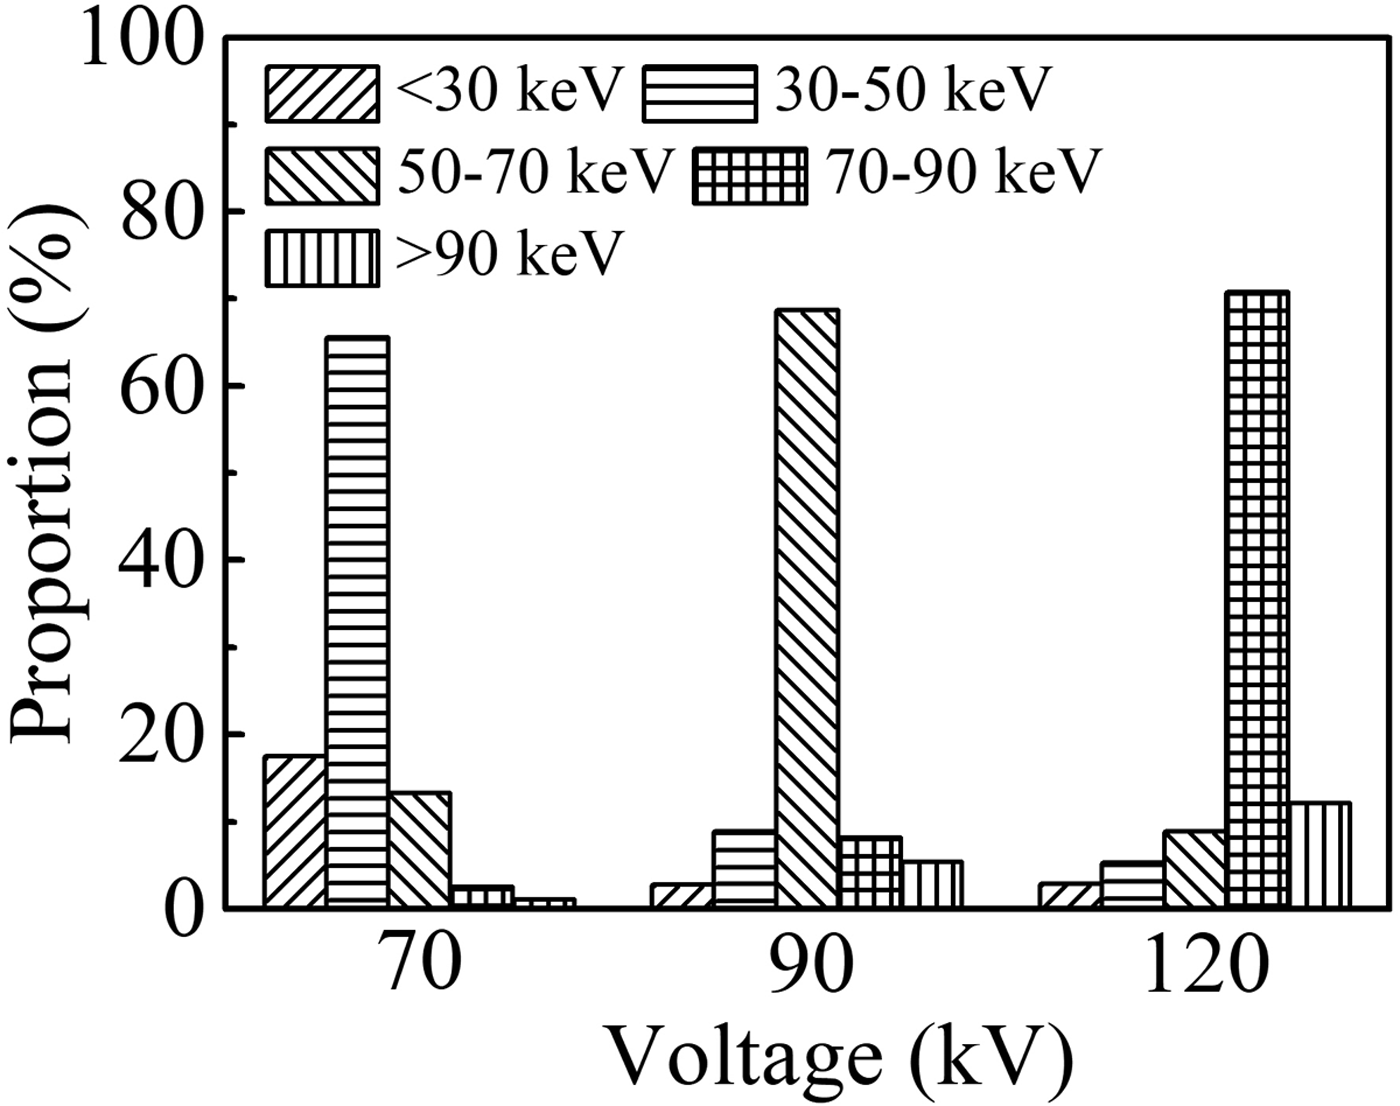
The energies of the most part of X-ray quanta corresponding to the amplitude of applied voltage of 70, 90, and 120 kV are 40 keV (57% of eU), 55 keV (61% of eU), and 82 keV (68% of eU), respectively. This is in agreement with the results in Tarasenko et al. (Reference Tarasenko, Shpak, Shunailov and Kostyrya2005; Reference Tarasenko, Baksht, Beloplotov, Burachenko, Lomaev and Sorokin2016), which reported that the main energy of runaway electrons at subnanosecond discharge is 60–70% of eU. Counts corresponding to the events of interaction of X rays with the scintillator were registered with the detector mentioned above. They were used to plot an energy distribution of X-ray quanta emitted at different amplitudes of the applied voltage (different discharge modes). Proportions of X-ray quanta corresponding to different energy intervals for amplitudes of 70, 90, and 120 kV are presented in Figure 11. At the amplitude of 90 kV, the number of counts was maximum, while at 70 kV it was the smallest.
Proportions of X-ray quanta corresponding to different energy intervals at different amplitudes of the applied voltage pulse.

The maximum of the distribution at different voltage corresponds to different energy interval. With increasing the amplitude of the applied voltage pulse, the proportion of X-ray quanta corresponding to different energy intervals changes in different ways (see Fig. 11). Overall, an increase in the amplitude of the voltage pulse leads to a decrease in the number of low-energy quanta and an increase in the high-energy quanta.
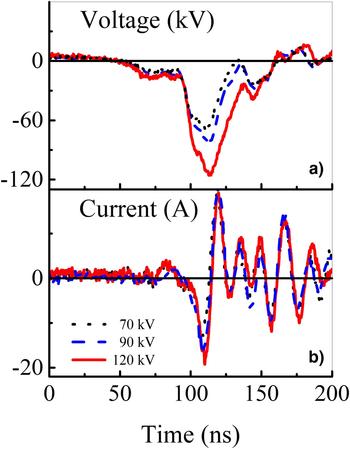
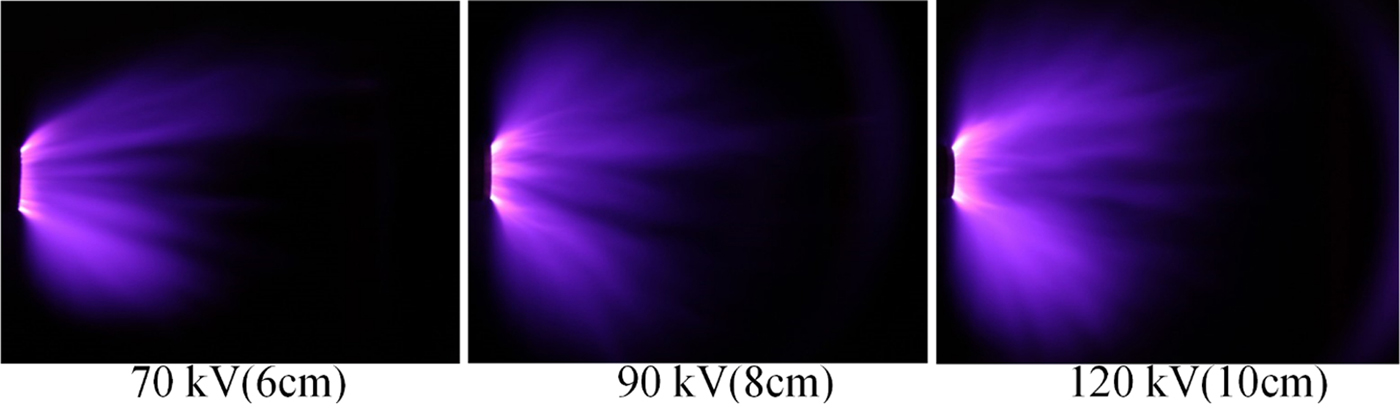
To investigate the discharge characteristics at similar electric field strengths, appropriate gap widths were chosen for the above-mentioned amplitudes of the applied voltage pulse. They were 6, 8, and 10 cm for the amplitudes of 70, 90, and 120 kV, respectively. Thus, the electric field strengths were 11.67, 11.25, and 12 kV/cm, respectively. The pulse repetition rate was set to 1 kHz. Waveforms of the applied voltage and discharge current are shown in Figure 12.
Waveforms of voltage and discharge current under similar electric field strength.

It is seen that the currents are in bipolar mode. The amplitude of all the current pulses is no more than 30 A. It indicates that the discharge does not turn into a spark mode. The corresponding images of the discharge plasma glow are shown in Figure 13.
Integral images of the discharge plasma glow under similar electric field. Exposure time is 1 s.

It is seen from Figure 13 that the discharge is realized in a diffuse mode. However, as the amplitude of the applied voltage pulse increases, the discharge becomes more uniform and occupies a large area, which relates to the gradient of a potential. All the voltage pulses have the same rise time. Thus, the higher the pulse amplitude, the higher the gradient.
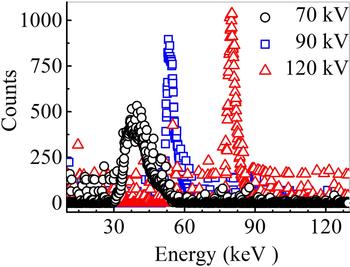
The energy distribution of X-ray quanta for the cases in Figure 13 is presented in Figure 14.
Energy distribution of X-ray quanta at similar electric field strength.

Under similar electric field and the same discharge mode, the maximum of the energy spectrum of X-ray radiation increases with the increase in the amplitude of the applied voltage pulse. The number of corresponding radiation counts also increases. This is due to the intensive ionization near the cathode at higher amplitude of voltage pulse, in spite of the similar electric field strength. This ensures greater fraction of high-energy runaway electrons, and, consequently, more X-ray radiation counts.
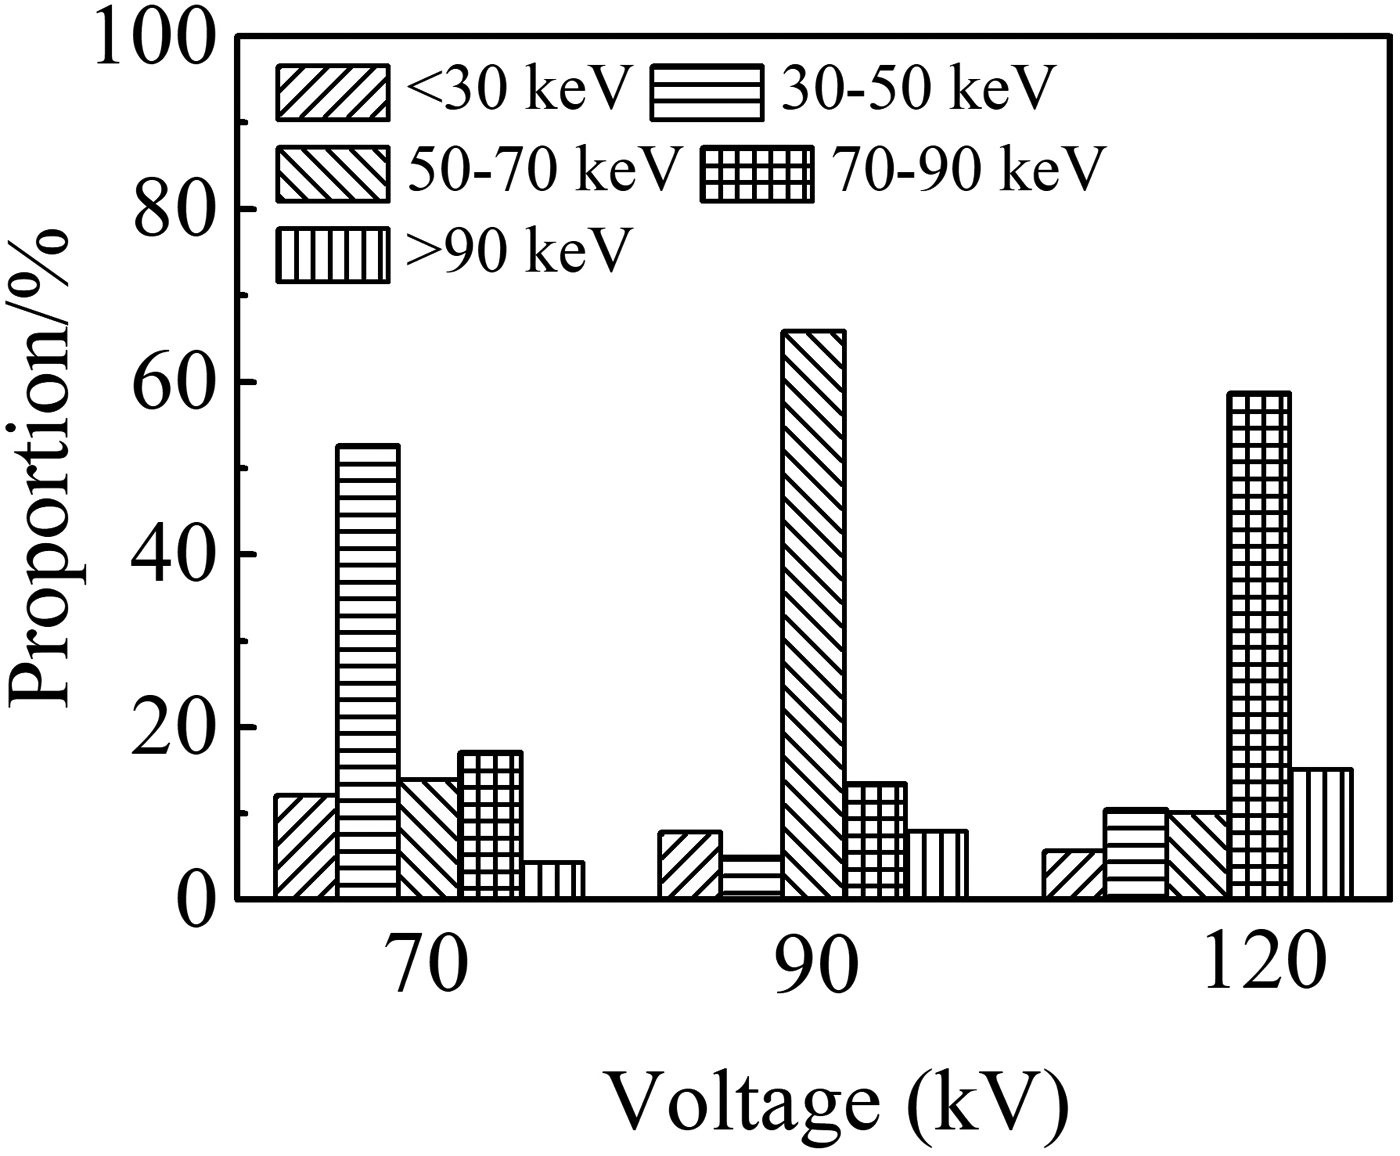
Proportions of X-ray quanta of different energy ranges for the case of similar electric field strength are presented in Figure 15. It is seen that although electric field is similar, distribution of proportions is different for different voltage amplitudes. This result indicates that the applied voltage pulse amplitude significantly affects the X-ray energy spectrum. The fraction of X-ray quanta with the maximum energy is 60%. When the amplitude of the applied voltage pulse is low, quanta of soft X-ray radiation dominate in the energy distribution (see Fig. 14). This is because a low amplitude of the applied voltage pulse means a short gap distance to keep a similar electric field, which makes the runaway electrons accelerate less time and easily gets a low energy providing soft X-ray radiation.
X proportions of X-ray quanta corresponding to different energy intervals for the similar electric field strength.

Discussion
The performed studies showed that at the breakdown of the gap of several centimeters length filled with atmospheric-pressure air, the diffuse discharge is formed due to applying a voltage pulse with the rise time of ≈500 ns and the amplitude of 50–100 kV. There is a QSP lasting tens or hundreds of nanoseconds. During this phase, runaway electrons are generated. At the end of the QSP, the voltage across the gap decreases rapidly and the diffuse discharge becomes the spark one. The second pulse confirming this arises on the waveform of the discharge current. When using ball-shaped and hemispherical cathodes, X-ray radiation pulses with the FWHM of ≈100 ns and RAEB current pulses with the FWHM of several nanoseconds are registered. Thus, under these conditions, the discharge burns first in a diffuse form, and then it turns into spark.
When using the hemispherical cathode with the radius of 17.5 mm, the highest voltage across the gap was realized. Under these conditions, beams consisting of about 108 electrons with the electron energy exceeding 10 keV were obtained. As well, pulses of runway electron beam current with the FWHM up to ~100 ps were registered. When using the cone-shaped cathode, the breakdown voltage decreases. This led to a decrease in the electron energy in the beam and to the complexity for their registration. Due to the small radius of curvature of tubular cathode, breakdown of the gap also occurred at a lower voltage. This, in its turn, explains impossibility of measurement of the RAEB current behind the anode foil with a cathode of such form.
The energy of runaway electrons during the QSP did not exceed 10 keV. It is significantly less than that during the phase of rapid voltage drop, when electrons have the energy more than 30 keV. As it follows from the calculations (Kozyrev et al., Reference Kozyrev, Kozhevnikov and Semeniuk2016), the generation of low-energy electrons at the stage of voltage drop occurs at the instant of bridging the gap by the ionization wave (streamer). Nevertheless, it is necessary to clarify that electrons become runaway and after this instant also. However, their energy is even lower. Thereby, in the experiments at the first setup, runaway electrons generated during the breakdown phase and X-ray radiation corresponding to the electrons with a lower energy generated during the QSP were registered.
In the experiments with the second setup, only X rays caused by the RAEB were registered. We suppose that because of large size, the gas diode had a high inductance, which resulted in current limitation during the pre-breakdown phase. This, in its turn, led to a decrease in the number of runaway electrons with high energy. Therefore, even having enough energy to pass through the 20 µm-thick Al foil (Figs 11, 13, 14), runaway electrons could not be registered with a collector. Nevertheless, X-ray radiation caused by their action on the anode or gas particles (air) was recorded. The gas diode used in the first setup had rather low inductance that provided an increase of the RAEB current.
Using the generator forming voltage pulses with the base duration of 30–40 ns and the rise time of ≈50 ns makes the ignition of a discharge in the diffuse form easier, which is saved even in the pulse-periodic mode. In this case, the energy of X-ray quanta arisen due to the braking of runaway electrons at the anode increases with increase in the voltage across the gap. It is even observed when saving the U/pd parameter. In the experiments with the second setup as in Shao et al. (Reference Shao, Tarasenko, Zhang, Baksht, Yan and Shut'ko2012), X-ray radiation was registered at corona discharge.
The obtained results and results reported in earlier papers (Bosamykin et al., Reference Bosamykin, Karelin, Pavlovskii and Repin1980; Shao et al., Reference Shao, Tarasenko, Zhang, Rybka, Kostyrya, Kozyrev, Yan and Kozhevnikov2011; Rybka et al., Reference Rybka, Andronikov, Evtushenko, Kozyrev, Kozhevnikov, Kostyrya, Tarasenko, Trigub and Shut'ko2013) allow claiming that runaway electrons continue to appear even at low average electric field strengths. However, to initiate the continuous electron acceleration process, it is need to create locally increased electric field strength. The presence of such field in the vicinity of the cathode with a small radius of curvature or near the front of the ionization wave ensures this process in a wide range of experimental conditions. Nevertheless, further experimental and theoretical studies are necessary to understand the mechanism of appearance of runaway electrons during the QSP that lasts hundreds of nanoseconds.
Conclusion
When applying voltage pulses of microsecond duration with the amplitude of ~100 kV to the centimeters-length gaps, RAEBs are registered behind the thin anode foil. The amplitude and duration of a beam current pulse under these conditions are significantly depending on the voltage across the gap, cathode design, and thickness of an anode foil. When using ball-shaped cathodes, registered RAEB current pulses have higher amplitude than those with cone-shaped or tubular cathodes. This is due to an increase of the breakdown voltage in the gap. To obtain the highest energy of runaway electrons and X-ray quanta, it is necessary to provide maximum voltage across the gap.
Acknowledgment
The studies with the first experimental setup were funded by RFBR according to the research project No. 18-52-53003_GFEN_a. The studies with the second experimental setup were funded by the National Natural Science Foundation of China according to the contract No. 11811530066.