I. INTRODUCTION
Al–Mg–Si aluminum alloys are ideal materials for automotive structure with low density, high ductility, and excellent processing characteristics. Profiles with thin walled and/or complex cross sections of these alloys used in modern automotive body structure are usually produced by extrusion. Before the extrusion trials, the extrudability could be simulated by finite element analysis (FEA). One of the important requirements for FEA is the flow behaviors of the material.Reference Peng, Xu, Gao and Fu1 Uniaxial hot compression test is often used to determine the flow stress response to plastic deformation under pre-set temperatures, strain rates, and strains typically encountered during conventional hot deformation processes.
During plastic deforming process, a proportion of the energy obtained from the unit time and volume is converted into plastic deformation heat, with the remaining consumed by microstructure evolution. The ratio of the temperature rise in the actual environment to that in the adiabatic environment is called the adiabatic correction factor (η). In general, η has been considered to be independent of temperature and strain. η was equal to 0 at low strain rates (≤0.001 s−1) and 1 at high strain rates (≥10 s−1).Reference Zhang, Di, Wang, Cao, Zhang and Ma2 At strain rates between 0.001 s−1 and 10 s−1, the adiabatic correction factor was traditionally considered to vary linearly with the logarithm of strain rate.Reference Rokni, Widener, Champagne, Crawford and Nutt3 In the study of Dadras and Thomas,Reference Dadras and Thomas4 η was taken to be 0, 0.25, 0.5, 0.75, and 1 for the strain rates of 0.001, 0.01, 0.1, 1, and 10 s−1, respectively. Charpentier et al.Reference Charpentier, Stone, Ernst and Thomas5 carried out compression tests on Al2024 and found that η varied from 0.414 to 0.759 at the strain rate of 0.1 s−1 and temperatures of 145 °C–485 °C, respectively. Goetz and SemiatinReference Goetz and Semiatin6 investigated η using the finite element method and found that η was a function of pre-set temperature, strain rate, strain, the heat transfer coefficients at the interfaces and the thermal properties of the workpiece.
The proportion of the energy converted into microstructure evolution, traditionally taken 0–10%, is defined as the mechanical work partitioning factor (φ). However, the materials flow behavior and microstructure evolution during the hot deformation process are often complex. According to the dynamic material model (DMM), the effects of strain rate, deformation temperature, and deformation degree on the efficiency of power dissipation are significant.Reference Wang, Hou, Luo, Zhang and Zhuang7,Reference Park and Kim8 During compression, the specimen exhibits work hardening at the initial deformation stage and then flow softening appears beyond a critical strain.Reference Gottstein, Frommert, Goerdeler and Schäfer9 The flow softening can be attributed to the microstructural changes and/or temperature rise during hot compression.Reference Chen, Liu, Liu, Zhou and Li10 In aluminum with high stacking-fault energy, dynamic recovery (DRV) is of great importance and recrystallization (DRX) occurs mainly by continuous dynamic recrystallization (CDRX).Reference Zhong, Gao, Feng, Lu and Mao11 At high strain rates, there is insufficient time for the cross-sliding and climbing of dislocations. Therefore, the density of dislocations and stored energy keeps at a high level.Reference Zhou, Liu, Zhou, Liu, Yu and Li12 Overall, the density of dislocations and stored energy reach a critical value, and then the process of DRV at lower temperature and DRX at higher temperature occur. DRX is beneficial to improve the intrinsic workability of metals for it can lead to the higher efficiency of power dissipation and lower activation energy.Reference Prasad, Sastry and Deevi13 At medium strain and medium temperatures, DRV becomes the dominant deformation mechanism and the corresponding efficiency of dissipation are lower. At low strain rates, there is possible for the growth of the misorientation among the subgrains and the evolution of subgrains to viable recrystallization nuclei. So the softening phenomenon is mainly attributed to DRV and DRX. With the increase of strain, there is competition between work hardening and work softening.Reference Ghasemi, Zarei-Hanzaki, Farabi, Tesař, Jäger and Rezaee14
From above literature studies, the adiabatic correction factor (η) and mechanical work partitioning factor (φ) were usually assumed to be constants. However, these two factors should be variable in actual deformation processes, which are usually carried out at mediate strain rates. This paper was aimed to clarify the variations of the factors φ and η of the 6063 aluminum alloy during the compression process at medium strain rates. Temperature rising based φ and η, and its influence on flow stress were studied. Then the extrusion experiment and finite element simulation of a square cross section 6063 hollow profile were performed to verify the reliability of the temperature compensation.
II. THEORETICAL APPROACH
A. Analytical expression for mechanical work partitioning factor (φ)
Dynamic materials modeling (DMM) was developed by Prasad.Reference Prasad15 In this model, the dissipated power (P) during the compression was converted into thermal (G) and microstructure evolution (J co-content):Reference Murty, Rao and Kashyap16
 $$P = \sigma \cdot \dot{\varepsilon } = G + J = \int_0^{\dot{\varepsilon }} {\sigma d\dot{\varepsilon }} + \int_0^\sigma {\dot{\varepsilon }d\sigma } \quad .$$
During the compression, the flow stresses changed with the strain rates and deformation temperatures. At a constant temperature, the flow stress (σ) of the workpiece could be expressed as the equation of strain rate ( $\dot{\varepsilon }$):
 $$\sigma = K{\dot{\varepsilon }^m}\quad ,$$
where K is a parameter that depends upon structure of the material and temperature. m is the strain rate sensitivity parameter and can be determined from
 $$m = {{{\rm{d}}J} \over {{\rm{d}}G}} = {{{\rm{d}}\left( {\ln \sigma } \right)} \over {{\rm{d}}\left( {\ln \dot{\varepsilon }} \right)}}\quad .$$
The mechanical work dissipation on microstructure evolution (J co-content) could be described in the following equation:
 $$J = \int_0^\sigma {\dot{\varepsilon }{\rm{d}}\sigma } = \int_0^\sigma {K'{\sigma ^{{1 / m}}}} {\rm{d}}\sigma = {m \over {1 + m}}\sigma \cdot \dot{\varepsilon }\quad .$$
Thus, the mechanical work partitioning factor (φ) can be expressed as
 $$\varphi = {J \over P} = {m \over {1 + m}} \times 100\% \quad .$$
B. Analytical expression for the adiabatic correction factor (η)
The adiabatic factor η in the plastic deformation process can be expressed as
 $$\eta = {{\Delta {T_{{\rm{Actual}}}}} \over {\Delta {T_{{\rm{Adiabatic}}}}}}\quad .$$
During hot compression, the heat loss of workpiece could be given by
 $${q_{{\rm{Dis}}}} = {q_{{\rm{Tra}}}} + {q_{{\rm{Rad}}}}\quad ,$$
where q Dis is the loss heat of the workpiece, q Tra is the heat loss to the dies, and q Rad is the heat lost by heat radiation. According to previous literature studies, q TraReference Goetz and Semiatin6,Reference Wang, Hou, Luo, Zhang and Zhuang7 and q RadReference Luo, Li and Ma17 could be calculated as
 $${q_{{\rm{Tra}}}} = h \cdot {A_1} \cdot {\rm{d}}{T_{\rm{w}}}\quad ,$$
 $${q_{{\rm{Rad}}}} = \beta \cdot {C_0} \cdot {A_2}\left[ {{{\left( {{{{T_{\rm{w}}}} \over {100}}} \right)}^4} - {{\left( {{{{T_{\rm{R}}}} \over {100}}} \right)}^4}} \right]\quad ,$$
where
 $$h = {\left[ {{{{x_{\rm{w}}}} / {{K_{\rm{w}}}}} + {1 / {{K_{{\rm{wD}}}}}} + {{{x_{\rm{D}}}} / {{K_{\rm{D}}}}}} \right]^{ - 1}}\quad ,$$
 $${A_1} = {V / {{x_{\rm{w}}}}}\quad ,$$
 $${A_2} = 2\sqrt {\pi \cdot V \cdot {x_{\rm{w}}}} \quad ,$$
and
 $${x_{\rm{w}}} = {x_0}\exp \left( { - \dot{\varepsilon } \cdot t} \right)\quad ,$$
 $${x_{\rm{D}}} = {{{k_{\rm{D}}} \cdot {A_{\rm{D}}} \cdot x_{\rm{w}}^2} / {\left( {{k_{\rm{w}}} \cdot V} \right)}}\quad ,$$
where h is an overall interface heat-transfer coefficient, including the thermal conductivity of the specimen, the heat-transfer coefficient of the specimen and platen, and the thermal conductivity of the platen. A 1 is the contact area between the specimen and platen. T w is the instantaneous temperature of workpiece during compression. T 0 is the pre-set temperature of the wokpiece. T R is the ambient temperature. ß is the emissivity of the workpiece. C 0 is the radiation coefficient of the workpiece. A 2 is one-half the lateral area of the workpiece and x 0 is the initial half-height of the workpiece. x w is half-height of the workpiece during the compression, K w is the workpiece thermal conductivity, K wD is the interface heat-transfer coefficient of the workpiece and platen, x D is the heat conduction distance in the platen, and K D is the platen thermal conductivity. X 0 is the initial one half height of the workpiece,  $\dot{\varepsilon }$ is the strain rate, and t is the compression time. V is one-half the volume of workpiece,
 $\dot{\varepsilon }$ is the strain rate, t is the deformation time and
 $t = {{\Delta \varepsilon } / {\dot{\varepsilon }}}$, and A D is the cross-sectional area of the platen.
According to Eq. (9), q Rad could be simplified to
 $${q_{{\rm{Rad}}}} = \beta \cdot {C_0} \cdot {A_2} \cdot {\left( {{{{T_0}} \over {100}}} \right)^4}\quad .$$
The change of the internal energy of workpiece can be written as
 $${{\left( {V \cdot \rho \cdot {C_{\rm{P}}}} \right)\left( {{\rm{d}}{T_{\rm{w}}}} \right)} / {{\rm{d}}t}} = \left( {1 - \varphi } \right) \cdot {q_{{\rm{Def}}}} - {q_{{\rm{Dis}}}}\quad ,$$
where
 $${q_{{\rm{Def}}}} = \sigma \cdot \dot{\varepsilon } \cdot V\quad ,$$
where q Def is the mechanical work.
Based on Eqs. (16) and (17), substituting Eqs. (7), (8), and (15) into Eq. (16):
 $${\rm{d}}{T_{\rm{w}}} = {{{{10}^8}\left( {1 - \varphi } \right) \cdot \sigma \cdot \dot{\varepsilon } \cdot V \cdot {\rm{d}}t - \beta \cdot {C_0} \cdot {A_2} \cdot T_0^4 \cdot {\rm{d}}t} \over {{{10}^8}\left( {V \cdot \rho \cdot {C_{\rm{P}}} + h \cdot {A_1} \cdot {\rm{d}}t} \right)}}\quad .$$
In adiabatic conditions, the temperature rise of the workpiece can be expressed as
 $${\rm{d}}{T_{{\rm{adiabatic}}}} = {{\left( {1 - \varphi } \right)\left( {\sigma \cdot \dot{\varepsilon } \cdot {\rm{d}}t} \right)} / {\left( {\rho \cdot {C_{\rm{P}}}} \right)}}\quad .$$
Substituting Eqs. (18) and (19) into Eq. (6) and then taking integration: the η can be expressed as follows:
 $$\eta = {{{{10}^8}\left( {1 - \varphi } \right) \cdot \sigma \cdot \dot{\varepsilon } \cdot V - \beta \cdot {C_0} \cdot {A_2} \cdot T_0^4} \over {{{10}^8}\left( {V \cdot \rho \cdot {C_{\rm{P}}} + h \cdot {A_1} \cdot {\rm{d}}t} \right)}} \cdot {{\rho \cdot {C_{\rm{P}}}} \over {\left( {1 - \varphi } \right) \cdot \sigma \cdot \dot{\varepsilon }}}\quad .$$
C. Analytical expression for temperature rise (ΔT)
The temperature rise due to adiabatic heating and could be calculated by
 $$\Delta T = {{\left( {1 - \varphi } \right) \cdot \eta \int_0^\varepsilon {\sigma {\rm{d}}\varepsilon } } \over {\rho \cdot {C_{\rm{P}}}}}\quad .$$
This equation considers the combined impacts of heat-transfer, microstructure evolution, and the material constants into temperature rises.
III. MATERIALS AND EXPERIMENTAL PROCEDURES
The chemical composition of the studied 6063 aluminum alloy was determined using a Q4-Tasman arc spark spectrometer (Bruker, Munich, Germany), with the compositions of 0.85% Mg, 0.47% Si, 0.2% Fe, 0.21% Cu, 0.01% Mn, 0.13% Cr, 0.25% Zn, and 0.15% Ti (wt%). As-cast billets with a diameter of 90 mm were homogenized at 813 K for 24 h and then cooled to room temperature in the air. Uniform grain structure was observed and the average grain size was around 100 μm according to ASTM: E112-13.
Cylindrical specimens used for hot compression tests were machined with a diameter of 10 mm and a height of 15 mm in accordance with ASTM: E209. A k-type thermocouple was spot-welded at the middle height point of the specimen surface. Graphite foils were placed between the specimens and platens for lubrication. The hot compression tests were conducted on a Gleeble-1500 machine (Data Sciences International, St. Paul, Minnesota) at different temperatures ranging from 573 to 773 K and at different strain rates ranging from 0.01 to 10 s−1. The specimen was heated to a pre-set temperature at a rate of 10 K/s, and then soaked for 120 s to ensure temperature equilibrium. After being compressed to a height of 6.1 mm, reaching a true strain of 0.9, the specimens were water-quenched to preserve their microstructure. Three samples were used for each condition. All the tests were performed in nitrogen atmosphere.
The specimens were sliced parallel to the compression direction for microstructural observation after compression. The microstructures were investigated by using an optical microscope and EVO MA10 scanning electron microscope (Carl Zeiss, Oberkochen, Germany) equipped with the electron backscattered diffraction (EBSD) detector. The samples were electropolished with 7 vol% HClO4 acids in alcohol at the voltage of 25 V for 6 s. EBSD was carried out with a step size of 0.5 μm. Commercial software HKL Channel 5 (Oxford Instruments, Abingdon, United Kingdom) was used for EBSD data processing.
IV. RESULTS AND DISCUSSION
A. Flow behavior and microstructure
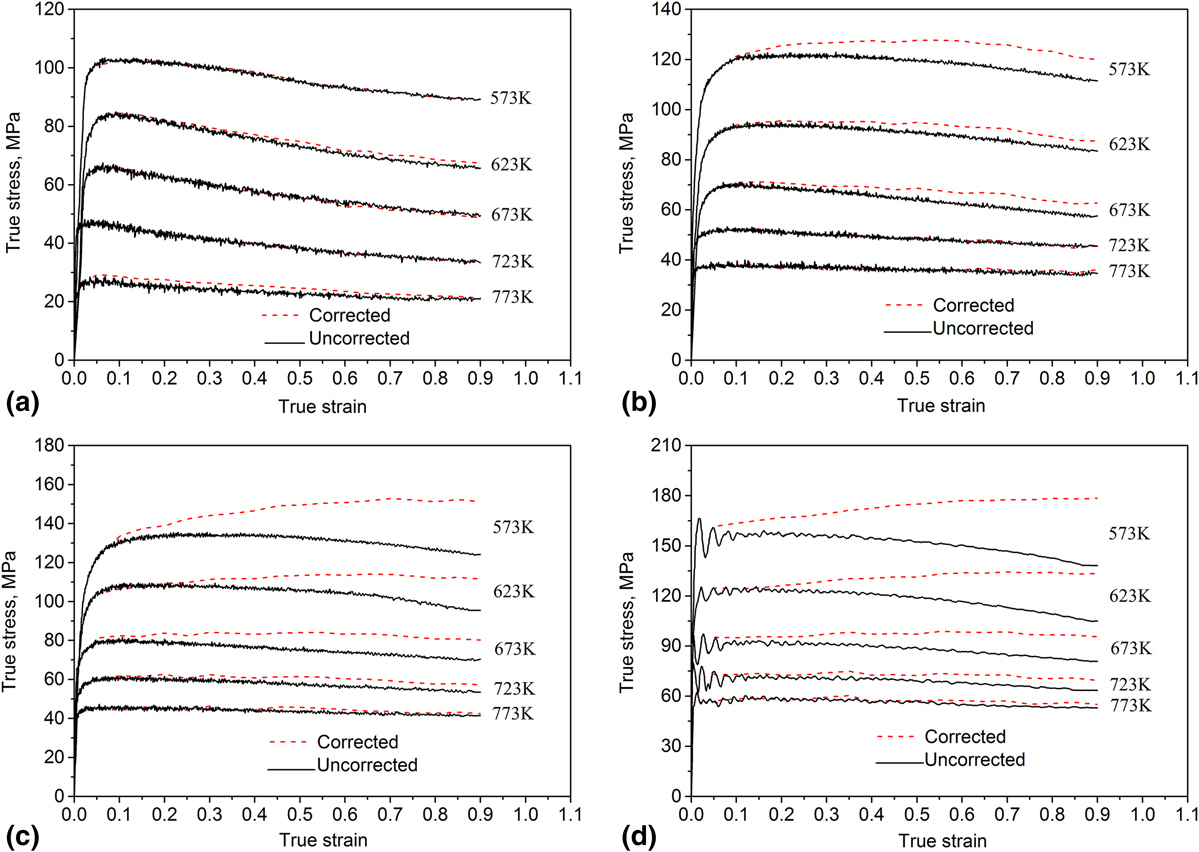
Figure 1 shows the true stress–true strain curves of the 6063 aluminum alloy at the strain rates ranging from 0.01 to 10 s−1 and at the temperatures ranging from 573 to 773 K. There is an obvious flow softening for uncorrected stress–true strain curve after reaching a peak stress. This flow softening could be caused by microstructure evolutions and deformation heating during compression, either alone or together. Examples of microstructure evolutions are DRV, DRX, development of texture, and so on. Deformation heating results in an increase in specimen temperature during the test, and the resulting flow stress will be lower than the actual flow stress for the desired test temperature under isothermal conditions. After temperature rise compensation, the values of corrected flow stresses are greater than that of uncorrected flow stresses, as shown in Fig. 1. The detailed correction method will be instructed later.
True stress–strain curves of the 6063 aluminum alloy at strain rates of (a) 0.01 s−1, (b) 0.1 s−1, (c) 1 s−1, and (d) 10 s−1.

It can be seen that the uncorrected flow stresses decrease with increasing pre-set temperature at the same strain rate and increase with increasing strain rate under a constant temperature. Under a given pre-set temperature and stain rate, the flow stress runs up to a peak stress rapidly at the beginning, followed by a continuous decrease with the strain reaching 0.9. The decrease of flow stress is more obvious at lower strain rate and higher temperature. It may be due to the microstructure evolution during compression, such as DRV and DRX, and deformation heating.Reference Rath and Pande18,Reference Zhang, Jiang, Shang and Li19
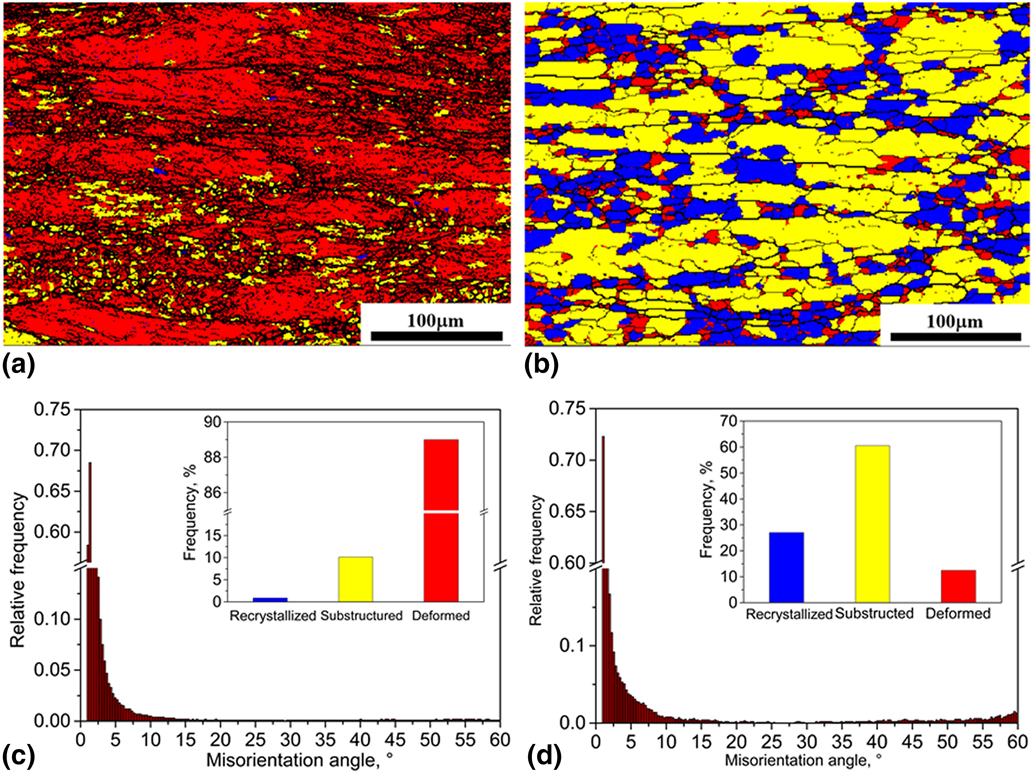
Figures 2(a) and 2(b) show the EBSD images of the grain structure under different deformation conditions. The thick black lines show the high grain boundaries with a misorientation larger than 15° and the low grain boundaries with a misorientation between 2° and 15° are represented by the thin black lines. The low grain boundaries with a misorientation smaller than 2° are ignored.
EBSD images of grain structure after hot compression of (a) 573 K and 1 s−1 and (b) 773 K and 0.01 s−1, and misorientation angle distribution and the recrystallization fraction of (c) 573 K and 1 s−1 and (d) 773 K and 0.01 s−1.

Figure 2(a) exhibits the typical DRV structures under a strain rate of 1 s−1 and deformation temperature of 573 K. During the hot compression at 773 K and 0.01 s−1, recrystallized microstructures are obviously detected [shown in Fig. 2(b), blue color]. Figures 2(c) and 2(d) are the misorientation angle distributions at different deformation conditions. It can be seen that the misorientation angles are mostly less than 15°. The fractions of high grain boundaries increase with increasing deformation temperature and decreasing strain rate [Fig. 2(d)]. The inset at the upper right corner in Figs. 2(c) and 2(d) are the fractions of recrystallization for the different deformation conditions. There is a negligible fraction only about 0.85% of recrystallized grain (blue color) under a strain rate of 1 s−1 and deformation temperature of 573 K. The recrystallized fractions at 773 K and 0.01 s−1 after hot defamation is about 26.8%.
After hot compression, the specimen is immediately quenched to the water. The large fraction of recrystallized grains at high temperature and low strain rate could be attributed to DRX instead of static recrystallization. The major reason is that high temperature provides higher energy for grain boundary migration and the low strain rate affords enough time for dislocation motion. Zhang et al.Reference Zhang, Li, Yuan and Peng20 performed hot compression on the Al–Mg–Si–Cu aluminum alloy at elevated temperature and proposed that low Z ( $Z = \dot{\varepsilon } \cdot \exp \left( {{Q \over {RT}}} \right)$), namely high temperature and low strain rate, is in favor of DRX. Wang et al.Reference Wang, Luo, Hou, Zhang and Zhuang21 characterized the workability of the AA7075 aluminum alloy and found that CDRX could be the main reason for higher power dissipation under high temperature during compression. Yang et al.Reference Yang, Deng, Zhang, Liu, Jia and Huang22 investigated the effect of strain rate on the DRX mechanism of the Al–Zn–Mg–Cu aluminum alloy and found that the volume fraction of recrystallized grain decreased from 10 to 4.3% when the strain rate increased from 0.001 to 0.1 s−1 at a strain of 0.9 and deformation temperature of 723 K.
B. Computation of adiabatic correction factor (η)
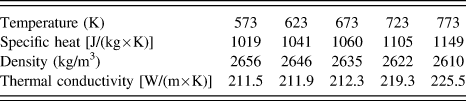
Values of η were calculated via Eqs. (10)–(14) and (20) for each strain in the range of 0–0.9 with an interval of 0.05. Values of ρ, C p, and K w of the workpiece for different temperatures are adopted from Refs. Reference Krishna, Shridhar and Krishnamurthy23 and Reference Mills24, as shown in Table I. The values of K D of the die material for different temperatures are adopted from Ref. Reference Mills24.
Values of thermodynamic parameters of the 6063 aluminum alloy.

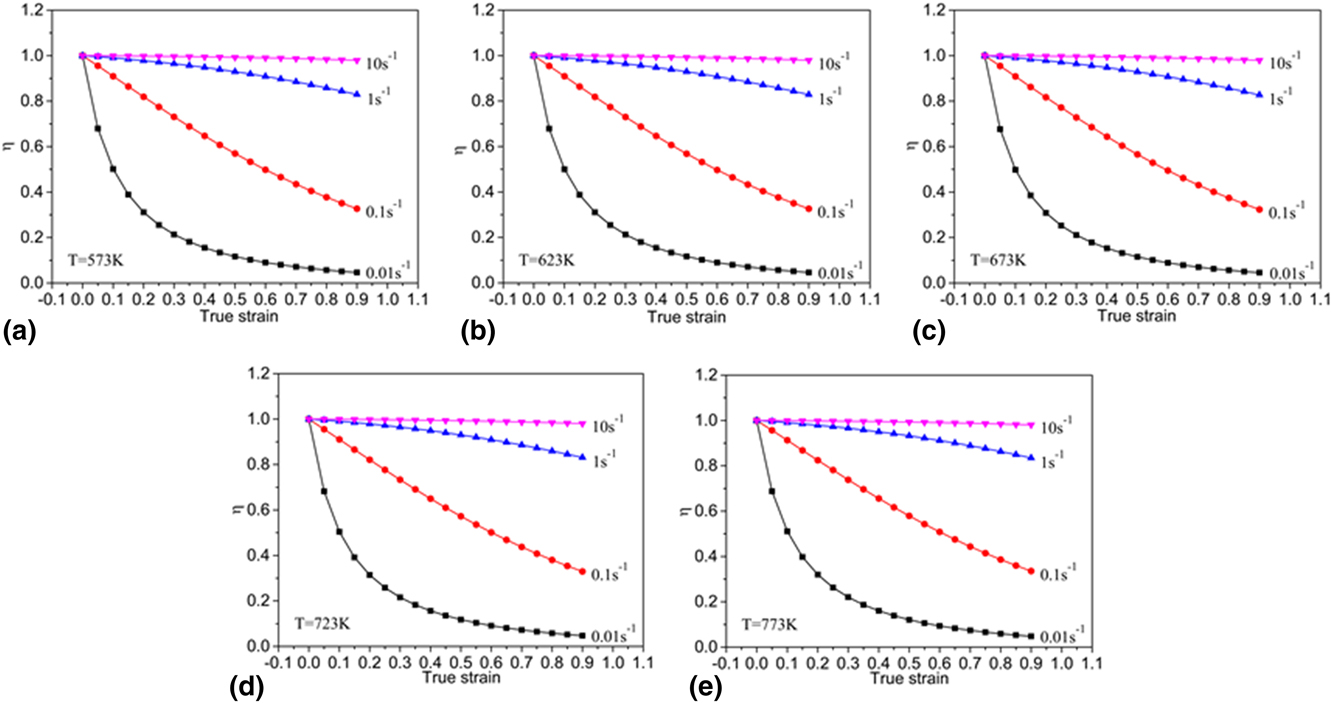
Figure 3 demonstrates the variation of η with ε for samples deformed at different strain rates and pre-set temperatures. The η value decreases with increasing strains and decreasing strain rates. With increasing the strain, the flow stresses decreased continuously beyond a critical strain (see in Fig. 1) and the area of contact surface between the specimen and pressure head increased. This would lead to the heat loss with increasing strains. During compression, the friction between the specimen and pressure head could lead to the increase of flow stress and with the increasing deformation extent the influence becomes more and more significant due to the constant increase of the interfacial area between the specimen and pressure head. Therefore, the corrected flow stresses are always lower than measured ones. However, graphite foils were placed between the specimens and pressure head before compression to reduce the impact of friction. Therefore, the effect of friction on the stress could be neglected in this study. But the interfacial heat transfer between the specimen and pressure head increases due to the constant increase of the interfacial area between the specimen and pressure head, leading to the decrease of η.
Plots of the calculated η at (a) 573 K, (b) 623 K, (c) 673 K, (d) 723 K, and (e) 773 K (x D = 25 mm, K wD = 4×10³ W×m−2× K−1, and β = 0.8 W×m−1× K–1).

At higher strain rate, the deformation time span become shorter, implying that the heat loss of the specimen decreases during the compression. Therefore, the η value would be higher. When the pre-set temperature is higher, the values of thermodynamic parameters of the the investigated 6063 aluminum alloy and thermal conductivity of die materials do not increase obviously,Reference Mills24 so the η value slightly changes with the increase of pre-set temperatures. In Fig. 3, it can also be seen that the η increase with increasing strain rates and the relationship between η and strain rates become nonlinear because of the heat transfer, which is different from the traditionally used constant values of η [0 (10−3 s−1), 0.25 (10−2 s−1), 0.50 (10−1 s−1), 0.75 (100 s−1), and 1.0 (10 s−1)].Reference Oh, Semiatin and Jonas25 There, a constant η will underestimate the temperature for small strains and overestimate it for large strains. When strain is greater than 0.7, the error would be large.
C. Computation of the strain rate sensitivity parameter (m)
The values of m could be calculated based on the three-order polynomial fitting method for ln σ versus  $\ln \dot{\varepsilon }$ at a given strain.Reference Luo, Li and Wu26 The relationship between ln σ and
 $\ln \dot{\varepsilon }$ can be described as follows:
 $$\ln \sigma = {k_1} + {k_2} \cdot \ln \dot{\varepsilon } + {k_3} \cdot {\left( {\ln \dot{\varepsilon }} \right)^2} + {k_4} \cdot {\left( {\ln \dot{\varepsilon }} \right)^3}\quad ,$$
where k 1, k 2, k 3, and k 4 are the material constants. Substituting Eq. (22) into Eq. (3), the strain rate sensitivity parameter (m) of the 6063 aluminum alloy can be expressed as follows:
 $$m = {k_2} + 2{k_3} \cdot \ln \dot{\varepsilon } + 3{k_4} \cdot {\left( {\ln \dot{\varepsilon }} \right)^2}\quad .$$
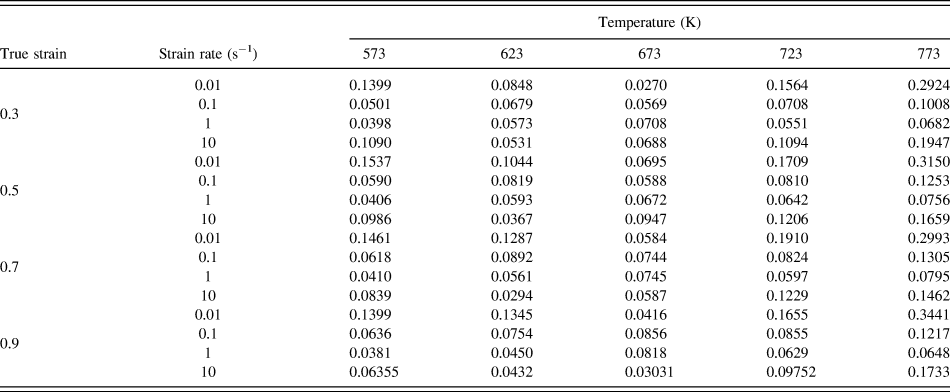
The evolutions of flow stress as a function of strain rates and true strains of 0.3, 0.5, 0.7, and 0.9 are fitted with cubic spline and the slope of every fitted cubic spline was accepted as m-value given in Table II.
The values of m calculated at different conditions.

D. Computation of the mechanical work partitioning factor (φ)
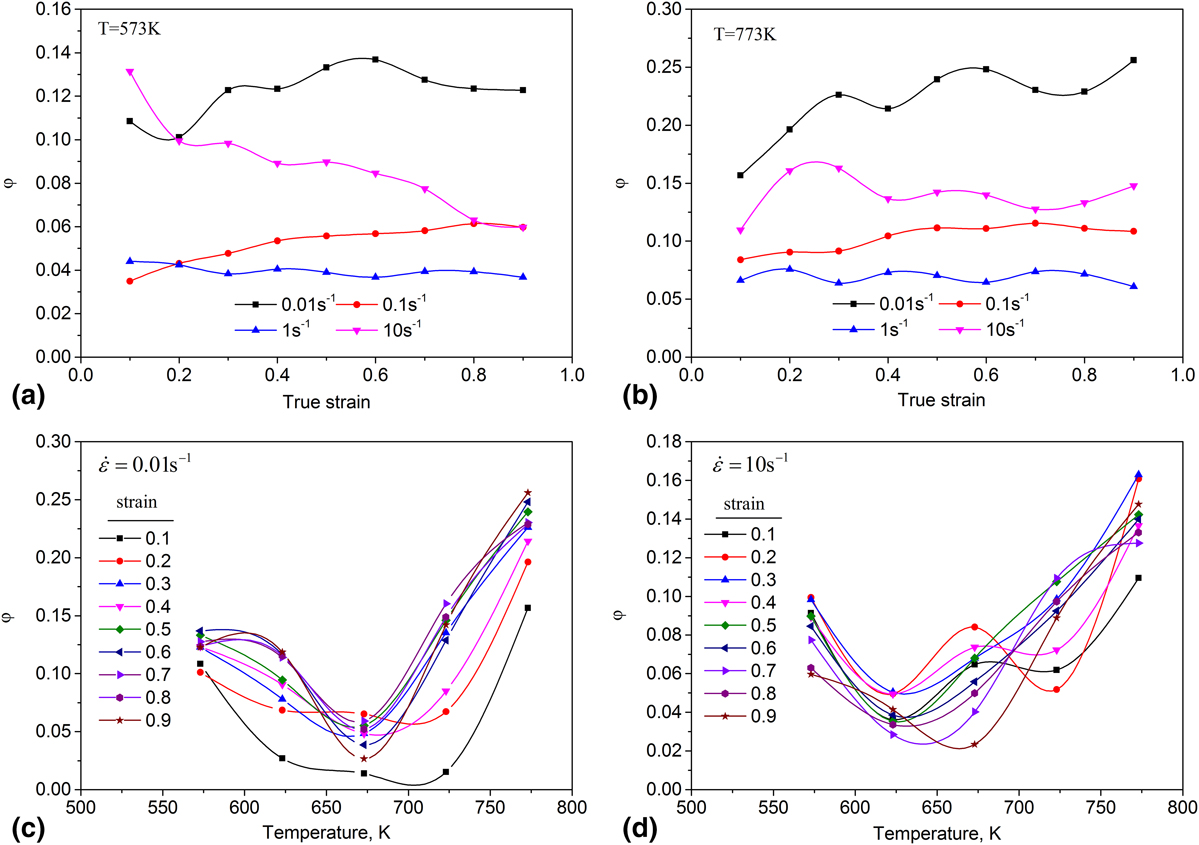
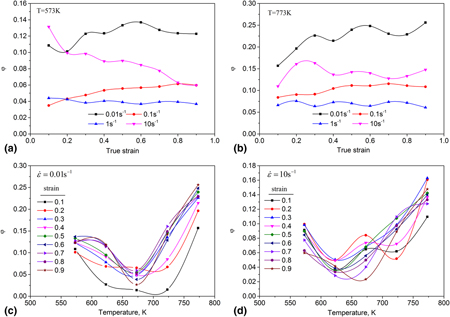
Values of φ were calculated via Eqs. (23) and (5) for each strain in the range of 0–0.9 with an interval of 0.05. The mechanical work partitioning factor (φ) with strains and temperatures are shown in Fig. 4.
Variations of φ at temperatures of (a) 573 K and (b) 773 K, and at strain rates of: (c) 0.01 s−1 and (d) 10 s−1.

Figures 4(a) and 4(b) show the variation of φ with strains at temperatures of 573 and 773 K for different strain rates. φ decreases with increasing strain rate, except at a strain rate of 10 s−1. This is mainly ascribed to DRV. Zhou et al.Reference Zhou, Li, Li, Peng, Zurob and Wu27 pointed out that aluminum alloys are more prone to DRV due to high stacking-fault energy. When DRV occurs, subgrains are developed through the conversion of dislocation cell walls.Reference Zamani, Dini, Svoboda, Lindgren, Seifeddine, Andersson and Jarfors28 At high strain rate, there is insufficient time for the growth of the misorientation among the subgrains.Reference Pu, Zheng, Song, Feng and Dong29 It can be seen that the effects of strain on the mechanical work partitioning factor are not obvious at the steady state (strain >0.2) from Figs. 4(a) and 4(b). However, there is a decreasing trend of φ with increasing strain at a temperature of 573 K and a strain rate of 10 s−1. The main reason is the inhomogeneous recrystallized microstructures in the early stage and the flow localization caused by deformation heat at lower temperature and higher strain rate. With the increase of strain, the degree of inhomogeneous recrystallization does not increase due to the flow localization.Reference Zhang and Di30–Reference Saxena, Pancholi, Jha, Chaudhari, Srivastava and Dey32 In addition, it can be seen from Fig. 4(b) that at a temperature of 773 K, maximum φ is achieved at a strain rate of 0.01 s−1. This might be a result of metallurgical phenomena such as DRX consuming the input power.Reference Li, Zhou and Duszczyk33 This result is in confirmation with the metallographic observation illustrated in Fig. 2(b) where 26.8% DRXed grains were observed at a strain rate value of 0.01 s−1 and a temperature of 773 K.
Figures 4(c) and 4(d) show an important trend of φ with temperature at different strain rates and strains. It can be seen that at the steady state (strain >0.2), φ decreases with increasing temperature, and then increases rapidly. The main reason is that the main softening mechanism is DRV at lower temperatures. The dislocation density and deformation defects decrease with increasing temperature during compression, leading to a low φ. At high temperatures, the main softening mechanism is DRX. Generally, the DRX usually occurs in the domain with high consume power dissipation and φ is high.Reference Ghasemi, Zarei-Hanzaki, Farabi, Tesař, Jäger and Rezaee14
E. Temperature rising
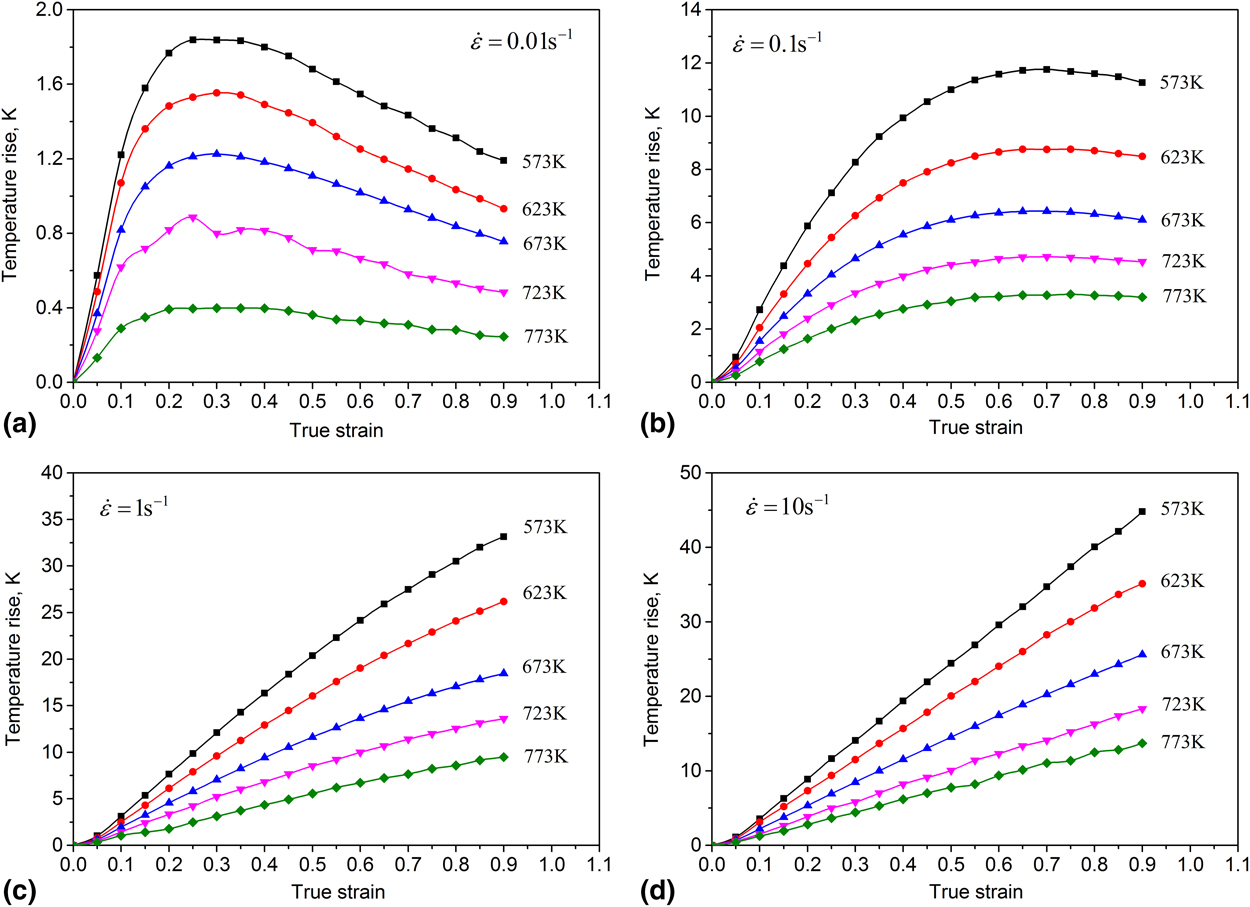
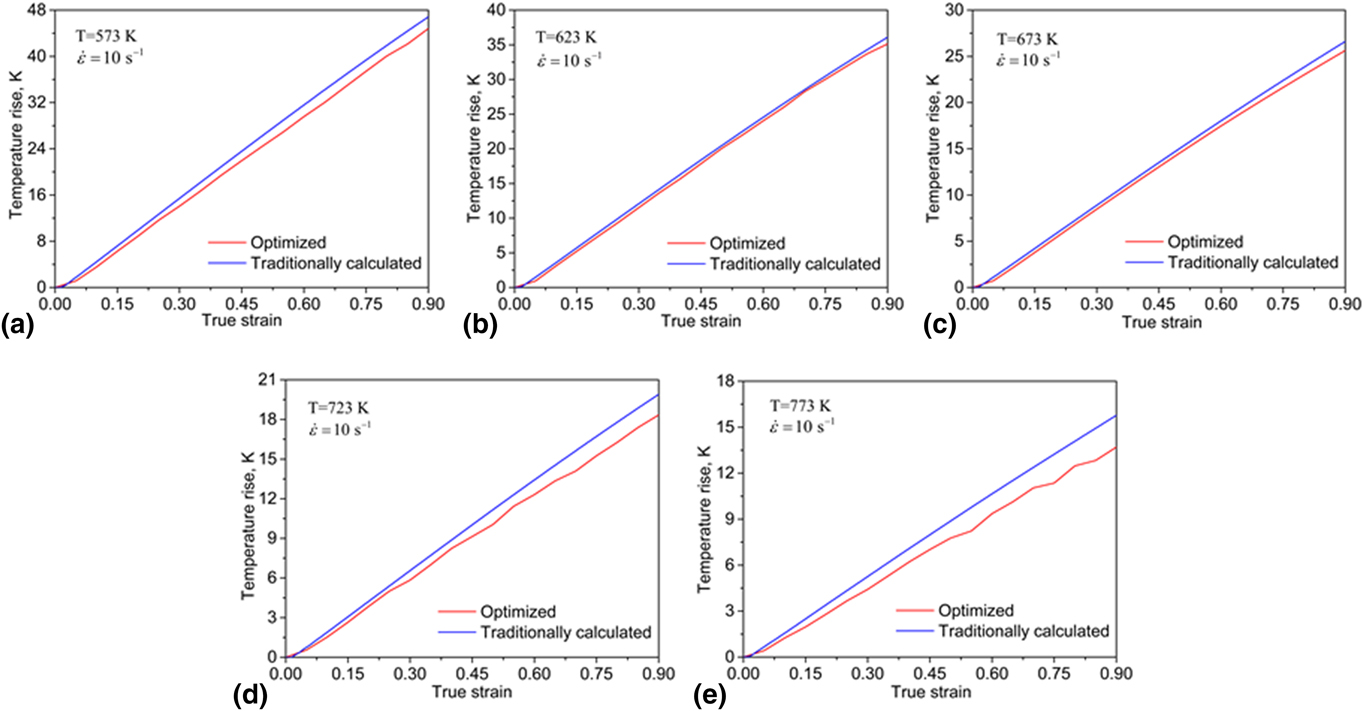
Values of ΔT were calculated via Eqs. (5), (20), and (21) for each strain in the range of 0.05–0.9 with an interval of 0.05, as can be seen in Fig. 5. Figure 5 shows the temperature risings during the compression test at temperatures ranging from 573 to 773 K and at strain rates ranging from 0.01 to 10 s−1. It can be seen that at strain rates of 0.01 s−1, the temperature change is slight. However, at a strain rate of 10 s−1 and a strain of 0.9, the temperatures increase by 44, 35, 25, 18, and 13 K for temperatures of 573, 623, 673, 723, and 773 K, respectively. There exists a roughly linear relationship between ΔT and ε at a constant strain rate and deformation temperature. Similar behavior has been observed in other materials.Reference Zhang, Jiang, Shang and Li19,Reference Castellanos, Rieiro, Carsí, Muñoz, Mehtedi and Ruano34 Meanwhile, ΔT is more pronounced at higher strain rate, which corresponded to the adiabatic correction factor in Fig. 3.
Variation of temperature rise at various strain rates of (a) 0.01 s−1, (b) 0.1 s−1, (c) 1 s−1, and (d) 10 s−1.

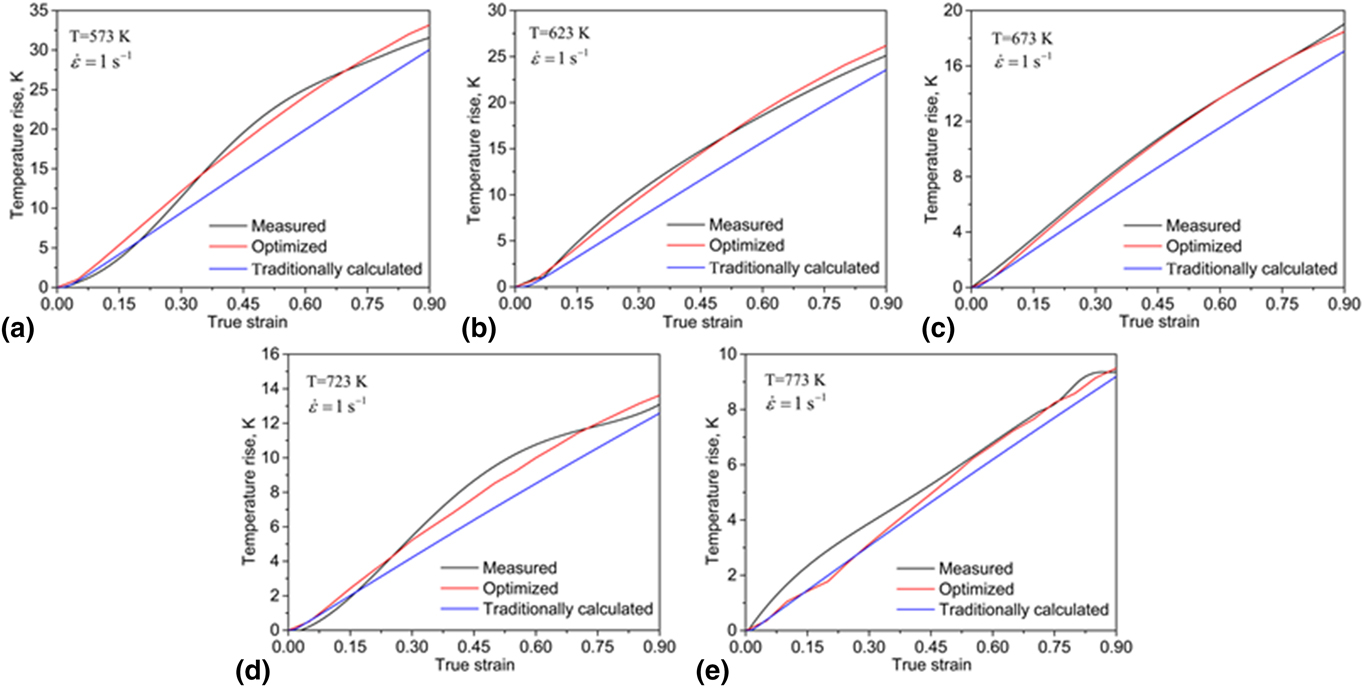
Figure 6 shows the measured, optimized, and traditionally calculated temperature rises under strain rates of 1 s−1. The measured temperature rise displays a wave-like curve and increases with the increase of strain and decrease of pre-set deformation temperature, as shown in Fig. 5. The traditionally calculated temperature rises are lower than that of the measured and optimized since in the traditional method the temperature rise is calculated assuming η = 0.75 and φ = 0.05. The fraction of mechanical work transformed to temperature rise is lower than the optimized. Meanwhile, good agreements between the optimized and measured temperature rises at a medium strain rate are observed in Fig. 6. Therefore, the adiabatic correction factor and mechanical work partitioning factor should be taken into consideration during temperature rise correction.
A comparison of measured and calculated temperature rise under a strain rate of 1 s−1 and pre-set deformation temperatures of (a) 573 K, (b) 623 K, (c) 673 K, (d) 723 K, and (e) 773 K.

Figure 7 shows the optimized and traditionally calculated temperature rises under strain rates of 10 s−1. The temperature rise exhibits approximately straight line and increases with the increase of strain and decrease of pre-set deformation temperature, as can be seen in Fig. 7. The traditionally calculated temperature rises are higher than that of optimized ones since in the traditional method, the temperature rise was calculated assuming φ = 0.05. According to Eq. (20), the term (η) is equal to the typical value of 1 (Fig. 3); however, the mechanical work partitioning factor is larger than 0.05 [Fig. 4(d)]. Thus, the fraction of mechanical work transformed to temperature rise is higher with the traditional method. Accordingly, microstructure evolution is an important part during the study of temperature rise of the 6063 aluminum alloy.
A comparison of calculated temperature rise under a strain rate of 10 s−1 and pre-set deformation temperatures of (a) 573 K, (b) 623 K, (c) 673 K, (d) 723 K, and (e) 773 K.

F. Influence of temperature rise on the flow stress
Under different stain rates and deformation temperatures, the isothermal stresses (σc) can be expressed asReference Castellanos, Rieiro, Carsí, Muñoz, Mehtedi and Ruano34
 $${\sigma ^{\rm{c}}}\left( {\varepsilon ,\dot{\varepsilon },{T_0}} \right) \approx {\sigma ^{\rm{u}}}\left( {\varepsilon ,\dot{\varepsilon },{T_0}} \right) - {\sigma ^{{\rm{c'}}}}\left( {\varepsilon ,\dot{\varepsilon },{T_0}} \right) \cdot \left( {{T_i} - {T_0}} \right)\quad ,$$
where σu is the measured stress and σc is the corrected flow stress.  ${\sigma ^{{\rm{c'}}}}\left( {\varepsilon ,\dot{\varepsilon },{T_0}} \right)$ is the slope of the σc − T curve at the point T 0 and denotes the flow softening due to temperature rise.
According to Eq. (26), the σc − T i data could be obtained from the σu − T 0 data under a given strain rate and strain level for different pre-set temperatures. Then, the isothermal flow stresses under different pre-set test temperatures, strain rates, and strain levels can be determined according to Eq. (26).Reference Zhang, Di, Wang, Cao, Zhang and Ma2
Figure 1 showed the true stress–strain curves corrected and uncorrected under different strain rates and pre-set temperatures. It is obvious that the differences between the corrected and uncorrected curves are more significant at lower temperatures and higher strain levels. At 573 K and 10 s−1, the difference between the corrected and uncorrected stress is about 40 MPa at a strain level of 0.9. This can be attributed to the higher stresses under lower temperatures and higher strain rates (as shown in Fig. 1), namely more mechanical work transformed to temperature heating. Meanwhile, increasing strain rate results in less time for power dissipating, contributing to greater thermal softening during the compression.
V. EXTRUSION SIMULATION AND ITS EXPERIMENTAL VERIFICATION
In this section, the numerical model was established using the corrected true stress–strain curves with Deform-3D software (Science Forming Technology Corporation, Columbus, Ohio). Then, the extrusion process for producing a square 6063 aluminum hollow profile was simulated. To validate the optimized equation considering the combined impacts of heat-transfer, microstructure evolution and the material constants into temperature rises, the corresponding extrusion experiment was carried out to give comparison.
A square hollow tube with an outer length of 40 mm and a wall thickness of 2.5 mm was used in simulation and experiment. The homogenized 6063 aluminum billets were homogenized following the same route as the material used for hot compression test and cut with a diameter 86 mm and a height of 300 mm for extrusion. The extrusion ratio was 16.9. The extrusion experiment was carried out on the 800 tons extruder with the ram speed of 3, 7, 9, and 11 mm/s, respectively. The biller and die temperatures were 480 and 450 °C. Since all of these components are symmetrical, only 1/8 of them were used for simulation to reduce the total computational time. By doing such simplification, much finer meshes could be generated on the billet, which enhances the accuracy of the simulation. Except this simplification, the extrusion tools and the process parameters were as same as the experiment.
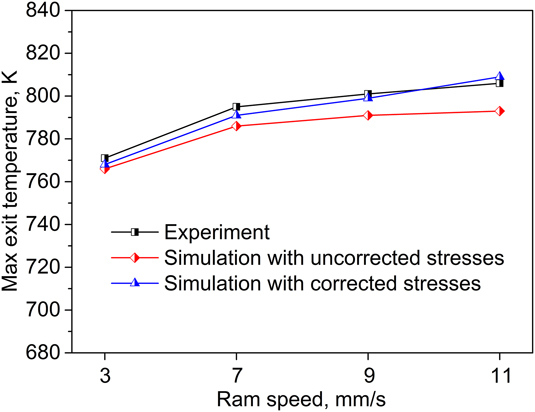
In Fig. 8, the maximum exit temperatures simulated with corrected stresses are in accordance with the experimental data, which verified the optimized equation and above numerical results. The results show that the difference between experimental temperature and simulation temperatures using the uncorrected stresses increases with the increase of ram speed. That is due to more pronounced temperature rise at higher strain rate. The maximum exit temperature increases with the increase ram speed. The maximum temperature increase is approximately 35 K.
Maximum simulated and experimental exit temperatures at different ram speeds.

VI. CONCLUSIONS
The hot deformation behaviors of the 6063 aluminum alloy were investigated by means of hot compression tests over a wide range of strain rates and temperatures. Temperature rise and flow stress were corrected at medium strain rates. The major findings are as follows:
(1) The adiabatic correction factor (η) was a function of temperature, strain rate, strain, the heat transfer coefficients at the interfaces, the thermal properties, and emissivity of the workpiece at medium strain rates of 0.01–1 s−1. While its value is 1 at a high strain rate of 10 s−1.
(2) The mechanical work partitioning factor (φ) was sensitive to the strain, deformation temperature, and strain rate. At the temperature of 623 K and strain rate of 10 s−1, φ is about 2.8%. While its value increases to 26.8% at a deformation temperature of 773 K and a strain rate of 0.01 s−1.
(3) Microstructural evolution in the deformation process had a significant effect on the mechanical work partitioning factor, especially DRX.
(4) Analytical expression for temperature rise was quantitatively developed on the basis of the η and φ at medium strain rates. The temperature rises were obvious during hot compression and its effect on flow stresses was not negligible. The maximum temperature rise was 44 K and the corresponding flow stress decrease was 45 MPa at a temperature of 573 K and a strain rate of 10 s−1.
(5) Good agreement between the simulated and experimental results indicates the reliability of the temperature compensation.
ACKNOWLEDGMENT
The authors are very grateful to financial support from the National Natural Science Foundation of China (Grant Nos. U1664252 and 51475156).