INTRODUCTION
The 75-ka eruption of Toba caldera, Indonesia (Mark et al., Reference Mark, Petraglia, Smith, Morgan, Barfod, Ellis, Pearce, Pal and Korisettar2014) is the largest volcanic eruption documented in the past 2 million years. Approximately 2800 km3 of rhyolitic magma (dense rock equivalent, DRE) was erupted during this event, termed the Younger Toba Tuff (YTT), from an enormous vent on the island of Sumatra, resulting in a minimum ashfall of 800 km3 (Chesner et al., Reference Chesner, Rose, Deino, Drake and Westgate1991; Costa et al., Reference Costa, Smith, Macedonio and Matthews2014). Distal YTT ash is widespread and found in marine cores from the Indian Ocean and the Arabian Sea (Schulz et al., Reference Schulz, von Rad and Erlenkeuser1998, Reference Schulz, Emeis, Erlenkeuser, von Rad and Rolf2002; Pattan et al., Reference Pattan, Shane and Banakar1999, Reference Pattan, Shane, Pearce, Banakar and Parthiban2001, Reference Pattan, Pearce, Banakar and Parthiban2002), forms thick terrestrial deposits across South Asia (e.g., Williams and Royce Reference Williams and Royce1982; Acharyya and Basu Reference Acharyya and Basu1993; Jones Reference Jones, Petraglia and Allchin2007; Blinkhorn et al., Reference Blinkhorn, Smith, Achyuthan, Shipton, Jones, Ditch and Petraglia2014; Singh et al., Reference Singh, Srivastava and Chauhan2022), as well as appearing as cryptotephra in lake cores (e.g., Lane et al., Reference Lane, Chorn and Johnson2013), flowstone records (see Ge and Gao, Reference Ge and Gao2020), and archaeological sites (Smith et al., Reference Smith, Jacobs, Johnsen, Ren, Fisher, Oestmo and Wilkins2018) thousands of kilometers from the vent. The scale of this eruption has fueled debate regarding its effect on global climate, terrestrial ecosystems, and hominin populations (Rampino and Self, Reference Rampino and Self1993; Ambrose, Reference Ambrose1998; Oppenheimer, Reference Oppenheimer2002; Petraglia et al., Reference Petraglia, Korisettar, Boivin, Clarkson, Ditchfield, Jones and Koshy2007; Williams et al., Reference Williams, Ambrose, van der Kaars, Ruehlemann, Chattopadhyaya, Pal and Chauhan2009). Recent modeling studies have suggested uneven climatic effects of the eruption, suggesting severe temperature anomalies at higher latitudes contrasting with muted effects on precipitation at lower latitudes and in the southern hemisphere (Black et al., Reference Black, Lamarque, Marsh, Schmidt and Bardeen2021), which broadly correspond to evidence from fossil and archaeological records for minimal effects on faunal and human populations (Schulz et al., Reference Schulz, Emeis, Erlenkeuser, von Rad and Rolf2002; Petraglia et al., Reference Petraglia, Korisettar, Boivin, Clarkson, Ditchfield, Jones and Koshy2007; Louys, Reference Louys2012; Clarkson et al., Reference Clarkson, Harris, Li, Neudorf, Roberts, Lane and Norman2020). Nevertheless, the airfall event from the eruption of Toba resulted in a blanket of ~4–5 cm of YTT deposited in South Asia (Matthews et al., Reference Matthews, Smith, Costa, Durant, Pyle and Pearce2012), with the potential to cause both short- and long-term effects on the region's geomorphology, with significant variability at a landscape scale that may have ensuing effects on human populations.
Volcanic ash associated with the YTT was first reported in India in the Son Valley (Williams and Royce, Reference Williams and Royce1982) and ash layers subsequently have been identified across multiple river valleys across peninsular India (Williams and Royce Reference Williams and Royce1982; Acharyya and Basu, Reference Acharyya and Basu1993; Jones, Reference Jones, Petraglia and Allchin2007; Blinkhorn et al., Reference Blinkhorn, Smith, Achyuthan, Shipton, Jones, Ditch and Petraglia2014). Recent studies have employed biotite analyses as the most secure means to resolve between alternate Toba tuffs (Smith et al., Reference Smith, Pearce, Matthews, Westgate, Petraglia, Haslam, Lane, Korisettar and Pal2011). Primary ashfall tephras ~4–5 cm thick have been identified in both the Son and Jurreru valleys, where continuous, uniformly bedded deposits dominated by volcanic glass shards and lacking detrital (non-volcanic) inputs are present (Matthews et al., Reference Matthews, Smith, Costa, Durant, Pyle and Pearce2012). More typically, YTT horizons appear as thicker beds up to 5 m thick, which indicate widespread mobilization and concentration of ash across the landscape in topographic low points (e.g., Blinkhorn et al., Reference Blinkhorn, Parker, Ditchfield, Haslam and Petraglia2012). In some circumstances, reworked YTT horizons may be disconnected from primary ashfall deposits (Gatti et al., Reference Gatti, Durant, Gibbard and Oppenheimer2011; Neudorf et al., Reference Neudorf, Roberts and Jacobs2014), making their use as an isochron problematic in the absence of geomorphological and chronological controls.
Models for the effects of the eruption of Toba on environments and human populations have often relied on YTT to provide a robust isochron (Williams et al., Reference Williams, Ambrose, van der Kaars, Ruehlemann, Chattopadhyaya, Pal and Chauhan2009). Establishing the depositional and chronological contexts of YTT deposits is critical for its use as an essential benchmark horizon. This is true regardless of whether it is thought that the eruption of Toba at 75 ka had catastrophic consequences (e.g., Rampino and Self, Reference Rampino and Self1992; Ambrose, Reference Ambrose1998), and immediate changes in environmental and archaeological evidence are anticipated, or whether the effects of the eruption on human populations have been overstated, without causing any break in cultural transmission or population continuity (e.g., Petraglia et al., Reference Petraglia, Korisettar, Boivin, Clarkson, Ditchfield, Jones and Koshy2007; Smith et al., Reference Smith, Jacobs, Johnsen, Ren, Fisher, Oestmo and Wilkins2018; Clarkson et al., Reference Clarkson, Harris, Li, Neudorf, Roberts, Lane and Norman2020). Notably, these alternatives of sharp rapid changes or continuity and gradual changes in archaeological records before and after the eruption of Toba broadly correspond with competing models for human expansions into South Asia (Mellars et al., Reference Mellars, Gori, Carr, Soares and Richards2013; Mishra et al., Reference Mishra, Chauhan and Singhvi2013; Groucutt et al., Reference Groucutt, Petraglia, Bailey, Scerri, Parton, Clark-Balzan and Jennings2015; Blinkhorn and Petraglia, Reference Blinkhorn and Petraglia2017).
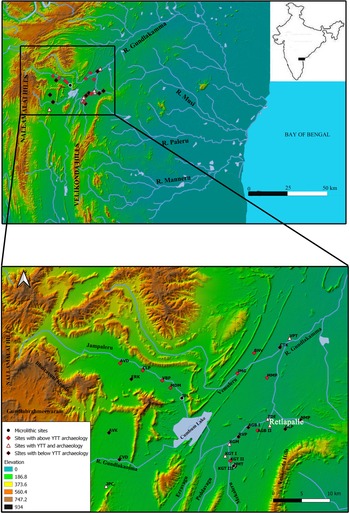
Here we examine the site of Retlapalle, Andhra Pradesh, India (Fig. 1), incorporating evidence from sedimentological, geochemical, and geochronological analyses of an excavated sequence. These data are considered with the archaeological evidence to understand hominin behavioral adaptations both at the site and in the broader landscape. This is undertaken to evaluate patterns of behavioral changes spanning the eruption of Toba and illuminate the significance of employing direct geochronological dating on post-Toba deposits to constrain processes of sediment reworking and cultural evolution.
Map showing study region and location of the Retlapalle site. AVK = Araveetikota; AVD = Ardhaveedu; AGB I = Aurangabad I; AGB II = Aurangabad II; BNV = Birudalanarava; CLP = Chimaletipalle; CTK = Chintakunta; CVD = Cholaveedu; ERK = Erronka; GLP = Gollapalle; HMT = Hanuman Temple; JPC = J P Cheruvu; JPL = Jampaleru; JMG = Jangamguntla; KGM = Kagitalagudem; KGT I = Kalagotla I; KGT II = Kalagotla II; KGT III = Kalagotla III; MDM = Maddalamadaka; MMP = Mittamidapalle; NMP = Nagellamudupu; RVP = Ravipadu; TDE = Telladinne; VBP = Veerbhadrapuram; VPT = Vemulapeta.

THE GUNDLAKAMMA RIVER AND RETLAPALLE STUDY SITE
The Gundlakamma River originates in the Nallamalai Hills ranges, flowing eastward and forming two large lakes at Cumbum and Markapur before altering its course between northeast and southeast before draining into the Bay of Bengal (Fig. 1). The Gundlakamma River has a very narrow flood plain; therefore, the accumulation of Quaternary sediments is also limited. However, three distinct terraces (T1–T3) are delineated, of which T1 and T2 have a regional presence, whereas the T3 terrace has developed locally (Reddy and Shah, Reference Reddy and Shah2004). The basal terrace T1 is flat, narrow, and comprises sand and gravel; T2 is made of gravel, sand, silt, and volcanic ash. The volcanic ash is observed within the T2 terrace and sandwiched between floodplain sediments. The T3 terrace is mostly carved out of pediment, but it also comprises sand and silt in places.
Recent Quaternary geological studies, which were based on geochemical studies done through the XRF method (Reddy and Shah Reference Reddy and Shah2004), identified the presence of volcanic ash concentrated in the upper and middle reaches of the river and attributed it to YTT. Deposits of YTT also have been reported from adjacent river systems, including the Jurreru (Raman and Murty, Reference Raman and Murty1997; Petraglia et al., Reference Petraglia, Korisettar, Boivin, Clarkson, Ditchfield, Jones and Koshy2007) and the Sagileru (Basu and Biswas, Reference Basu and Biswas1990; Blinkhorn et al., Reference Blinkhorn, Smith, Achyuthan, Shipton, Jones, Ditch and Petraglia2014; Geethanjali et al., Reference Geethanjali, Achyuthan and Jaiswal2019). Archaeological surveys of the Gundlakamma valley were first undertaken in the 1950s, indicating the presence of a broad range of Paleolithic activity within the landscape (Issac, Reference Issac1960). Lower Paleolithic (Acheulean) and Middle Paleolithic occurrences are reported as widespread in the Gundlakamma valley, alongside the reported presence of an Upper (Late) Paleolithic site at Yerragondapalem (Kumari, Reference Kumari1987).
Recent surveys have identified six additional sites with volcanic ash horizons and 20 new Paleolithic sites in the upper Gundlakamma valley, including identification of the site of Retlapalle (15.59°N, 79.19°E) on the bank of a minor tributary named the Erravagu, which includes both an ash horizon and an artefact-bearing horizon (Anil et al., Reference Anil, Ajithprasad, Vrushab, Tiwari, Singh and Mehra2020). Where ash beds are present, they have a maximum thickness of 50 cm and appear as laterally discontinuous horizons, disrupted by post-depositional erosion (Anil et al., Reference Anil, Ajithprasad, Vrushab, Tiwari, Singh and Mehra2020). Preliminary analyses of stone tool assemblages indicate the widespread presence of Middle Paleolithic technologies that are closely comparable to the Middle Paleolithic assemblages known from the nearby Jurreru Valley (Anil et al., Reference Anil, Ajithprasad, Mahesh and Jha2019). To place these archaeological results within a chronostratigraphic framework with a demonstrable relationship to YTT, we conducted excavations at Retlapalle, where survey results indicated the presence of ash deposits and Middle Paleolithic artefacts.
METHODS
A 1-m-wide stepped trench was excavated into a cliff section cut by the Erravagu stream (Fig. 4), excavating in 10-cm arbitrary units within discrete sediment units and sieving sediments through 5 mm mesh to control artefact recovery. Sediment samples were recovered at regular intervals throughout the sequence to enable laboratory descriptions. Analysis of the lithic artefacts employed standard terminologies frequently used across South Asia (e.g., Petraglia et al., Reference Petraglia, Korisettar, Boivin, Clarkson, Ditchfield, Jones and Koshy2007; Haslam et al., Reference Haslam, Clarkson, Roberts, Bora, Korisettar, Ditchfield and Chivas2012; Blinkhorn et al., Reference Blinkhorn, Achyuthan, Petraglia and Ditchfield2013; Clarkson et al., Reference Clarkson, Harris, Li, Neudorf, Roberts, Lane and Norman2020).
Laser particle size and loss on ignition analyses were conducted at the Quaternary Research Centre, Department of Geography, Royal Holloway, University of London, Egham, U.K. To prepare for particle size analysis, sediment samples were first disaggregated in weak hydrochloric acid (0.5 M HCl) to remove post-depositional carbonate cementation, then bathed in 4.4% sodium hexametaphosphate ([NaPO3]6) solution for 24 hours to disperse fine particles, and agitated in an ultrasonic bath prior to rinsing in purified water and analysis in a Malvern Mastersizer 3000 (results summarized in Supplementary Table 1). For loss on ignition studies, sediment samples (~10 g) were weighed to three decimal places (i.e., 0.001g) and heated in a muffle furnace to 105°C, 400°C, 480°C, and 950°C (allowing the sediments to cool to 105°C for weighing between steps) to calculate the proportions of water, carbohydrate, total organic matter, carbonates, and mineral residue (results summarized in Supplementary Table 2).
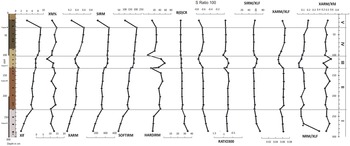
Mineral magnetic analyses were conducted in the Magnetic Laboratory, Department of Geology, Savitribai Phule University, Pune, India. The samples were homogenized using agate mortar and pestle. An average of 9 g of samples was tightly packed into pre-weighed 8 cm3 cylindrical non-magnetic plastic bottles for magnetic measurements. The weights of the samples were used to calculate the magnetic parameters on a mass-specific basis. Magnetic susceptibility was measured using a Bartington Magnetic Susceptibility Meter with Dual Frequency Sensor. The sensor was calibrated using the standard given by the manufacturer. The measurements were carried out in the 0.1 range with the S.I. unit of 10-8m3/Kg. Magnetic susceptibility was measured at low frequency at 0.4 kHz (Xlf) and high frequency at 4 kHz (Xhf). The frequency-dependent susceptibility (Xfd) was calculated from Xlf and Xhf values. Anhysteretic remanent magnetization (ARM) was grown in the samples in a frequency alternating field of 100 mT, while the samples were subjected to a steady field of 0.05 mT. The calibration sample provided by the manufacturer was used to calibrate the magnetometer. An A.F. demagnetizer and an ARM attachment (both of Molspin make) were used. The ARM grew after demagnetizing was measured using a Molspin spinner magnetometer. The susceptibility of ARM was converted into a mass-specific ARM (XARM) by dividing it by mass. Natural remanent magnetization (NRM) was measured using the Molspin impulse magnetizer by calibrating with the sample provided by the manufacturer. Isothermal remanent magnetization (IRM) was grown in steps at different field strengths (25, 50, 100, 200, 300, 400, 500, 700, 800, 1000 for forward and −10, −20, −30, −40, −50, −70, −100, −300 for backfield) using a Molspin impulse magnetizer. The isothermal remanence grew in a 1 T field considered to represent saturation isothermal remanent magnetization (SIRM). All remanence measurements were made using the Molspin Impulse magnetizer. Parametric ratios such as SOFTIRM, HARDIRM, B(0) C.R., S-RATIO-100, S-RATIO300, SIRM/XLF, XARM/XLF, NRM/XLF, and XARM/Xfd% were calculated to determine the mineralogy and grain size of the magnetic minerals (rock magnetic parameters and inter-parametric ratios for sediment samples from the Retlapalle step trench are summarized in Supplementary Table 3).
Ash samples were collected and analyzed at the Research Laboratory for Archaeology and the History of Art, University of Oxford. Glass and biotite crystals from the tephra layers were characterized using the same methods as those used in Blinkhorn et al. (Reference Blinkhorn, Smith, Achyuthan, Shipton, Jones, Ditch and Petraglia2014).
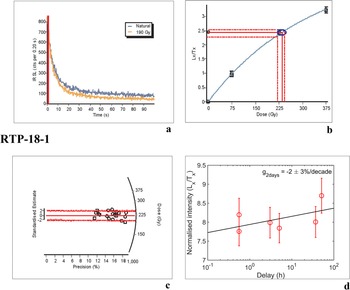
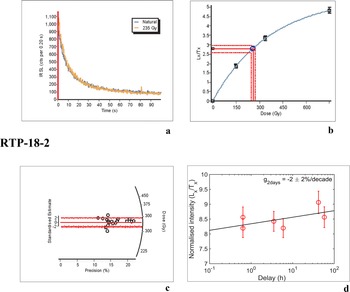
Sediment samples were analyzed for luminescence ages in the Physical Research Laboratory, Ahmedabad, India using the procedures discussed in Anil et al. (Reference Anil, Chauhan, Ajithprasad, Devi, Mahesh and Khan2022). We measured 20 aliquots per sample using multigrain pIR-IRSL on single grain disc (Buylaert et al., Reference Buylaert, Murray, Thomsen and Jain2009). Preheat test was conducted on the natural sample, with an arithmetic mean of 3 aliquots used for each preheat. The doses for 260°C, 290°C, and 320°C fell within 5% of the estimated paleo-dose and 320°C was used as pre-heat temperature. The overdispersion (O.D.) in estimated De values was relatively low (~8%; Figs. 2c, 3c), indicating thorough bleaching of sediment before burial. Thus, for De estimation, the central age model (CAM) was used. Typical feldspar shine-down growth curves are shown for the Layer B (Fig. 2a, b) and Layer D (Fig. 3a, b) samples, respectively. A residual dose of 10.2 ± 0.5 Gy, which is the value of the dose remaining in the sample after five-hour extended solar lamp bleaching, was subtracted. The dose reproducibility of the used pIR-IRSL-SAR protocol was tested using the dose recovery test (ratio of recovered to given dose <10% of unity). For the dose recovery test, a known dose of 237 ± 2 Gy was given in the reader after the solar lamp beaching. The given dose was immediately recovered as an unknown dose. The recovered doses were further corrected for residual doses. The observed dose recovery ratio was 1.09 ± 0.06, indicating that the used pIR-IRSL-SAR protocol has good dose reproducibility. The fading rate measurements were done using the procedure of Huntley and Lamothe (Reference Huntley and Lamothe2001) and Auclair et al. (Reference Auclair, Lamothe and Huot2003). The estimated g-values are either <1% or negative with ~100% errors (Figs. 2d, 3d), suggesting the pIR-IRSL signal is not affected by the anomalous fading (Buylaert et al., Reference Buylaert, Thiel, Murray, Vandenberghe, Yi and Lu2011). Therefore, no fading corrections were applied to the samples to correct the ages. The concentration of Uranium (U) and Thorium (Th) nuclides were measured using ZnS (Ag) thick source alpha counter. Potassium (K) concentration was measured using NaI (Th) gamma counter. In addition, these concentrations were used to estimate the total dose rate assuming infinite matrix assumption, and secular equilibrium for all the nuclides (Table 1) (Beck and de Planque, Reference Beck and de Planque1985). An internal potassium (40K) of 12.5 ± 0.5% (Huntley and Baril, Reference Huntley and Baril1997) and 400 ± 100 ppm Rubidium (87Rb) (Huntley and Hancock, Reference Huntley and Hancock2001) were considered for dose rate estimations.
Results of pIR-IRSL analyses of sample from Layer B. (a) Typical feldspar shine down curve; (b) typical dose response curve; (c) radial plot representing the estimated paleodoses; (d) typical g-value data. The dotted red lines are the 2σ lines that represent 95% of the data distribution. The red dotted line and blue circle in (b) represents the uncertainty in the dose of a typical aliquot. RTP-18-1 represents the laboratory code for the sediment sample from Layer B (see Table 1).

Results of pIR-IRSL analyses of sample from Layer D. (a) typical feldspar shine down curve; (b) typical dose response curve; (c) radial plot representing the estimated paleodoses; (d) typical g-value data. The dotted red lines in (c) and (d) are the 2σ lines that represent 95% of the data distribution. The red dotted line and blue circle in (b) represents the uncertainty in the dose of a typical aliquot. RTP-18-2 represents the laboratory code for the sediment sample from Layer D (see Table 1).

Dose rate data, De values, and OSL ages for the sediment samples from the step trench at Retlapalle.

aRadioactivity measurement was made on the dried, homogenized and powered sample by gamma-ray spectrometry and alpha counting.
bIncludes cosmic-ray dose rate.
c12.5 ± 0.5% and 200 ± 20 ppm Rubidium (87Rb) concentrations were used to estimate the internal dose rate.
dafter subtracting a residual dose of 10.2 Gy.
RESULTS
Stratigraphy and Geoarchaeology
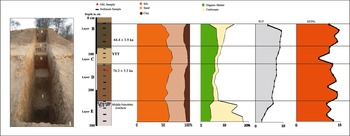
Five discrete sediment units are identified in the exposures by the Erravagu stream and are directly comparable to the horizons reported by Anil et al. (Reference Anil, Ajithprasad, Vrushab, Tiwari, Singh and Mehra2020). Layer A, with a distinct high mineral magnetic signal from underlying deposits, comprises reddish sandy silt that was limited in presence in the excavated sequence but widely evident across the present landscape as a 1.5-m-thick deposit (Fig. 4). Layer B is a mid-brown organic-rich (3.6–7%), fine sandy silt with trimodal size distribution and mean particle size ranging from 54–130 μm, displaying a gradual decrease in ferromagnetic concentration with depth from the surface, and exhibiting a sharp basal contact with Layer C. Layer C comprises, a 42-cm-thick reworked volcanic ash horizon, typically characterized as a unimodal very fine sandy coarse silt (mean particle size ranges from 50.2–72.8 μm), rich in organic matter (5.9–7.3%), but with low levels of carbonate present (<1.5%). The S-ratio in Layer C depicts a relatively larger domain towards multi domain (MD) ferrimagnets, in agreement with lowering Xfd, XARM, and higher HardIRM, with large fluctuations in mineralogy and ferromagnetic concentration (Fig. 5). A more diffuse contact is observed between Layers C and D. Layer D comprises a reddish-brown trimodal fine sandy medium silt (mean particle size ranges from 52.2–70.1 μm), with low levels of carbonates (<2.02%) present, decreased organic components compared to overlying levels (4.7–5.6%), but a comparable and continued gradual decrease in ferromagnetic concentration from Unit B. The basal deposit in the sequence, Layer E, is a pale reddish brown trimodal very fine sandy medium silt, notable for the high proportion of carbonate present (8.9–14%), but with a lower organic component (3.7–4.3%) compared with overlying levels. A minor peak in ferromagnetic concentration is associated with the upper contact of this unit, but otherwise continues a gradual downward decrease. Most of the samples from the Retlapalle section are polymodal silts, suggesting relatively low-energy fluvial depositional settings (Fig. 4), which is ideal for the recovery of high-integrity archaeological assemblages that are unlikely to have experienced significant artefact mobility. The presence of tephra clearly changes the size distributions because the system is swamped with lots of material of the same size; however, the tephra samples were all fluvially reworked.
OSL chronology, sedimentological analyses, and lithology of the step trench at Retlapalle. Black diamond symbols on the XLF and XFD% curves denote the positions of the sediment samples. YTT = Youngest Toba Tuff.

Rock magnetic parameters and inter parametric ratios for sediment samples from Retlapalle step trench. NRM = natural remanent magnetization; SIRM = saturation isothermal remanent magnetization; Xlf = magnetic susceptibility at low frequency; Xfd = frequency-dependent susceptibility; XARM = mass-specific anhysteretic remanent magnetization; YTT = Youngest Toba Tuff. Roman numerals on the far right represent the distinct sedimentary zones observed based on the mineral magnetic studies. See Figure 4 for lithology key.

Geochemical fingerprinting
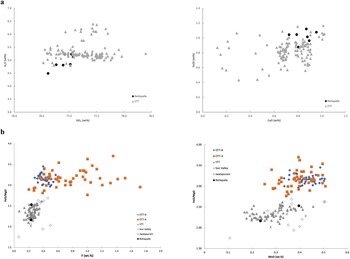
Glass shards from the Retlapalle have 70.77–73.23 wt% SiO2, 4.15–4.93 wt% K2O, 2.83–3.46 wt% Na2O, 0.67–0.90 wt% CaO, and 0.83–1.05 wt% FeOT (all Fe present as FeO). These glass shards are similar to tephra shards preserved in the Jurreru Valley, Son Valley, Lenggong, and the YTT proximal samples (Fig. 6a). Biotite occurs as tiny (up to 50 μm) thin sheets of the mica in the Retlapalle distal tephra. The compositional range of biotite crystals in Retlapalle distal tephra is 20.74–23.00 wt% FeOT, 9.08–9.58 wt% MgO, and 0.23–0.24 wt% F. These are similar to the biotite compositions of the distal YTT units in Malaysia and India (Son Valley, Jurreru Valley; Smith et al., Reference Smith, Pearce, Matthews, Westgate, Petraglia, Haslam, Lane, Korisettar and Pal2011) (Fig. 6b) (raw data for the major elemental compositions of glass and biotite in the samples are provided in Supplementary Table 4). Unlike the glass compositions, the biotite compositions of the YTT are distinct from those samples of the older, large eruptions from Toba (Older Toba Tuff and Middle Toba Tuff). Therefore, the similar composition of the biotite from the Retlapalle tephra (and others in India) to the YTT confirms that the deposit is associated with this last major eruptive event of Toba.
(a) Glass shard compositions (normalized to 100%) from Retlapalle tephra (black triangle) compared with published proximal YTT data (gray triangles; from Smith et al., Reference Smith, Pearce, Matthews, Westgate, Petraglia, Haslam, Lane, Korisettar and Pal2011). (b) Biotite composition of crystals from the deposits at Retlapalle compared with those from the tephra in the Son and Jurerru valleys and proximal samples of Older Toba Tuff (OTT-A and OTT-B; ca. 790 ka) and YTT (data from Smith et al., Reference Smith, Pearce, Matthews, Westgate, Petraglia, Haslam, Lane, Korisettar and Pal2011; Mark et al., Reference Mark, Renne, Dymock, Smith, Simon, Morgan, Staff, Ellis and Pearce2017).

Luminescence chronology
Sediment samples from layers B and D from the Retlapalle step trench were dated using the post-infrared infrared-stimulated luminescence (p-IR-IRSL) method. The age of layer B above YTT is 64.4 ± 3.9 ka, and the age for the sample from layer D underlying the YTT is 76.3 ± 5.5 ka (Table 1). The overdispersion (OD) in estimated De values was quite low (~8%; Table 1), indicating thorough bleaching of sediment before burial. Thus, the central age model (CAM) was used for De estimation.
Lithic technology
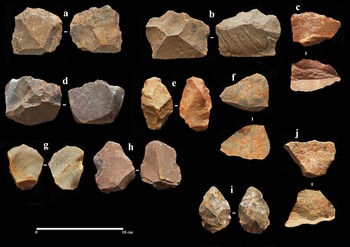
Our excavations at Retlapalle recovered an assemblage of 102 lithic artefacts from Layer E. All of the artefacts were made of coarse- to fine-grained quartzite. The assemblage consists of one diminutive biface, retouched points, and informally retouched flakes (Fig. 7). Due to the small sample size and absence of characteristic artefact types, it is difficult to assign cultural affiliation to these artefacts recovered from the trench. However, systematic surface collections carried out close to the trench that are eroding out from Layer E deposits consist of products of prepared core technology, including Levallois and blade technology, which are most consistent with the Middle Paleolithic. Although Layer E deposits were not directly dated, a minimum age is provided for these artefacts by the late MIS 5 date from Layer D. A marked increase in the presence of carbonates is observed between Layers D and E, suggesting notable differences in post-depositional conditions between these units that may be attributable to either decreased precipitation or enhanced seasonality. It is therefore likely that Layer E significantly predates Layer D, and we suggest a late Middle Pleistocene age.
Representative lithic artefacts from Layer E at the Retlapalle step trench. (a, d) Cores; (b, c, f–h, j) flakes; (e) retouched piece; (i) diminutive handaxe.

No artefacts were recovered from Layers B or D during our excavations. Direct dating of Layers B and D to 64.4 ± 3.9 ka and 76.3 ± 5.5 ka, respectively, provides vital means to interpret patterns of behavioral variability from artefact assemblages derived from these units found elsewhere in the landscape, which are discussed below.
DISCUSSION
The current study confirms the attribution of volcanic ash deposits in the Gundlakamma basin as YTT through direct geochemical fingerprinting of glass-shard and biotite composition. We constrain the deposition and mobility of this tephra within low-energy, soft-sediment contexts to ca. 10,000 years following the eruption of Toba. Evidence of hominin occupation at the excavated site is restricted to Layer E, which is currently undated but constrained to >76 ka. However, by constraining the chronology of depositional units that precede and succeed deposition of YTT across the landscape (Anil et al., Reference Anil, Ajithprasad, Vrushab, Tiwari, Singh and Mehra2020), we can ascribe archaeological assemblages found elsewhere from Units D and B to timeframes of 76.3 ± 5.5 ka and 64.4 ± 3.9 ka, respectively. This enables our discussion of the effect of the eruption of Toba and deposition of YTT in the Gundlakamma basin.
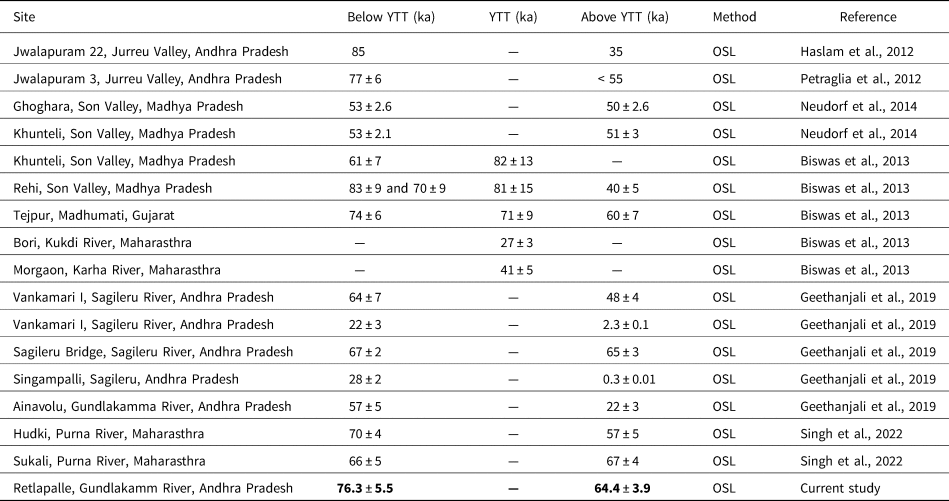
The YTT horizon we report is ~10 times thicker than primary ashfall deposits identified from marine cores (Schulz et al., Reference Schulz, von Rad and Erlenkeuser1998, 2002) as well as through direct study of terrestrial sequences (Matthews et al., Reference Matthews, Smith, Costa, Durant, Pyle and Pearce2012), clearly indicating the reworking of this ash within the landscape. Our study of mineral magnetics indicates that this redeposited tephra is anomalous within the sediment sequence, which otherwise demonstrates considerable continuity with gradual and consistent changes in ferromagnetic concentrations bracketing the influx of YTT. Here, the YTT deposits appear as a discrete entity within the basin sediments, become stabilized within the valley in a comparatively short time frame (ca. 10 ka), and do not appear to have undergone multiple phases of redeposition as may have happened elsewhere (e.g., Son Valley: Neudorf et al., Reference Neudorf, Roberts and Jacobs2014; Sagileru Valley: Geethanjali et al., Reference Geethanjali, Achyuthan and Jaiswal2019). Rapid stabilization of this depositional landscape following the influx of YTT provides an important context within which to examine environmental and behavioral changes across the eruption of Toba, which are harder to achieve in contexts where multiple or lengthy episodes of reworking of YTT deposits are evident. More broadly, our study emphasizes the importance of undertaking geomorphological and chronological assessments at a local scale to establish the utility of YTT as a discrete sedimentological and chronological marker and, in this case, to establish the timeframe in which post-Toba landscapes stabilized. Among the available chronometric ages that bracket the final deposition of the YTT deposits in South Asia, the ages reported in the current study from Retlapalle are closer to the time of Toba eruption at 75 ka (Table 2). Further research is required at Retlapalle and the Gundlakamma basin to clearly demonstrate the presence of a primary ashfall deposit, which provides the most secure isochron (following Matthews et al., Reference Matthews, Smith, Costa, Durant, Pyle and Pearce2012).
Sites with luminescence ages bracketing the YTT deposits in South Asia.

Rapid stabilization of low-energy, soft-sediment deposits observed at Retlapalle following the eruption of Toba is particularly fortuitous for examining its effect on human behavioral change. The identification of Middle Paleolithic assemblages from Layer E deposits suggests longstanding habitation of the Gundlakamma basin, which could significantly predate the eruption of Toba and potentially extend into the Middle Pleistocene based on comparable discoveries in Andhra Pradesh, which share comparable technologies (Anil et al., Reference Anil, Chauhan, Ajithprasad, Devi, Mahesh and Khan2022). Previous research in the landscape records several sites yielding Middle Paleolithic artefacts across the upper reaches of the Gundlakamma River basin associated with both Layers B and D (Anil et al., Reference Anil, Ajithprasad, Vrushab, Tiwari, Singh and Mehra2020). Lithic artefacts were identified at Kalagotla, Kagitalagudem, and Telladinne within deposits directly comparable to Layer D sediments that we identified at Retlapalle, directly underlying the YTT horizon, and now attributable to the latter stages of MIS 5 (ca. 76.3 ± 5.5 ka). These stone tool assemblages include the presence of alternate Levallois reduction methods (preferential and recurrent flake; point) alongside discoidal and other radial reduction approaches, as well as a range of expedient reduction strategies. Retouched tools attributed to these late MIS 5 deposits include diverse retouched Levallois flakes and points, diverse scrapers, notches, and borers, and the presence of tanged points. The range of technology observed in Layer D deposits, which includes the combination of alternate Levallois and discoidal reduction schemes and production of a range of retouched toolkits including tanged points, closely matches evidence from other MIS 5 dated sites across South Asia (Bundala: Deraniyagala, Reference Deraniyagala1992; Arjun 3: Corvinus, Reference Corvinus2002; Jwalapuram: Clarkson et al., Reference Clarkson, Jones and Harris2012; 16R Dune: Blinkhorn, Reference Blinkhorn, Achyuthan, Petraglia and Ditchfield2013; Katoati: Blinkhorn et al., Reference Blinkhorn, Achyuthan, Petraglia and Ditchfield2013; Mehtakheri: Mishra et al., Reference Mishra, Chauhan and Singhvi2013; Karna; Blinkhorn, Reference Blinkhorn2014; Sandhav: Blinkhorn et al., Reference Blinkhorn, Ajithprasad, Mukherjee, Kumar, Durcan and Roberts2019; Middle Son Valley: Clarkson et al., Reference Clarkson, Harris, Li, Neudorf, Roberts, Lane and Norman2020).
At JP Cheruvu and Vemulapeta, within the Gundlakamma River basin, lithic artefacts were recovered in sediments directly comparable to Layer B and overlying YTT deposits (Anil et al., Reference Anil, Ajithprasad, Vrushab, Tiwari, Singh and Mehra2020) and now attributable to MIS 4 (ca. 64.4 ± 3.9 ka). Reduction strategies evident in these assemblages include preferential Levallois flake and point production, the use of radial reduction practices, as well as more prominent focus on blades evident across cores, blanks, and retouched pieces. The prominent presence of Levallois points in the blank assemblages is complemented by the appearance of tanged points among the retouched toolkit alongside the appearance of burin production. The presence of Middle Paleolithic assemblages overlying YTT horizons (Anil et al., Reference Anil, Ajithprasad, Vrushab, Tiwari, Singh and Mehra2020) is consistent with evidence observed elsewhere in Andhra Pradesh (Jurreru Valley; Clarkson et al., Reference Clarkson, Jones and Harris2012; Sagileru Valley; Blinkhorn et al., Reference Blinkhorn, Smith, Achyuthan, Shipton, Jones, Ditch and Petraglia2014) and across South Asia (Son Valley; Clarkson et al., Reference Clarkson, Harris, Li, Neudorf, Roberts, Lane and Norman2020). The range of technological variability observed in the Gundlakamma River basin in mid MIS 4 is also comparable to that seen in other Middle Paleolithic sites across South Asia dating to MIS 4 and MIS 3 (Jetpur: Baskaran et al., Reference Baskaran, Marathe, Rajaguru and Somayajulu1986; Orsang: Ajithprasad, Reference Ajithprasad2005; Bhimbetkha: Bednarik et al., Reference Bednarik, Kumar, Watchman and Roberts2005; Jwalapuram: Clarkson et al., Reference Clarkson, Jones and Harris2012; Katoati: Blinkhorn et al., Reference Blinkhorn, Achyuthan, Petraglia and Ditchfield2013; Shergarh TriJunction: Blinkhorn, Reference Blinkhorn, Smith, Achyuthan, Shipton, Jones, Ditch and Petraglia2014; Middle Son Valley: Clarkson et al., Reference Clarkson, Harris, Li, Neudorf, Roberts, Lane and Norman2020).
South Asia presents a unique context to examine the effects of the recent eruption of Toba regardless of the potential effects to regional or global climates, which appear to have had limited influence on broader patterns of cultural evolution (e.g., South African sites [Smith et al., Reference Smith, Jacobs, Johnsen, Ren, Fisher, Oestmo and Wilkins2018]). It is only in South Asia that we have evidence for clear effects that Toba had on landscapes and hominin populations, manifested in the deposition of a blanket of ash that subsequently swamped drainage networks and patterns of change in behavior in stone tool assemblages that span this timeframe. In both regional (Jurreru Valley) and more distant (Son Valley) sites, continuity in Middle Paleolithic technologies preceding and succeeding the eruption of Toba are well documented (Petraglia et al., Reference Petraglia, Korisettar, Boivin, Clarkson, Ditchfield, Jones and Koshy2007; Clarkson et al., Reference Clarkson, Jones and Harris2012, 2020). Our findings corroborate this pattern, with substantial continuity observed in lithic technologies derived from Layers D and B in the Gundlakamma basin. Moreover, the comparatively narrow chronological gap between these assemblages further refines evidence for the response of South Asian Middle Paleolithic hominins to the eruption of Toba, with Layer B assemblages from JP Cheruvu and Vemulapeta now the oldest examples of lithic technology to directly overly YTT horizons, suggesting limited disruption to regional patterns of occupation. Not only does this illustrate the enduring utility of Middle Paleolithic toolkits to engage with and adapt to substantive environmental challenges occurring at a landscape scale, but also indicates contemporaneity between the deployment of these technologies by South Asian populations and the earliest appearance of Homo sapiens in Southeast Asia (e.g., Tam Pa Ling: Demeter et al., Reference Demeter, Shackelford, Bacon, Duringer, Westaway, Sayavongkhamdy and Braga2012) and Australia (Madjebebe: Clarkson et al., Reference Clarkson, Jacobs, Marwick, Fullagar, Wallis, Smith and Roberts2017).
CONCLUSIONS
This study demonstrates a broadly continuous pattern of sedimentation with in the Gundlakamma basin during the Late Pleistocene that has seen limited disruption as a result of the YTT eruption and deposition of tephra across the landscape. Reworking of YTT appears to have ceased within 10 ky of the eruption, with a return to a pattern of sedimentation that was comparable to that preceding the eruption of Toba by ca. 64 ka. Direct dating of sediment deposits overlying and underlying the YTT horizons enables examination of trajectories of change in hominin behavior in response to changes within this landscape. This suggests a pattern of continuity that is consistent with wider regional evidence for persistence in the use of Middle Paleolithic technologies in South Asia spanning the eruption of Toba.
Acknowledgments
The authors acknowledge the Archaeological Survey of India and the Department of Archaeology & Museums, Andhra Pradesh, for granting permission to conduct field surveys in the region. This research is funded by the National Geographic Society Early Career Grant (Grant number #HJ-163ER-17) entitled “Investigating Palaeolithic sites Associated with Youngest Toba Tuff deposits, Southeast India”, awarded to Devara Anil. Devara Anil thanks Mr. Shashi Mehra, Mr. Ravindra Devra, Mr. Avinandan Mukherjee, and Mr. Ganesh for cooperating during the field surveys. We thank Mr. Pullaiah and Mr. Venkataiah, residents of Retlapalle village, for their cooperation.
Supplementary material
The supplementary material for this article can be found at https://doi.org/10.1017/qua.2023.13