I. INTRODUCTION
Gallium nitride is of technological importance for a wide variety of optoelectronic applications, such as green light emitting diodes and solid state lighting. GaN nanowires (NWs) have the potential for even higher efficiencies than planar materials because of their lower defect densities. The GaN crystal structure of interest for applications is the hexagonal wurtzite phase, which is noncentro-symmetric and has either Ga or N polarity along the c-axis (see Fig. 1). The polarity causes internal electric fields and affects the electrical and optical properties as well as the material growth. Therefore, the ability to accurately determine polarity is critical for the understanding of GaN growth and for the development of GaN NWs for applications.
Schematics of the wurtzite GaN crystal structure projected perpendicular to the [0001] direction along (a) the
 $\left[ {11\bar 20} \right]$
and (b) the
 $\left[ {1\bar 100} \right]$
zone axes. The [0001] direction is defined by convention as the direction of the Ga to N bond.

A variety of methods have been used to determine the polarity of GaN samples, including KOH etching, Reference Seelmann-Eggebert, Weyher, Obloh, Zimmermann, Rar and Porowski1,Reference Li, Sumiya, Yoshimura, Suzuki, Fukuda and Fuke2 resonant x-ray diffraction, Reference Hestroffer, Leclere, Bougerol, Renevier and Daudin3 coaxial impact collision ion scattering spectroscopy, Reference Li, Sumiya, Yoshimura, Suzuki, Fukuda and Fuke2,Reference Sumiya, Tanaka, Ohtsuka, Fuke, Ohnishi, Ohkubo, Yoshimoto, Koinuma and Kawasaki4 and Kelvin probe Reference Auzelle, Haas, Minj, Bougerol, Rouvière, Cros, Colchero and Daudin5 or piezoresponse force Reference Brubaker, Roshko, Blanchard, Harvey, Sanford and Bertness6 microscopy. A disadvantage of all these methods is that they lack nanometer scale spatial resolution, which precludes them from being able to detect polarity on small scales. In addition, while these techniques work well for bulk and planar samples, they are difficult to implement on nanowire specimens due to the nanowire size and morphology. The small dimensions of the nanowires, specifically their narrow diameters with parallel side-facets, are, however, ideally suited for transmission electron microscopy (TEM) techniques.
The primary method used to determine polarity of GaN nanowires in TEM has been convergent beam electron diffraction (CBED). Reference Hestroffer, Leclere, Bougerol, Renevier and Daudin3,Reference Furtmayr, Vielemeyer, Stutzmann, Arbiol, Estradé, Peirò, Morante and Eickhoff7–Reference Fernández-Garrido, Kong, Gotschke, Calarco, Geelhaar, Trampert and Brandt13 CBED is a well-established technique for determining the crystal symmetry, point-group, and space group of thin samples. The determination of Ga or N polarity in GaN is possible from the asymmetry in CBED patterns caused by diffraction from noncentrosymmetric planes. Reference Tafto and Spence14 CBED was first used for polarity determination in GaN on thin films. Reference Daudin, Rouviere and Arley15,Reference Ponce, Bour, Young, Saunders and Steeds16 As pointed out by Daudin et al., the determination of polarity using CBED is not straightforward. Reference Daudin, Rouviere and Arley15 It relies on a comparison of experimental and calculated CBED patterns as a function of sample thickness, and a critical step to ensure accuracy is measurement of the diffraction pattern rotation relative to the image. Reference De Graef17,Reference Williams and Carter18
The development of aberration corrected scanning transmission electron microscopes has enabled a direct imaging technique using scanning transmission electron microscopy (STEM) for determining GaN polarity. Reference de la Mata, Magen, Gazquez, Utama, Heiss, Lopatin, Furtmayr, Fernández-Rojas, Peng, Morante, Rurali, Eickhoff, Fontcuberta i Morral, Xiong and Arbiol19 With electron probe diameters less than 0.1 nm, it is possible to image columns of light elements, such as oxygen and nitrogen, as well as heavy elements using annular bright field (ABF) detectors. Reference Okunishi, Ishikawa, Sawada, Hosokawa, Hori and Kondo20,Reference Findlay, Shibata, Sawada, Okunishi, Kondo, Yamamoto and Ikuhara21 Blocking the central region of the transmitted beam increases the contrast of the light elements.
Simulations have shown that optimal ABF imaging for most samples is achieved with a maximum detector collection angle approximately equivalent to the illumination angle and a minimum detector angle that is half the illumination angle. Reference Findlay, Shibata, Sawada, Okunishi, Kondo and Ikuhara22 It has also been shown that, similar to high angle annular dark field (HAADF) imaging, the ABF technique is relatively insensitive to specimen thickness (from 10 to 70 nm) and defocus conditions (−20 to +20 nm). Reference Findlay, Shibata, Sawada, Okunishi, Kondo and Ikuhara22,Reference Okunishi, Sawada and Kondo23 For imaging conditions where it is not possible to determine the elemental composition of atomic columns from ABF imaging alone, a simultaneously recorded HAADF image can be used to establish the location of the heavier element(s), thus eliminating ambiguity.
Since the development of the ABF technique, there have been several studies of GaN nanowires in which the sample polarity was determined directly from atomic imaging of the gallium and nitrogen column positions. Reference de la Mata, Magen, Gazquez, Utama, Heiss, Lopatin, Furtmayr, Fernández-Rojas, Peng, Morante, Rurali, Eickhoff, Fontcuberta i Morral, Xiong and Arbiol19,Reference den Hertog, González-Posada, Songmuang, Rouviere, Fournier, Fernandez and Monroy24–Reference Phillips, Carnevale, Kumar, Myers and Klie28 Another advantage of the ABF technique is that it provides polarity information with very high spatial resolution. The atomic resolution of the technique has enabled the discovery of inversion domains in GaN nanowires. Reference Auzelle, Haas, Minj, Bougerol, Rouvière, Cros, Colchero and Daudin5,Reference Zhang, Lourenço-Martins, Meuret, Kociak, Haas, Rouvière, Jouneau, Bougerol, Auzelle, Jalabert, Biquard, Gayral and Daudin26,Reference Aseev, Gačević, Torres-Pardo, González-Calbet and Calleja27 These narrow regions of polarity inverted material in NWs have not been identified by other methods.
A summary of reported TEM based polarity studies of catalyst-free, spontaneously nucleated GaN nanowires is given in Table I. For all but one of these, the samples were grown by plasma assisted molecular beam epitaxy (PAMBE). In the other study the samples were grown by ammonia source MBE. Reference Alloing, Vézian, Tottereau, Vennéguès, Beraudo and Zuniga-Péreza11 The studies can be organized into three different categories based on the technique(s) used for polarity determination: CBED only, CBED combined with a complimentary technique, and ABF. Surprisingly, the polarity determined for the NWs appears to be associated with the technique(s) used. In all of the studies where the sample polarity was determined by CBED analysis alone, Ga-polarity was reported. In contrast, N-polarity was reported in all of the studies where both CBED and a second independent method were used. N-polarity was also reported in the studies where ABF imaging was used.
GaN nanowire polarity determined in previous studies.

a Growth by MOCVD and ammonia source MBE.
In an effort to understand this systematic inconsistency in the determination of the NW polarity, we have measured polarity both directly, with ABF imaging, and indirectly, using CBED patterns, on the same nanowires at nominally the same position on each wire. A variety of NWs grown under varied conditions were studied. With proper accounting for the rotation between the sample image and the diffraction pattern, both CBED and ABF gave the same results for the NW polarity. All of the nanowires spontaneously nucleated on Si(111) substrates were found to grow with N-polarity. This is in agreement with the reports of polarity, listed in Table I, for NWs grown under similar conditions, in which ABF imaging or a combination of CBED and a complimentary method were used, and it is in conflict with the reports where CBED was used alone. The study highlights the importance of calibrating the orientation of CBED patterns relative to the sample image.
II. EXPERIMENTAL
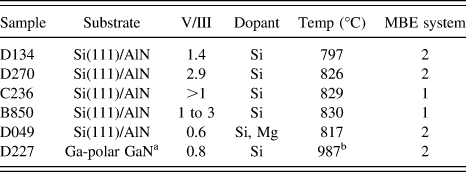
The GaN NWs used for the study were grown, without catalysts, by PAMBE. Two different MBE systems were used; the details of the growths in these systems have been described previously. Reference Brubaker, Roshko, Blanchard, Harvey, Sanford and Bertness6,Reference Brubaker, Duff, Harvey, Blanchard, Roshko, Sanders, Sanford and Bertness25 Si(111) substrates were used for five of the samples; the sixth was grown on a hydride vapor phase epitaxy (HVPE) GaN template layer on an Al2O3 substrate. The growths on Si(111) were initiated with AlN layers followed by a variety of AlN and GaN buffer layers. Nanowires grown on the Si substrates were spontaneously nucleated without catalyst. Growth on the HVPE GaN was by selective area growth (SAG), with a SiN x mask. In an effort to obtain nanowires with different defect morphologies and different polarities, a variety of V/III ratios and substrate temperatures were used (see Table II). The V:III ratios were estimated from the ratio of planar film growth rates under similar operating conditions for N-limited and Ga-limited growth. Reference Brubaker, Duff, Harvey, Blanchard, Roshko, Sanders, Sanford and Bertness25 The nanowires were examined by scanning electron microscopy and found to have roughly hexagonal cross-sections with diameters from 40 to 400 nm and lengths up to 10 µm. Reference Bertness, Roshko, Mansfield, Harvey and Sanford29 The nanowires examined by TEM had diameters less than 300 nm and lengths from 1 to 9 µm.
GaN growth parameters.
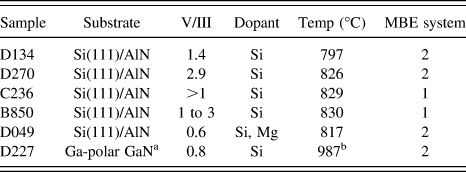
a HVPE GaN on Al2O3, selective area growth.
b Pyrometer not calibrated for Al2O3 substrates.
TEM specimens were prepared by both dry dispersal and focused ion beam (FIB) milling. The spontaneously nucleated nanowires were directly transferred to carbon coated TEM grids by rubbing the grids across the as-grown material. A lamella of the SAG growth on the HVPE GaN was prepared by deposition of protective metal layers (Ni and Pt) followed by FIB milling with a Ga-ion beam at 30 kV then 5 kV. FIB damage was removed by subsequent Ar milling at 850 eV.
Three different instruments were used for TEM CBED measurements. Microscope 1 was a JEM ARM200F (JEOL Ltd., Tokyo, Japan) with a spherical aberration corrected probe, microscope 2 was a JEM-2100F (JEOL Ltd.), and microscope 3 was a Philips CM30 (Philips Electron Optics, Eindhoven, The Netherlands). 30 Microscopes 1 and 2 both had field emission electron sources; microscope 3 had a LaB6 filament. All three microscopes were operated at 200 kV. CBED patterns were acquired with a 30 μm CL aperture and convergence angles of 6.4 and 7.6 mrad respectively for instruments 1 and 2. The convergence angle for microscope 3 was 5.75 mrad.
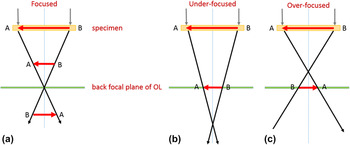
For correct determination of the sample polarity from CBED it is extremely important to measure the rotation of the diffraction pattern relative to the image. This angle can be measured by under-focusing the diffraction lens to obtain an image of the sample in each diffraction spot while in diffraction mode. Reference De Graef17 The specimen image in the diffraction spots has the same orientation relative to the TEM image as the diffraction pattern. While some texts describe the procedure as “defocusing” the diffraction lens, Reference Williams and Carter18 as shown in Fig. 2 and described in Ref. Reference De Graef17, to obtain the correct orientation of the sample image in the diffraction spots the diffraction lens must be under-focused rather than over-focused.
Projection of the specimen orientation into the diffraction pattern at the back focal plane with the diffraction lens: (a) focused, (b) under-focused and (c) over-focused. The beam at the sample is parallel, not converged.

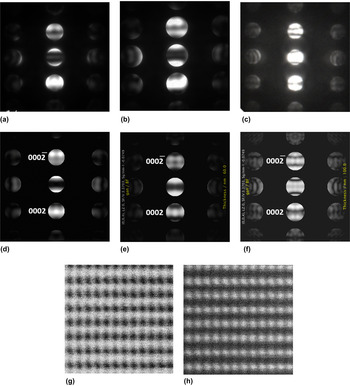
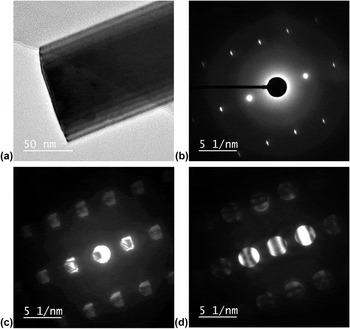
The nanowire geometry is ideal for measuring this rotation angle, since using either end of the NW it is possible to obtain a clear image of the wire orientation in the defocused diffraction spot. The images recorded to calibrate the diffraction pattern rotation in microscope 1 are shown in Fig. 3. For all three microscopes it was found that the CBED pattern was rotated relative to the specimen image. For microscopes 1 and 2 the rotation was ∼180°; for microscope 3 the rotation was ∼120°. The rotation was determined from measurement of the diffraction pattern rotation relative to the sample images and confirmed by comparison of the polarity determined from the CBED with the polarity determined by ABF imaging. For microscopes 1 and 3 the camera length used for the selected area electron diffraction (SAED) patterns were 20 cm; for microscope 2 a camera length of 30 cm was used.
Images taken with microscope 1 at the end of a nanowire from sample C236; all images were taken along the
 $\left[ {1\bar 100} \right]$
zone axis: (a) TEM image of the specimen, (b) selected area electron diffraction pattern at focus, (c) same SAED pattern but with an underfocused diffraction lens, showing that the sample image in the diffraction pattern is rotated 180° from the phase contrast image, and (d) corresponding CBED pattern. All diffraction patterns were taken with a camera length of 20 cm.
In the GaN wurtzite crystal structure (shown schematically in Fig. 1) the [0001] direction is defined by convention as the direction of the Ga to N bond. This is also the direction pointing to the Ga-polar surface. The two low index zone axes (ZA) perpendicular to the [0001] direction are the
 $\left[ {11\bar 20} \right]$
and the
 $\left[ {1\bar 100} \right]$
(see Fig. 1). These zone axes are separated by 30°. For CBED polarity analysis of GaN the
 $\left[ {1\bar 100} \right]$
ZA works well because the contrast in the
 $\left( {0002} \right)/\left( {000\bar 2} \right)$
spots is very asymmetric and strongly dependent on thickness, simplifying both polarity and thickness determination.
Reference Daudin, Rouviere and Arley15,Reference Mitate, Mizuno, Takahata, Kakegawa, Matsuokab and Kuwano31,Reference Liu, Collazo, Mita, Sitar, Pennycook and Duscher32
For ABF imaging, the projected distance between the Ga and N atoms along the
 $\left[ {11\bar 20} \right]$
ZA is 110 pm.
Reference de la Mata, Magen, Gazquez, Utama, Heiss, Lopatin, Furtmayr, Fernández-Rojas, Peng, Morante, Rurali, Eickhoff, Fontcuberta i Morral, Xiong and Arbiol19,Reference Liu, Collazo, Mita, Sitar, Pennycook and Duscher32
This distance is less along the
 $\left[ {1\bar 100} \right]$
ZA. However, because the
 $\left[ {1\bar 100} \right]$
axis is preferred for CBED analysis and because it was desired to have CBED and ABF imaging at nominally the same spots on the same NWs, for this study both CBED and ABF imaging were performed along the
 $\left[ {1\bar 100} \right]$
ZA.
CBED patterns were simulated with Java-Script EMS Software,
Reference Stadelmann33
using Bloch wave calculations. Patterns were simulated for thicknesses from 40 to 200 nm in 5 and 10 nm steps, with the following instrument parameters: chromatic aberration 1.1 mm, spherical aberration 0.5 mm, energy spread 1.2 eV, defocus 45 nm, and convergence angle 6.3 mrad. The sample polarity was determined by finding the pattern which best matched (by qualitative visual inspection) the experimental CBED contrast. The thickness of the calculated pattern with the best match was typically equivalent to or slightly less than the nanowire diameter measured from (S)TEM images. Because the NWs are oriented with flat
 $\left\{ {{\rm{1\bar 100}}} \right\}$
faces perpendicular to the beam, and assuming they have hexagonal cross-sections, from simple geometry the thickness along the beam direction is expected to be 0.866 times the imaged diameter. The small differences between the NW diameters determined from the simulated CBED patterns and those expected, based on TEM images, result from irregularities in the NW hexagonal cross-sections. Such irregularities have been observed by scanning electron microscopy.
Reference Bertness, Roshko, Mansfield, Harvey and Sanford29
All high resolution STEM ABF images were recorded with microscope 1, which is equipped with a spherical aberration probe corrector as well as both annular bright field (combined BF detector and beam stop) and high angle dark field detectors. The images were acquired at 200 kV, at which voltage the instrument has a STEM spatial resolution of 0.082 nm, demonstrated by direct imaging of dumbbells in a Ge(112) sample with a probe current of 29 pA. The ABF images were recorded with an illumination half angle of 22.7 mrad, and inner and outer ABF detector collection half angles of 11 and 22.5 mrad respectively. Unless noted otherwise, all STEM images are single-frame, unprocessed images.
III. RESULTS AND DISCUSSION
The CBED pattern and STEM images of a nanowire from sample C236 are shown in Fig. 4. Based on the calibrated diffraction pattern rotation, the CBED pattern, Fig. 4(a), was rotated to correspond to the NW top end oriented up. The top (growth) and bottom ends of the nanowires were differentiated by both their morphologies and diameters. From SEM images of the nanowires still on their substrates it was established that the nanowires have a narrower base and wider tip. Reference Bertness, Roshko, Mansfield, Harvey and Sanford29 In addition, the bottom end of many NWs could be easily identified because they had jagged facets due to fracture on removal from the substrate or because they were formed from multiple roots.
Images taken with microscope 1 of a nanowire from sample C236. (a) Experimental CBED pattern [same as Fig. 3(d)] but rotated to correspond to the NW growth direction pointing up. (b) Calculated CBED pattern for 85 nm, which best matches the contrast of the experimental pattern in (a) and from which it is evident that the growth direction of the NW is
 $\left[ {{\rm{000\bar 2}}} \right]$
, or N-polar. (c) and (d) High resolution STEM ABF and HAADF images (taken coincidently) showing the NW growth direction is N-polar. The Ga positions from the HAADF image have been overlaid in the lower right corner of the ABF image (green in color version, gray in black and white). (e) Plot of the pixel intensity as a function of position along the trace marked in (c), showing the weaker signal from the N column just above the darker Ga column. The left hand side of the plot corresponds to the top of the trace. The trace was integrated over 11 pixels in the horizontal direction. (f) Low resolution ABF image showing the positions of the CBED and STEM analyses. All images were taken along the
 $\left[ {1\bar 100} \right]$
zone axis.

The calculated CBED pattern which best matches the contrast bands in the experimental pattern is for a GaN thickness of 85 nm, Fig. 4(b). The projected nanowire diameter, measured from Fig. 3(a), is 100 nm. If the NW cross-section were a perfect hexagon the expected thickness along the beam direction would be 87 nm, in agreement with the 85 nm thickness of the matching calculated pattern. The simulated CBED pattern establishes that the NW growth direction is
 $\left( {000\bar 2} \right)$
, or N-polar.
High resolution STEM ABF and HAADF images of the same NW are shown in Figs. 4(c) and 4(d). The positions from which the CBED pattern and STEM images were acquired, as well as the NW orientation for STEM imaging, are shown in Fig. 4(f), which was recorded at the top of the NW. The high resolution ABF image, Fig. 4(c), shows that the N atomic columns are above the Ga columns, corresponding to the NW being N-polar and consistent with the CBED result. The N polarity is more clearly evident in a plot of the intensity at each pixel along the line marked in Fig. 4(c) (integrated over 11 pixels in the horizontal direction), the N column is visible just above the darker Ga column [Fig. 4(e)]. Figure 4(d) is the complimentary HAADF image for Fig. 4(c). Mathematically defining an intensity minimum for the HAADF image, it is possible to establish the position of the Ga columns. As shown in the overlay in the lower right corner of Fig. 4(c) (green in online version, white in the b/w), the Ga columns in the HAADF image lie directly on top of the columns assigned to Ga in the ABF image, confirming the N-polarity of the sample.
CBED patterns from three different NWs from sample D134 are shown in Figs. 5(a)–5(c). Each pattern was recorded with a different microscope and has been rotated to correspond to the nanowire growth direction pointing up, based on the calibrated diffraction pattern rotation for that microscope. Simulated CBED patterns which best match the experimental patterns are shown in Figs. 5(d)–5(f). The patterns are for GaN thicknesses of 55 nm, 60 nm, and 100 nm, respectively. From these it is found that all three NWs have a
 $\left( {000\bar 2} \right)$
growth direction. High resolution STEM images of the NWs imaged in Fig. 5(a) [Figs. 5(g) and 5(h)] and Fig. 5(b) (not shown) also confirmed the N-polarity. STEM ABF imaging was used to determine the polarity of four additional NWs from this sample, all of which were also found to be N-polar.
(a)–(c) experimental CBED patterns of three different NWs from sample D134 taken with microscopes 1, 2 and 3 respectively; (d)–(f) calculated CBED patterns for thickness of 55 nm, 60 nm, and 100 nm, which match experimental patterns (a)–(c) respectively; (g) and (h) STEM ABF (showing N columns above Ga, N-polarity) and HAADF images of the NW imaged in (a). Similar STEM images were obtained for the NW imaged with microscope 2 [CBED pattern shown in (b)].

Similar CBED patterns and corresponding ABF images were acquired on NWs from samples B850 and D049. For both samples the patterns and images are consistent with a
 $\left( {000\bar 2} \right)$
growth direction, that is, N-polarity. For one NW from sample B850 the polarity was determined from a CBED pattern recorded from a region which was 260 nm thick. This highlights one of the advantages of the CBED technique, as it was not possible to determine the sample polarity from ABF imaging in such thick regions. While the polarity determination from ABF imaging was not systematically studied as a function of sample thickness, the thickest region for which ABF imaging was used for polarity determination was 160 nm.
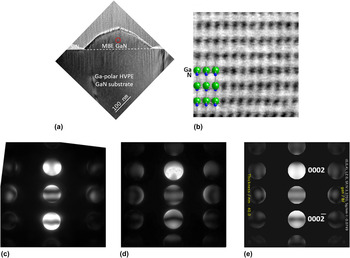
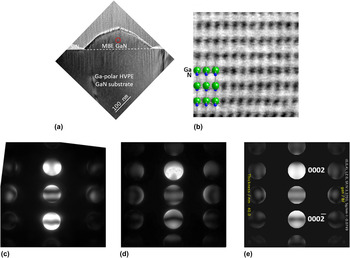
Sample D227 differs from the other samples in that it was grown by selective area epitaxy on a Ga-polar GaN on Al2O3 substrate, under conditions where Ga-polarity growth is self-limiting. As shown in Fig. 6(a) the growth morphology was pyramidal rather than NW. STEM ABF imaging [Fig. 6(b)] confirmed that the growth was Ga-polar or (0002). CBED patterns, from both microscopes 1 and 2 [Figs. 6(c) and 6(d)], also indicate Ga-polarity, consistent with the ABF result.
Images of sample D227 showing Ga-polarity, consistent with pyramidal rather than nanowire growth. (a) Low magnification TEM image of GaN growth pyramid on HVPE GaN substrate with SiN mask. (b) STEM-ABF image taken in circled region in (a) and showing Ga-polarity. (c) and (d) Experimental CBED patterns taken with microscopes 1 and 2 at region circled in (a). (e) Calculated CBED pattern which matches the experimental patterns and confirms Ga-polarity.
These results for the SAG GaN are similar to previous observations of SAG GaN on GaN templates both by CBED Reference Urban, Malindretos, Klein-Wiele, Simon and Rizzi34 and ABF. Reference Aseev, Gačević, Torres-Pardo, González-Calbet and Calleja27,Reference Gačević, Bengoechea-Encabo, Albert, Torres-Pardo, González-Calbet and Calleja35 In the earlier CBED study both KOH etching and CBED were used to confirm the Ga polarity of SAG nanocolumns grown on GaN(0001) templates. In that work CBED from the Ga-polar template was used as a reference for determining the orientation of the CBED patterns from the nanocolumns.
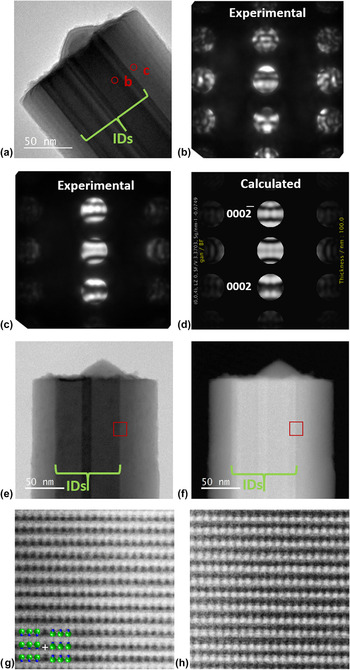
Images of a nanowire from sample D270 are shown in Fig. 7. The TEM image, Fig. 7(a), shows dark contrast near the center of the NW indicating something unusual occurs in this region [compare with TEM image in Fig. 3(a)]. Two CBED patterns were collected, one from the dark contrast region and one away from it, at the spots indicated on the TEM image. The pattern recorded away from the dark contrast region, closer to the edge of the NW, was well matched by the simulated CBED pattern for a GaN thickness of 100 nm, confirming this region of the NW is N-polar [Figs. 7(c) and 7(d)]. None of the simulated patterns matched the more complicated CBED pattern acquired in the dark contrast region [Fig. 7(b)]. This pattern had more vertical and less regular horizontal bands than any of the simulated CBED patterns.
(a) Low magnification TEM image of a nanowire from sample D270. Inversion domains are visible in the center of the nanowire. (b) and (c) CBED patterns taken at the spots circled in (a), both on and off the ID respectively. (d) The calculated CBED pattern which matches that in (c), which was taken off of the ID; the calculated pattern shows that the majority of the NW is N-polar. None of the calculated patterns matched CBED pattern (b), which was taken through the ID; this is not surprising since material with both polarities contributed to this pattern. (e) and (f) Low magnification STEM-ABF and HAADF images of the same nanowire; the square marks the position of (g) and (h) high resolution STEM-ABF and HAADF images at the edge of the ID. The right hand side of the ABF image, (g), shows the nitrogen columns are above the darker Ga columns; so the outside of the NW has N-polarity, consistent with the CBED results. The left side of the HAADF image, (h), shows an elongation of the N columns along the NW growth axis, consistent with mixed polarity in this region; that is, the Ga columns in the ID are switched with the N columns, so two slightly offset Ga columns contribute to the HAADF signal in this region.

Low magnification STEM images of this same NW [Figs. 7(e) and 7(f)] show bands of increased contrast near the center of the wire similar to those in the TEM image. ABF imaging near the NW edges, where there is less contrast, confirmed N-polarity consistent with the CBED result. In the higher contrast regions, the nitrogen columns are not clearly visible in the ABF images and the STEM images indicate the superposition of the two different polarities, due to the presence of an inversion domain (ID). Figures 7(g) and 7(h) are STEM images acquired at the edge of one of these IDs [position marked in (e) and (f)]. The N-polarity of the NW is clearly visible on the RHS of the ABF image [Fig. 7(g)], but is not as evident on the LHS where N-polar material overlaps with a Ga-polar ID. Consistent with this, the Ga columns are sharper on the RHS of the HAADF image, but elongated along the c-axis on the LHS due to the displacement of the columns where the different polarities overlap.
The presence of inversion domains in N-polar GaN NWs, grown both spontaneously and by SAG, and the different contrast they generate in STEM images, has been reported previously. Reference Auzelle, Haas, Minj, Bougerol, Rouvière, Cros, Colchero and Daudin5,Reference Zhang, Lourenço-Martins, Meuret, Kociak, Haas, Rouvière, Jouneau, Bougerol, Auzelle, Jalabert, Biquard, Gayral and Daudin26,Reference Aseev, Gačević, Torres-Pardo, González-Calbet and Calleja27 There appear to be two, overlapped IDs in the nanowire imaged in Fig. 7. The pyramidal feature on top of the NW is analogous to the shape observed for Ga-polar growth (see Fig. 6, also Refs. Reference Daudin, Rouviere and Arley15, Reference Brubaker, Duff, Harvey, Blanchard, Roshko, Sanders, Sanford and Bertness25, Reference Urban, Malindretos, Klein-Wiele, Simon and Rizzi34, and Reference Gačević, Bengoechea-Encabo, Albert, Torres-Pardo, González-Calbet and Calleja35) and is likely the top surface of one of the Ga-polar IDs. It is interesting that the pyramidal growth appears on top of one ID, but that the second ID is not terminated by a pyramid. It is also of note that, although from the images one might assume that a large fraction of the NW is Ga-polar, this is likely not the case. Assuming circular cross-sections for the NW and IDs, and using the projected widths of the NW (160 nm) and IDs (47 and 48 nm) measured from the STEM ABF image, it can be calculated that approximately 82% of the NW is N-polar and 18% is Ga-polar.
Stacking faults (SFs) or structure polytype defects may also be expected to complicate CBED patterns and their interpretation.
Reference Zuo, Weirich, Lábár and Zou36
While PAMBE-grown GaN NWs are well known for their low defect densities, SFs and polytypes are still present in some NWs. However, both of these structural defects are not visible by direct lattice imaging of GaN along the
 $\left[ {1\bar 100} \right]$
ZA, which is typically used for CBED determination of polarity in GaN. Therefore, unless a polarity inversion is also associated with these structural defects (which is not typically the case) or the CBED pattern is acquired along a different ZA, these defects should not affect polarity determination by CBED. Stacking faults are clearly visible in (S)TEM images along the
 $\left[ {11\bar 20} \right]$
ZA.
Reference Howie37
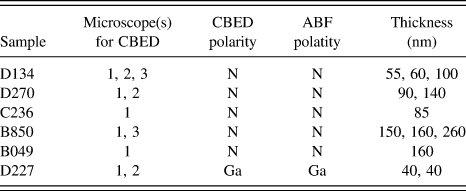
For all of the nanowires imaged in this study, when the rotation of the CBED pattern was accounted for, the polarity determined from CBED and ABF imaging was the same (see Table III). A 180° rotation between the TEM image and CBED pattern has been reported previously in a study of planar GaN samples. Reference Daudin, Rouviere and Arley15 In that study a CdTe crystal, for which the polarity was directly determined from ion channeling experiments, was used to calibrate the CBED pattern rotation. It may be significant that none of the studies listed in Table I, that used only CBED for polarity determination describe calibrating the orientation of the CBED pattern with respect to the image.
Measurement summary.
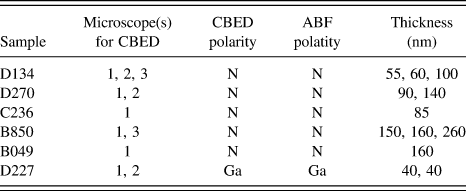
The polarity determination was also consistent for a range of sample thicknesses (see Table III). Using the thickness from the best matched simulated CBED patterns, the thickness range for CBED measurements was from 40 to 260 nm; for ABF imaging it was from 40 to 160 nm. These results suggest that the polarity determination is not limited by incomplete knowledge of the specimen thickness, nor is it limited by the small dimensions of NWs.
IV. SUMMARY
For all three TEM instruments used in this study the polarity determined from CBED patterns was consistent with that determined from ABF images.
A critical step in obtaining this result was measurement of the rotation angle between the diffraction pattern and the sample image. Microscopes 1 and 2 (both JEOL instruments) 30 have a 180° rotation between the CBED pattern and the TEM image; microscope 3 (a Phillips instrument) 30 has a 120° rotation. For all three microscopes, without the knowledge of the rotation between the TEM image and CBED pattern, the polarity for the NW growth direction from the CBED patterns would have been incorrectly assigned Ga-polar rather than N-polar.
Inversion domains were observed in some NWs. While these were readily identifiable by ABF imaging, they complicated the CBED patterns and prevented polarity determination from these. It is possible that IDs have contributed to some of the inconsistency between the polarity determinations in previous studies (see Table I). Further simulations of patterns for GaN including IDs may make it possible to identify these with CBED as well.
Finally, the study illustrates the relative advantages of each method for determination of GaN NW polarity. The CBED technique can be used on thicker samples and requires only a basic TEM instrument. On the other hand, the directness of ABF imaging escapes some of the ambiguity associated with CBED analysis. It avoids the requirements associated with CBED of calibrating the diffraction pattern rotation relative to the image and of calculating CBED patterns as a function of thickness for comparison. In addition, the high spatial resolution of ABF imaging enables identification of narrow diameter, overlapped inversion domains in GaN NWs, which have not been identified by CBED.