Implications
It is well recognized that methane (CH4) is a potent greenhouse gas and ruminant production systems are a significant source of enteric emissions. New mobile technologies in gas analysis offer a means of assessing enteric CH4 emissions from individual animals under commercial farm conditions from repeated spot measurements. This study concluded that if the management of feed allocation remains constant then the diurnal pattern of CH4 emissions from dairy cows will not necessarily alter over time. This is important for CH4 monitoring techniques that involve taking measurements over short periods within a day rather than complete 24-h observations.
Introduction
Enteric CH4 is produced in the digestive tract by micro-organisms called archaea as a by-product of anaerobic fermentation (methanogenesis). It is well recognized that CH4 is a potent greenhouse gas and ruminant production systems are a significant source of enteric emissions. Because dairy cows contribute significantly to national and global emissions, they have come under increased scrutiny to reduce their environmental impact. A large proportion of the variation in enteric CH4 emissions from animals can be explained by diet composition and feed intake, with higher forage proportion in the diet increasing CH4 emissions (Bell and Eckard, Reference Bell and Eckard2012). In addition to the variation in CH4 explained by diet, there is considerable variation among individual dairy cows which offers the opportunity for genetic selection (de Haas et al., Reference de Haas, Windig, Calus, Dijkstra, de Haan, Bannink and Veerkamp2011; Garnsworthy et al., Reference Garnsworthy, Craigon, Hernandez-Medrano and Saunders2012a; Huhtanen et al., Reference Huhtanen, Krizsan, Hetta, Gidlund and Cabezas Garcia2013). Quantifying enteric CH4 emissions during milking by using low cost and mobile technologies has been demonstrated to provide repeatable phenotypic estimates of CH4 emissions under commercial conditions (Lassen et al., Reference Lassen, Løvendahl and Madsen2012; Garnsworthy et al., Reference Garnsworthy, Craigon, Hernandez-Medrano and Saunders2012a and 2012Reference Garnsworthy, Craigon, Hernandez-Medrano and Saundersb). In the study of Garnsworthy et al. (Reference Garnsworthy, Craigon, Hernandez-Medrano and Saunders2012a), estimates of CH4 made during milking were correlated with total daily CH4 emissions by the same cows when housed subsequently in respiration chambers. Use of respiration chambers is however impractical for large-scale estimation of CH4 emissions by individual cows on commercial dairy farms, hence the research into mobile gas analyzer techniques that can be used to measure emissions from individual animals in their normal environment. The approach proposed by Garnsworthy et al. (Reference Garnsworthy, Craigon, Hernandez-Medrano and Saunders2012a) samples gas from the feed bin of automatic (robotic) milking stations whilst cows are being milked, and measures CH4 concentrations with a portable gas analyzer. The frequent sampling of gas emissions provides repeated measurements to allow assessment of within-cow, between-cow, diet and temporal effects on CH4 emissions. Several studies have observed a diurnal pattern to CH4 emissions from ruminant livestock (Kinsman et al., Reference Kinsman, Sauer, Jackson and Wolynetz1995; Crompton et al., Reference Crompton, Mills, Reynolds and France2011; Manafiazar et al., Reference Manafiazar, Zimmerman and Basarab2017), which follows a typical peak in emissions after feeding followed by a decline until the next consumption of feed. This diurnal pattern has been found to be affected by feed allowance and feeding frequency (Crompton et al., Reference Crompton, Mills, Reynolds and France2011), with no overall influence on average daily CH4 yield (Jonker et al., Reference Jonker, Molano, Antwi and Waghorn2014; Brask et al., Reference Brask, Weisbjerg, Hellwing, Bannink and Lund2015). These studies have not considered that the diurnal pattern of CH4 emissions may change over time, and potentially may be influenced by changes in intake (or allowance). These considerations are important when CH4 is measured in spot samples rather than continuously for 24 h.
The objective of the current study was to assess any potential change in diurnal pattern of CH4 emissions from individual dairy cows fed diets differing in forage composition over three consecutive feeding periods during lactation.
Material and methods
Animal work was conducted under authority of the UK Animal (Scientific Procedures) Act 1986, and approval was obtained from the University of Nottingham animal ethics committee before commencement of the study.
Data
Concentrations of CH4 from Holstein Friesian dairy cows were measured during milking at Nottingham University Dairy Centre (Sutton Bonington, Leicestershire, UK). Cows were grouped housed in a freestall barn and milked individually at an automatic (robotic) milking station (AMS). Gas concentrations were measured continuously by an IR analyzer (Guardian Plus; Edinburgh Instruments Ltd, Livingston, UK) in the AMS throughout the sampling period. For a full description of the technique see Garnsworthy et al. (Reference Garnsworthy, Craigon, Hernandez-Medrano and Saunders2012a). In brief, the CH4 concentration was logged at 1 s intervals on data loggers (Simex SRD-99; Simex Sp. z o.o., Gdańsk, Poland) and visualized using logging software (Loggy Soft; Simex Sp. z o.o.). The CH4 analyzer was calibrated using standard mixtures of CH4 in nitrogen (0.0%, 0.25%, 0.50%, 0.75% and 1.0% CH4; Thames Restek UK Ltd, Saunderton, UK). Concentrations of CH4 measured in parts per million (v/v) were converted to mg/l by assuming the density of CH4 to be 655.7 mg/l, with the analyzer sampling air at 1 l/min. Concentrations of CH4 emitted during each milking were calculated using a custom-designed program to identify eructation peaks of CH4 concentration (Garnsworthy et al., Reference Garnsworthy, Craigon, Hernandez-Medrano and Saunders2012a) and quantify the average concentration during milking from the area under the curve. Milkings with <3 eructation peaks for CH4 concentration, and peaks where the cow’s head was not within the feed bin, were excluded from the analysis.
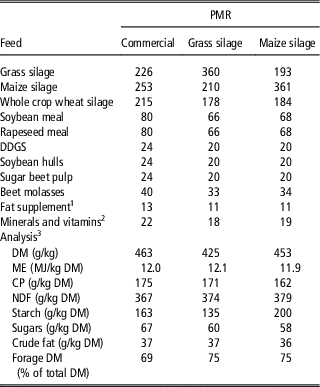
Emissions were measured during three consecutive feeding periods, in which cows were fed partial mixed rations (PMR; Table 1) ad libitum plus concentrates during milking. This provided CH4 emissions from individual cows for 8662 milkings during the study across each day and feeding period. In Periods 1 and 2, 36 cows were fed in a 14-day crossover design experiment with PMRs containing 75% forage with high proportions of either grass silage or maize silage (Table 1). In Period 3, the same 36 cows were fed a commercial PMR for 56 days containing 69% forage (Table 1). There was no transition period between feeding periods. At the start of the study the 36 cows were randomly allocated to create two equal groups for the duration of the study based on lactation number (average in both groups was two lactations) and days in milk at the start of the study (154 days for Group 1 and 214 days for Group 2).
Composition and analysis of commercial, high grass silage and high maize silage partial mixed rations (PMR)

DDGS=distillers dried grains with solubles (maize); DM=dry matter; ME=metabolisable energy.
1 Butterfat extra (Trident Feeds, Peterborough, UK).
2 Contained 18% Ca, 10% P, 5% Mg, 17% salt, 2000 mg of Cu/kg, 5000 mg of Mn/kg, 100 mg of Co/kg, 6000 mg of Zn/kg, 500 mg of I/kg, 25 mg of Se/kg, 400 000 IU of vitamin A/kg, 80 000 IU of vitamin D3/kg and 1000 mg of vitamin E/kg.
3 All ingredients were analyzed by a commercial analytical laboratory (Sciantec Analytical Services, Cawood, UK).
Cows were given their feed allocation between 0700 and 0900 h each morning. Daily concentrate allowance fed during milking was 1.5 kg plus 0.16 kg/l of milk yield above 23 l/day. Milk yield, live weight, duration of milking and rumination time (QWES-HR Tag in Lely’s Astronaut A3) were recorded automatically at each milking by the AMS. Dry matter (DM) intake of PMR was recorded automatically by electronic feeders during Periods 1 and 2 only.
Statistical analysis
Data were analyzed using a linear mixed model in Genstat Version 17.1 (Lawes Agricultural Trust, 2012). Equation (1) was used to assess the effect of cow group, feeding period and time of day on CH4 emissions (mg/l) per individual cow:
 $$\eqalignno{ y_{{ijklm}} \,{\equals}\,&\mu {\plus}G_{i} H_{j} P_{k} {\plus}L_{l} {\plus}\beta _{1} {\rm DIM}{\plus}\beta _{2} D{\plus}C_{m} {\plus}C_{m} P_{k} \cr&{\plus}C_{m} P_{k} H_{j} {\plus}E_{{ijklm}} $$
where y ijklm is the dependent variable; µ the overall mean; G i the fixed effect of cow group (i=1 or 2); H j the fixed effect of time block during day (j=1, 2, 3, 4, 5 or 6); P k the fixed effect of feeding period (k=1, 2 or 3); L l the fixed effect of lactation number (l=1 to n); β 1DIM the regression on days in milk; β 2 D the regression on duration of milking (s); C m the random effect of individual cow; C m P k the random effect of feeding period within individual cow; C m P k H j the random effect of time block during day within feeding period and individual cow; and E jklm the random error term.
The time of day was expressed as six 4-h time blocks for a 24-h day (1=0500 to 0859 h; 2=0900 to 1259 h; 3=1300 to 1659 h; 4=1700 to 2059 h; 5=2100 to 2459 h; 6=0100 to 0459 h). Of the 8662 milkings with methane measurements, there were 1325 during time block 1, 1368 during time block 2, 1622 during time block 3, 1462 during time block 4, 1604 during time block 5 and 1281 during time block 6. Time block 1 started from 0500 h in the morning to ensure the first 4-h block included the time of feed allocation towards the end of the time period (i.e. from 0700 to 0900 h). To assess differences in diurnal patterns among individual cows equation (1) was used with the fixed effect of group (G i ) replaced by the unique identification of each individual cow (C m ). To assess the effect of group, feeding period and the interaction between group and period on average DM intake, forage DM intake, total concentrate DM intake, robot concentrate DM intake, milk yield (all kg/day), live weight (kg), rumination time (min/day), average duration of milking (s), average number of milkings per day and average frequency of eructations per minute per individual cow, equation (1) was used without the effects of time of day (H j ) and duration of milking (β 2 D).
Pearson correlation coefficient was used to assess the association between total DM intake, forage DM intake, total concentrate DM intake, robot concentrate DM intake, milk yield, live weight, rumination time, duration of milking, number of milkings per day, frequency of eructations and emissions of CH4 across all individual cow records. The significance of effects on CH4 emissions was attributed at P<0.05.
Results and discussion
Cow performance
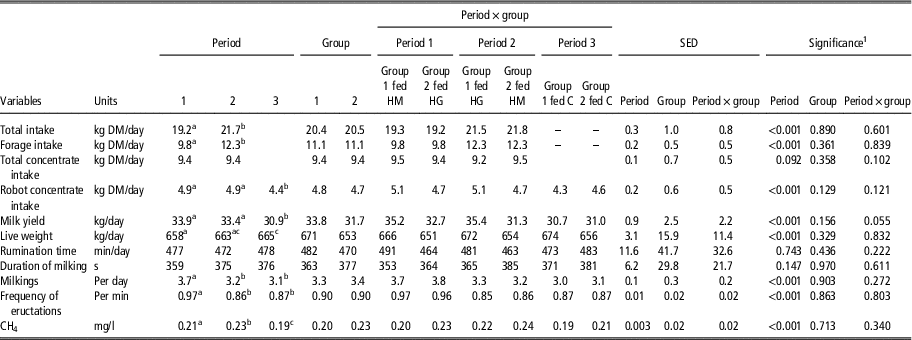
The averages for production variables (Table 2) generally reflect changes associated with increasing days in milk. Average live weight increased from Periods 1 to 3, which reflects the stage of lactation and possibly the increase in total DM intake and forage DM intake from Period 1 to 2 during which PMR intakes were recorded (all P<0.001; Table 2). In Periods 1 and 2, when cows fed on the high-forage diets, cows had higher robot concentrate DM intake, milk yield and CH4 emissions compared with Period 3, when cows were fed on the commercial PMR (all P<0.001; Table 2). Also, cows in Period 1 had higher frequencies of milkings and eructations compared with Periods 2 and 3 (both P<0.001; Table 2). There was no effect of period or group on average total concentrate DM intake, rumination time and duration of milking (P>0.05).
Predicted mean production and methane (CH4) emissions for groups of cows fed on high grass silage (HG), high maize silage (HM) and commercial (C) partial mixed rations on consecutive feeding Periods (1, 2 and 3)Footnote 1 during lactation

a,b,cMeans within a row with different superscript letters differ significantly.
1 In consecutive feeding periods, 36 cows were randomly split into two groups and fed two diets containing high percentages of grass silage or maize silage in a crossover design (Periods 1 and 2) followed by a commercial ration (Period 3).
Methane emissions
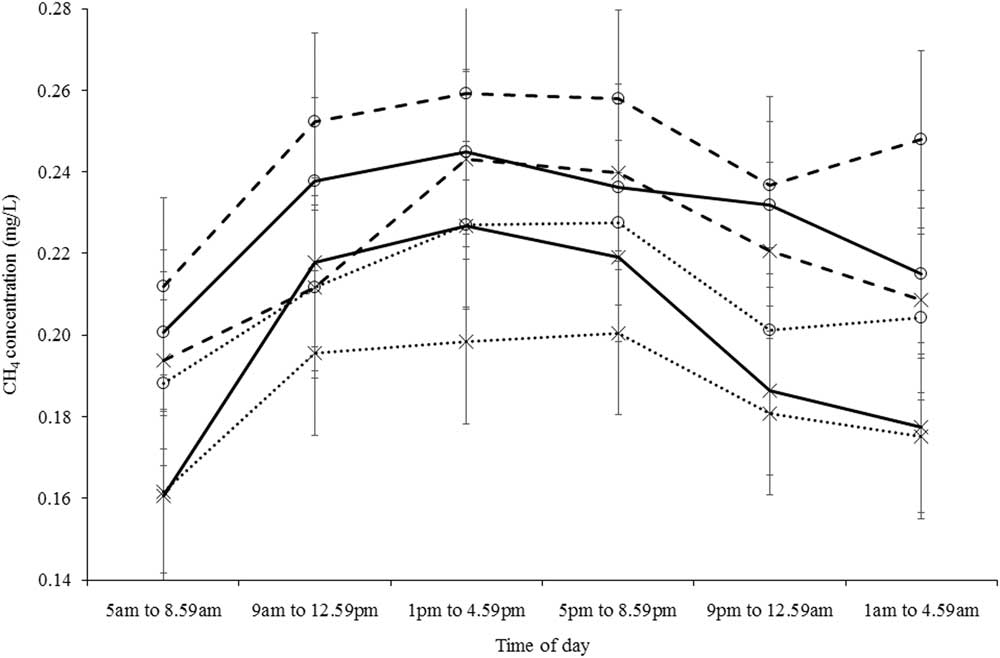
A consistent diurnal pattern (SED=0.004, P<0.001; Figure 1) was observed across time with emissions lowest between 0500 and 0900 h, which coincided with when feed was allocated, and highest between 1200 and 2000 h. The highest average CH4 value for each period×group was 1.2 times greater than the lowest value, except for Group 1 in Period 1 where it was 1.4 times greater. This diurnal pattern is consistent with other studies (Kinsman et al., Reference Kinsman, Sauer, Jackson and Wolynetz1995; Crompton et al., Reference Crompton, Mills, Reynolds and France2011; Manafiazar et al., Reference Manafiazar, Zimmerman and Basarab2017) and the conclusion that the diurnal pattern is driven by time of day when feed is allocated and the amount of feed consumed; with a typical pattern as seen in the current study of a rise in CH4 emissions directly after feed allocation to a maximum in emissions in the afternoon, which then declines until the time of the next allocation of feed as found by other studies (Crompton et al., Reference Crompton, Mills, Reynolds and France2011; Jonker et al., Reference Jonker, Molano, Antwi and Waghorn2014; Brask et al., Reference Brask, Weisbjerg, Hellwing, Bannink and Lund2015).
Mean methane (CH4) concentration (with SE bars) for cow Groups 1 (×) and 2 (○) during 6×4 h blocks from 0500 h onwards for feeding Periods 1 (solid line), 2 (dashed line) and 3 (dotted line). Cows were fed a high-forage partial mixed ration during feeding Periods 1 and 2 and a commercial partial mixed ration during Period 3.

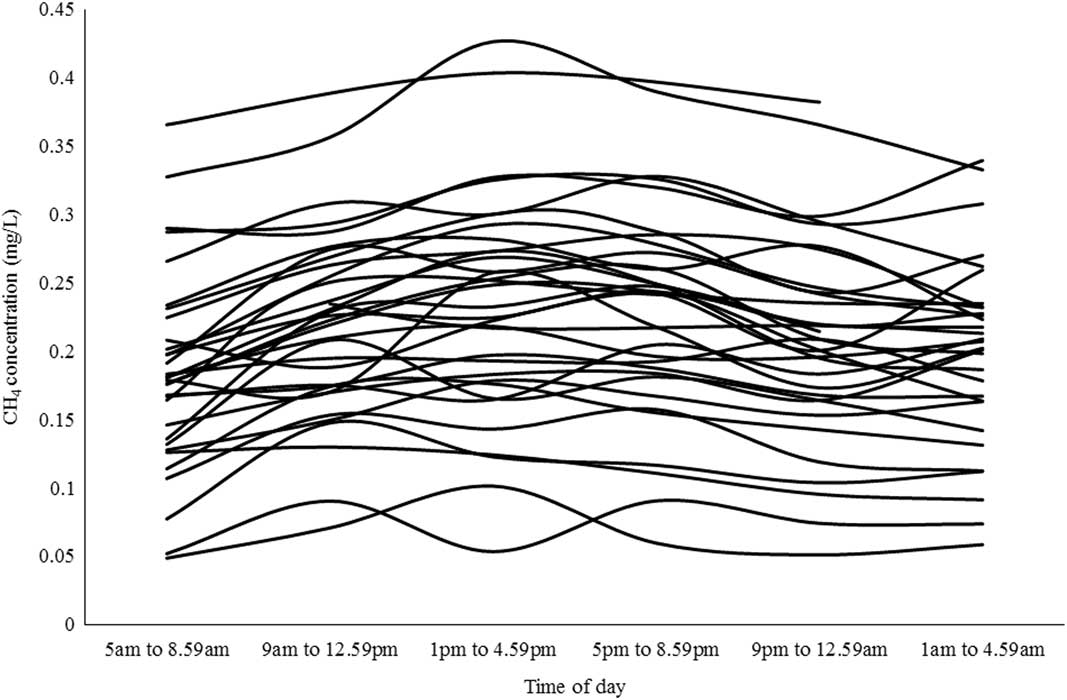
Considerable variation in CH4 emissions was observed among individual animals (SED=0.01, P<0.001). There was an interaction between individual cow and time of day (SED=0.03, P<0.001; Figure 2), which can be explained by differences among cows with regard to when cows consumed the PMR (Crompton et al., Reference Crompton, Mills, Reynolds and France2011), rather than when methane emissions were measured in the AMS (and fed an allocation of concentrate feed) in the current study. There was no interaction between feeding period and time of day, or between cow, feeding period and time of day. The difference in diurnal CH4 pattern seen among individual cows is associated with frequency of PMR feeding (r=0.34, P<0.001) and amount consumed during feeding (r=0.28, P<0.001).
Profiles for mean methane (CH4) concentration for 36 individual cows for 6×4 h blocks of time within a 24-h day starting from 0500 h onwards during the study.

Overall, cows fed on the commercial PMR during Period 3 had lower CH4 emissions and there was no interaction between feeding period (stage of lactation) and time of day (Figure 2). This lack of change in diurnal pattern over time suggests that diet had no influence on diurnal pattern, although management of cows and timing of feed allocation remained the same throughout the study. Diet composition influences rumen fermentation and can reduce CH4 production as a result of more propionate present or less degradation of food consumed (Johnson and Johnson, Reference Johnson and Johnson1995). An inverse relationship exists between production of CH4 and concentration of propionate in the rumen, with diets containing a lower ratio of forage to concentrate reducing CH4 production (Johnson and Johnson, Reference Johnson and Johnson1995). A reduction in emissions with a lower forage proportion was seen in the current study for Period 3 when cows were fed the commercial PMR (Table 2) compared with Periods 1 and 2 when cows were fed high-forage diets. Improving the quality of food fed to a ruminant (in terms of NDF, CP and metabolisable energy content) is an effective way to get better animal performance and reduce CH4 emissions intensity (Benchaar et al., Reference Benchaar, Pomar and Chiquette2001; DeRamus et al., Reference DeRamus, Clement, Giampola and Dickison2003; Yan et al., Reference Yan, Mayne, Gordon, Porter, Agnew, Patterson, Ferris and Kilpatrick2010). In terms of nutrient content, the commercial PMR had a similar ME content to both high-forage diets but a slightly higher CP content and lower NDF content, as well as having a lower proportion of forage (Table 1).
Overall, emissions of CH4 were positively associated with total DM intake (r=0.32, P<0.01) and forage DM intake (r=0.40, P<0.001). There was no association between CH4 emissions and concentrate DM intake (total and intake in the AMS), milk yield, live weight, rumination time, number of milkings per day or frequency of eructations. Enteric CH4 emissions are positively associated with DM intake and forage intake (Mills et al., 2003; Ellis et al., Reference Ellis, Kebreab, Odongo, McBride, Okine and France2007; Bell and Eckard, Reference Bell and Eckard2012). Similar to other studies (Welch and Smith, Reference Welch and Smith1969; Kononoff and Heinrichs, Reference Kononoff and Heinrichs2003; Watt et al., Reference Watt, Clark, Krebs, Petzel, Nielsen and Utsumi2015), a positive relationship was found in the current study between feed intake and rumination time (r=0.23, P=0.07), but in contrast to other studies no association between rumination time and CH4 emissions (r=−0.09, P=0.37). Numerous factors can affect rumination time and its potential association with CH4 emissions, with the association between both traits not only being influenced by feed intake but also by animal metabolic live weight (Watt et al., Reference Watt, Clark, Krebs, Petzel, Nielsen and Utsumi2015).
In conclusion, this study found a consistent diurnal pattern to CH4 emissions over time when timing of feed allocation remained the same but diet forage content changed. Lowest CH4 emissions were recorded during the feeding period when cows were fed a diet with a lower proportion of forage, and during early morning before feed was allocated to cows. An increase in CH4 emissions was associated with an increase in forage DM intake. Along with considerable variation in mean CH4 emissions among cows, differences in diurnal patterns were observed for individual cows, which reflects differences in when animals feed and amount of feed consumed. These findings are important for CH4 monitoring techniques that involve taking measurements over short periods within a day rather than complete 24-h observations.
Acknowledgments
This work was funded by Defra, the Scottish Government, DARD, and the Welsh Government as part of the UK’s Agricultural GHG Research Platform project (www.ghgplatform.org.uk). The authors thank the farm and technical staff for their assistance with the study. The authors also thank Elizabeth Homer and Ruth Wilcox for their help in collecting the data.
Declaration of interest
The authors declare no conflicts of interest.
Ethics statement
Animal work was conducted under authority of the UK Animal (Scientific Procedures) Act 1986, and approval was obtained from the University of Nottingham animal ethics committee before commencement of the study.
Software and data repository resources
Experimental data and analysis are stored as electronic files in a designated project folder at The University of Nottingham. Access to data can be requested via the authors.