Introduction
We have witnessed a resurgence of macroevolutionary studies over the past two decades. The development of pioneering methods exploiting genealogical data (e.g., Bokma Reference Bokma2002; Blomberg et al. Reference Blomberg, Garland and Ives2003; Butler and King Reference Butler and King2004; Hunt Reference Hunt2006; O’Meara et al. Reference O’Meara, Ané, Sanderson and Wainwright2006; Hannisdal Reference Hannisdal2007; Adams and Collyer Reference Adams and Collyer2009) has allowed researchers to narrow the gap between the theoretical discussion that took place at the end of the last century (reviewed in Gould Reference Gould2002) and the empirical evidence needed to support the different stances in the debate, especially regarding the relative frequency of different macroevolutionary patterns and the processes involved (Pagel et al. Reference Pagel, Venditti and Meade2006; Hunt Reference Hunt2007; Harmon et al. Reference Harmon, Losos, Davies, Gillespie, Gittleman, Jennings, Kozak, McPeek, Moreno-Roark, Near, Purvis, Ricklefs, Schluter, Schulte, Seehausen, Sidlauskas, Torres-Carvajal, Weir and Mooers2010; Hopkins and Lidgard Reference Hopkins and Lidgard2012). Methods taking advantage of phylogenetic data to infer patterns and processes shaping the evolution of clades have been of special importance in this regard (e.g., Harmon et al. Reference Harmon, Schulte, Larson and Losos2003; Revell et al. Reference Revell, Johnson, Schulte, Kolbe and Losos2007; Sidlauskas Reference Sidlauskas2008). This in turn results from the wealth of recently generated data coming from living organisms and its potential integration with occurrences from the fossil record.
Despite comparable methodological advances, much less work is being carried out using the more traditional approach of tracking changes in morphology displayed by paleontological ancestor–descendant sequences through stratigraphic horizons. This procedure demands certain conditions that are only seldom met by fossil sequences, such as a sufficiently fine stratigraphic resolution coupled with a reliable geochronologic framework, adequate sample size, carefully measured morphology, and low taphonomic bias (Hunt Reference Hunt2008; Hannisdal Reference Hannisdal2007). Moreover, if the processes behind the patterns are to be addressed, a thorough knowledge of the biotic (e.g., ecological, ontogenetic) and abiotic (e.g., sedimentary, environmental) factors accompanying the evolution of the lineages of interest is needed, knowledge beyond the scope of many study cases and not always available. However, the strengths of this approach are evidenced by the few well-worked examples in which the ideal conditions are met (e.g., Cheetham Reference Cheetham1986; Kucera and Malmgren Reference Kucera and Malmgren1998; Hunt et al. Reference Hunt, Bell and Travis2008; Payne et al. Reference Payne, Groves, Jost, Nguyen, Moffitt, Tessa and Skotheim2012). Importantly, it offers the opportunity to analyze directly (rather than infer) the anagenetic patterns of change shown by the studied lineages and to assess and discuss possible causes in an appropriate temporal and historical context. Overall, this remains the most direct way to study the evolutionary dynamics displayed by organisms over the course of millions of years, providing important insights into how organisms evolve in higher natural (e.g., temporal, geographical, taxonomic) scales.
The Neuquén Basin, located in the west-central region of Argentina, possesses one of the best Lower Cretaceous marine records of the Southern Hemisphere in terms of fossil abundance and stratigraphic completeness (Howell et al. Reference Howell, Schwarz, Spalletti and Veiga2005; Aguirre-Urreta et al. Reference Aguirre-Urreta, Price, Ruffell, Lazo, Kalin, Ogle and Rawson2008). During that interval the region formed a back-arc basin flanked on its western margin by a volcanic island arc and flooded by the Pacific Ocean, forming a large, triangular marine embayment (Aguirre-Urreta et al. Reference Aguirre-Urreta, Price, Ruffell, Lazo, Kalin, Ogle and Rawson2008; Lazo et al. Reference Lazo, Aguirre-Urreta, Price, Rawson, Ruffell and Ogle2008). Its depositional environment has been reconstructed as an open-marine, low-gradient ramp covered by a shallow sea, subject to moderate to strong fluctuations of relative sea level controlled by a combination of eustasy and local tectonics (Legarreta and Gulisano Reference Legarreta and Gulisano1989; Lazo et al. Reference Lazo, Aguirre-Urreta, Price, Rawson, Ruffell and Ogle2008; Guler et al. Reference Guler, Lazo, Pazos, Borel, Ottone, Tyson, Cesaretti and Aguirre-Urreta2013). The Agrio Formation, of lower/upper Valanginian to lowest Barremian age, can be divided into three subordinate units. The Pilmatué (lower/upper Valanginian–lower Hauterivian) and Agua de la Mula (upper Hauterivian–lowest Barremian) Members are represented by highly cyclic and fossiliferous shallow-marine deposits and are separated by the continental sandstones representing the Avilé Member, deposited during a short episode of marked sea-level fall in which most of the basin was emergent. The Agrio Formation has been the focus of exhaustive paleontological, sedimentological, and stratigraphic research (e.g., Legarreta and Gulisano Reference Legarreta and Gulisano1989; Spalletti et al. Reference Spalletti, Poiré, Schwarz and Veiga2001; Lazo Reference Lazo2006, Reference Lazo2007a; Aguirre-Urreta et al. Reference Aguirre-Urreta, Price, Ruffell, Lazo, Kalin, Ogle and Rawson2008, Reference Aguirre-Urreta, Lazo, Griffin, Vennari, Parras, Cataldo, Garberoglio and Luci2011; Archuby et al. Reference Archuby, Wilmsen and Leanza2011; Pazos et al. Reference Pazos, Lazo, Tunik, Marsicano, Fernandez and Aguirre-Urreta2012; Guler et al. Reference Guler, Lazo, Pazos, Borel, Ottone, Tyson, Cesaretti and Aguirre-Urreta2013), something that has allowed the reconstruction of its paleoenvironmental and paleoecological history, as well as the development of high-resolution ammonoid-based biostratigraphic schemes and their correlations to the Tethys region (Aguirre-Urreta et al. Reference Aguirre-Urreta, Mourgues, Rawson, Bulot and Jaillard2007; Aguirre-Urreta and Rawson Reference Aguirre-Urreta and Rawson2012).
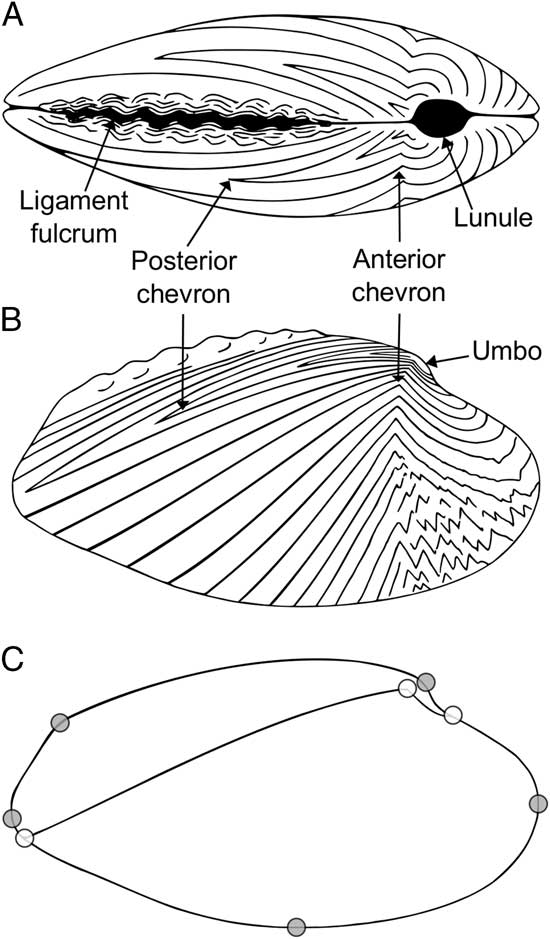
The highly fossiliferous marine deposits of the Agrio Formation contain a rich fauna of benthic invertebrates in which bivalves are especially abundant. Prominent among them is the genus Ptychomya Agassiz (Veneroida: Astartidae), an extinct taxon of shallow-burrowing bivalves with a lower Valanginian to lowest Barremian local range (Milla Carmona et al. Reference Milla Carmona, Lazo and Soto2017). Ptychomya possesses a medium-sized (up to 8–10 cm in length, approximately), anteroposteriorly elongated shell, the anterior portion of which is short and rounded, whereas the posterior portion is about four times longer and exhibits a row of crenulations at each side of the opisthodetic ligament. The divaricate ornamentation is strikingly complex, with three series of ribs (one subcommarginal anterior and two subradial posterior) converging to form a series of compound ribs. The convergence of ribs defines, in turn, two series of chevrons. The first is defined by the convergence of the commarginal anterior and the long, subradial ventral posterior ribs, marking the limit between the anterior and posterior portions of the shell. The second is formed by the convergence of the long, subradial posterior ventral ribs with the subradial, shorter and slightly lower angled posterior dorsal ribs, running from the umbo toward the posterior ventral margin of the shell (Fig. 1). This eye-catching external morphology shows a comparably complex pattern of variation throughout the Agrio Formation. However, although informally observed and acknowledged by researchers for over a century, the patterns of morphological change in Ptychomya have not been comprehensively assessed or even described.
Schematic representation of Ptychomya, showing (A) dorsal and (B) left lateral views, as well as (C) the traits measured through geometric morphometrics. White circles indicate the position of the landmarks used for superimposition of the open curves measuring the shape of the reference pair of ribs (ribbing pattern), whereas gray circles indicate the position of the landmarks used for reconstruction and measurement of the full size of the shell. Modified from Milla Carmona et al. (Reference Milla Carmona, Lazo and Soto2017).

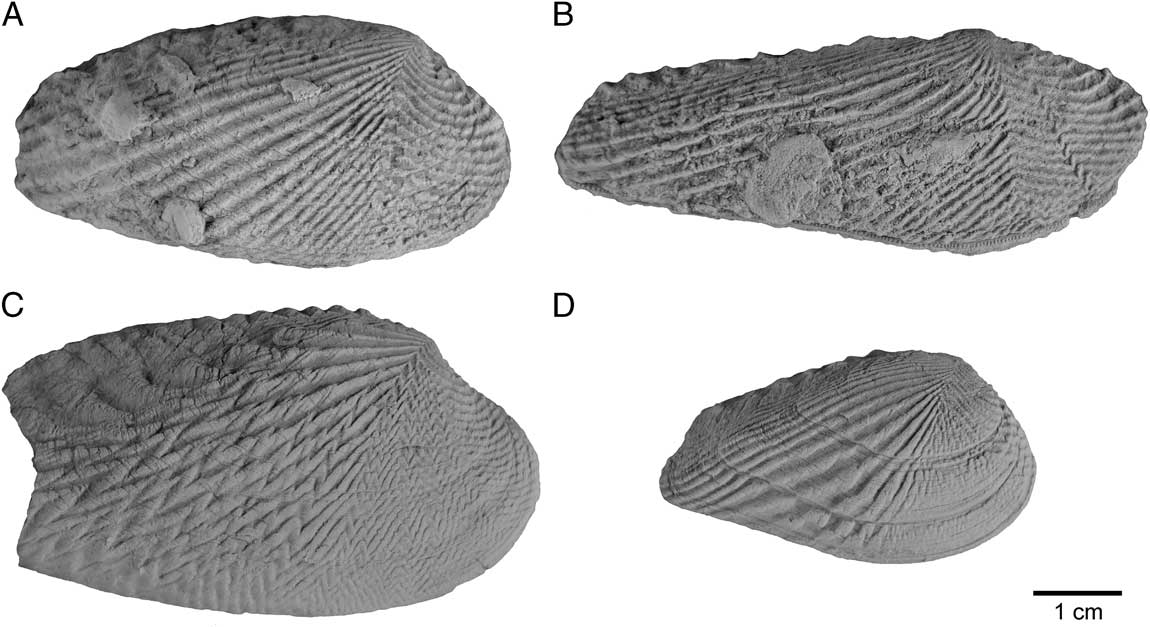
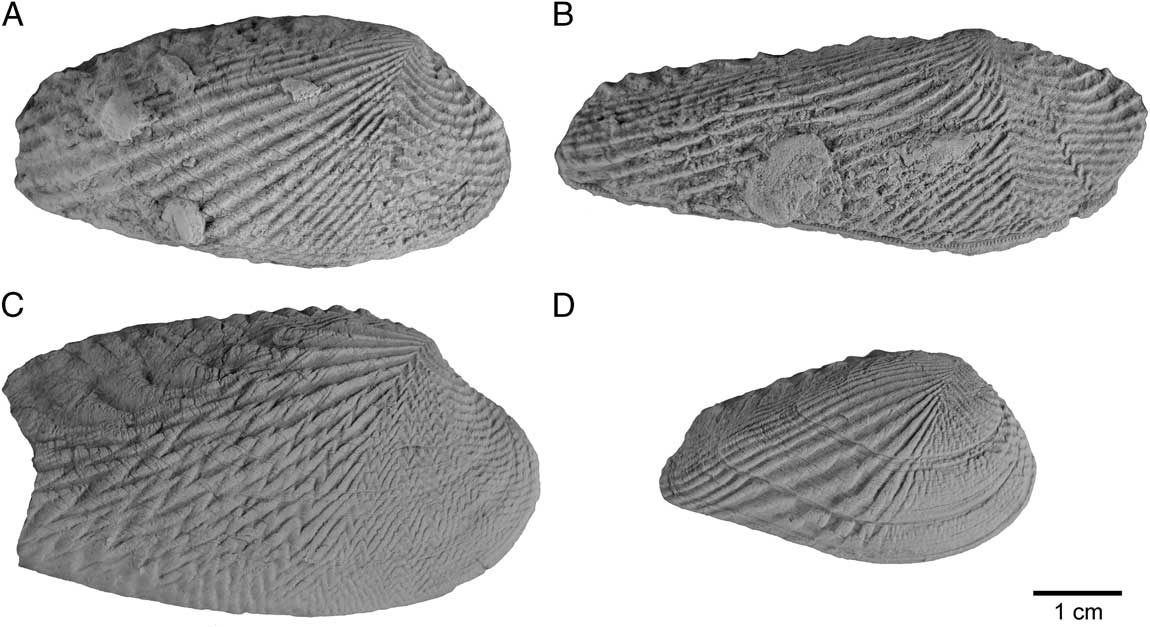
Recently, much of the morphological variation was inferred to be of an interspecific nature, and the formerly monotypic genus was divided into four species: P. koeneni (lower Valanginian–upper Hauterivian, Fig. 2A), P. esbelta (upper Valanginian–lower Hauterivian, Fig. 2B), P. coihuicoensis (upper Hauterivian–lowest Barremian, Fig. 2C), and P. windhauseni (upper Hauterivian–lowest Barremian, Fig. 2D) (Milla Carmona et al. Reference Milla Carmona, Lazo and Soto2016, Reference Milla Carmona, Lazo and Soto2017). Although phylogenetic relationships among these four species have not been addressed yet, their well-framed stratigraphic occurrences suggest that P. koeneni constitutes the ancestral species from which the rest diverged at different times during the local history of the genus. The four species are abundant at various stratigraphic levels throughout the Agrio Formation, sometimes co-occurring. These properties, together with the well-studied depositional history of the Agrio Formation, configure an excellent opportunity for the study of macroevolutionary dynamics in deep time. Despite these advances, a question remains unanswered: How did Ptychomya evolve in the geographic and stratigraphic setting of the Neuquén Basin, and what were the evolutionary drivers involved?
The four Ptychomya species addressed in this work. (A) Ptychomya koeneni (CPBA-23578.2), (B) Ptychomya esbelta (CPBA-23575.1), (C) Ptychomya coihuicoensis (CPBA-23601.1), and (D) Ptychomya windhauseni (CPBA-23597.3).
We study here the anagenetic patterns of evolution displayed by the four species of Ptychomya mentioned earlier through the stratigraphic levels of the Agrio Formation using paleontological time-series analysis and change tracking. As recent compilations have shown, the different phenotypic aspects of lineages tend to evolve decoupled from each other (i.e., mosaic evolution). Thus, the analysis of single traits does not guarantee comprehensive reconstruction of the history of morphological change of a lineage (Hopkins and Lidgard Reference Hopkins and Lidgard2012; Hunt et al. Reference Hunt, Hopkins and Lidgard2015), something that may be especially true for the case of the complex pattern of evolution exhibited by Ptychomya. To address this issue, we measure shell size as well as two conspicuous shape traits from the external morphology of the valves (shell outline and ribbing pattern) using geometric morphometrics. We then discuss (1) how patterns shown by the individual species lineages in different aspects of their morphology interact to give shape to the local evolution and diversification of the genus, (2) which biotic and/or abiotic factors could have driven the evolution of this group in the studied geographic and stratigraphic setting, and (3) how these findings fit into our present knowledge of macroevolutionary phenomena.
Materials and Methods
Materials
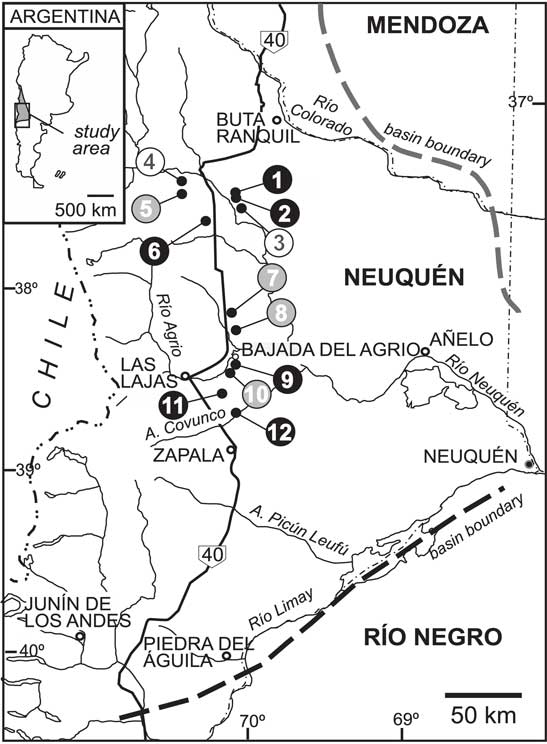
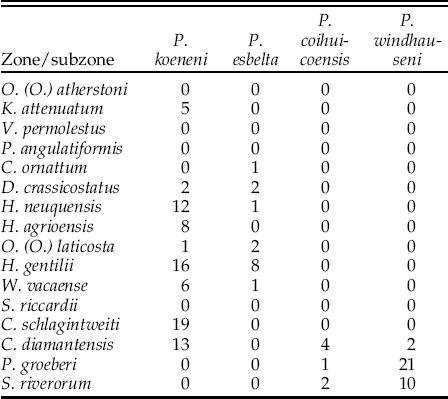
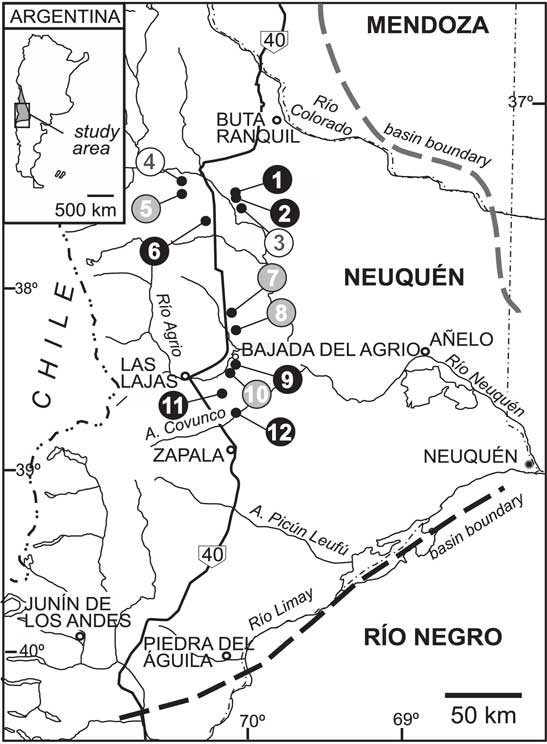
All the studied material is housed in the Paleontological Collection of the University of Buenos Aires (CPBA) and comes from the Agua de la Mula, Bajada Vieja, Arroyo Truquicó, El Salado, Bajada del Agrio, Cerro Bayo, Arroyo Covunco, Gasoducto, Curaco Sur, and Pichaihue localities (Fig. 3). To guarantee a correct measurement of the size and shape of the shell, the material was carefully selected from a survey of several hundred (>1000) specimens, reducing the sample size to the 141 best-preserved ones. Each specimen was classified as belonging to P. koeneni, P. esbelta, P. coihuicoensis, or P. windhauseni based on their diagnostic characters (Milla Carmona et al. Reference Milla Carmona, Lazo and Soto2017) and photographed in left lateral view using a Canon PowerShot SX610 HS camera fixed on a tripod. The number of specimens of each species from each zone/subzone selected is shown in Table 1.
Map of the Neuquén Basin showing the localities sampled for specimens (black), successions (white), or both (gray). (1) Gasoducto (37°25′S, 69°26′W), (2) Curaco Sur (37°35′S, 70°00′W), (3) Mina San Eduardo (37°32′S, 70°00′W), (4) Cerro Caicayén (37°26′S, 70°24′W), (5) Arroyo Truquicó (37°28′S, 70°17′W), (6) Pichaihue (37°46′S, 70°13′W), (7) Agua de la Mula (38°03′S, 70°03′W), (8) El Salado (38°12′S, 70°03′W), (9) Bajada del Agrio (38°25′S, 70°00′W), (10) Bajada Vieja (38°25′S, 70°02′W), (11) Cerro Bayo (38°41′S, 70°04′W), and (12) Arroyo Covunco (38°42′S, 69°59′W). Modified from Milla Carmona et al. (Reference Milla Carmona, Lazo and Soto2017).
Number of specimens of each species per zone or subzone selected for morphometric and time-series analyses.

Temporal Framework
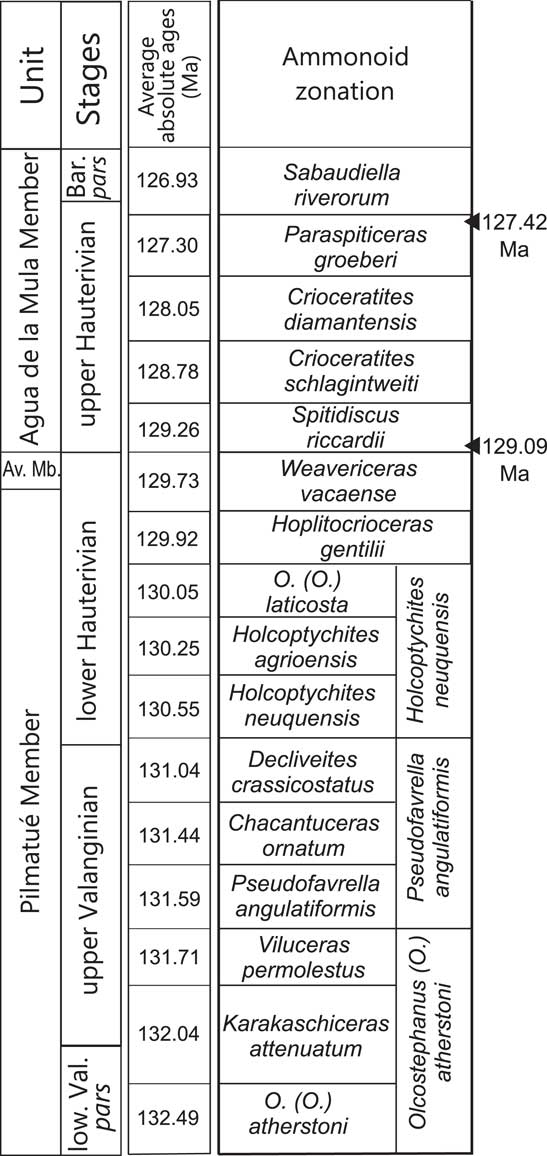
We use the ammonoid-based biostratigraphic schemes developed by Aguirre-Urreta et al. (Reference Aguirre-Urreta, Mourgues, Rawson, Bulot and Jaillard2007) and Aguirre-Urreta and Rawson (Reference Aguirre-Urreta and Rawson2012), who identify 10 ammonoid zones and 8 subzones for the Agrio Formation, dividing the column into a total of 15 consecutive biostratigraphic units, from which Ptychomya is recorded in 12. These zones/subzones can be correlated across the studied localities, providing a common temporal framework to work with (Fig. 4).
Temporal framework adopted for this study, showing the ammonoid zones or subzones used in this work (Aguirre-Urreta et al. Reference Aguirre-Urreta, Mourgues, Rawson, Bulot and Jaillard2007; Aguirre-Urreta and Rawson Reference Aguirre-Urreta and Rawson2012), the relative position and inferred absolute age of the tuff layers dated by Aguirre-Urreta et al. (Reference Aguirre-Urreta, Lescano, Schmitz, Tunik, Concheyro, Rawson and Ramos2015), and the approximate age calculated for each biostratigraphic unit. Abbreviations: Av. Mb., Avilé Member; Low. Val., lower Valanginian; Bar., Barremian.
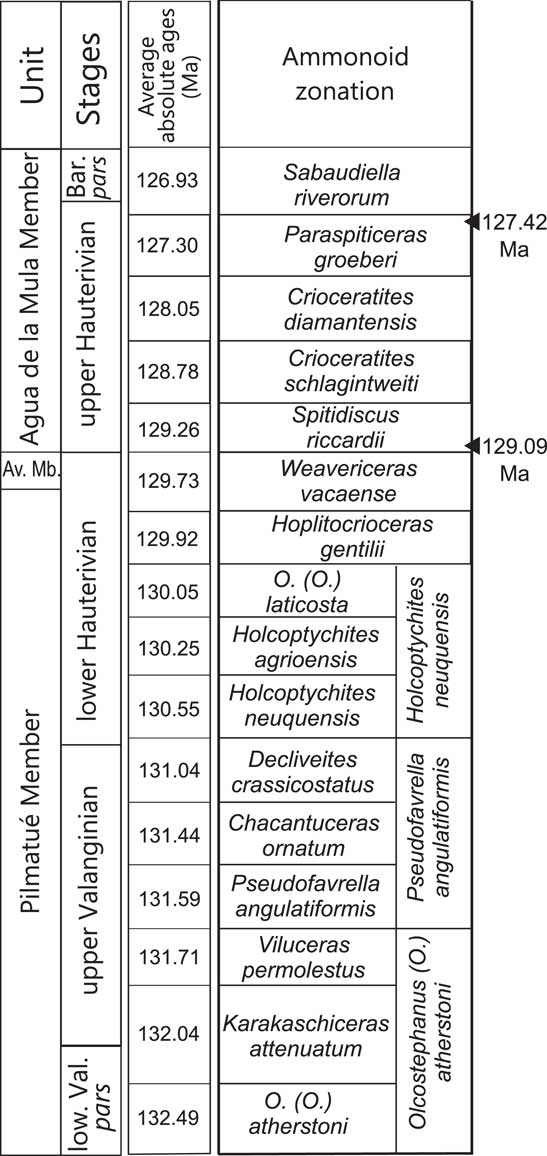
Recently, Aguirre-Urreta et al. (Reference Aguirre-Urreta, Lescano, Schmitz, Tunik, Concheyro, Rawson and Ramos2015) provided U–Pb zircon radioisotopic ages for two tuff layers occurring at the base (base of the S. riccardii Zone, upper Hauterivian; ca. 129.09 Ma) and the top (top of the P. groeberi Zone, upper Hauterivian; ca. 127.42 Ma) of the Agua de la Mula Member (Fig. 4). To provide a temporal axis for subsequent time-series analyses, the thickness of each ammonoid zone/subzone is taken from data published by Lazo and Luci (Reference Lazo and Luci2013) for Cerro Caicayén and Pichaihue; Guler et al. (Reference Guler, Lazo, Pazos, Borel, Ottone, Tyson, Cesaretti and Aguirre-Urreta2013) for Bajada Vieja; Aguirre-Urreta et al. (Reference Aguirre-Urreta, Price, Ruffell, Lazo, Kalin, Ogle and Rawson2008) for Agua de la Mula; Cataldo and Lazo (Reference Cataldo and Lazo2016) for El Salado; and Aguirre-Urreta and Rawson (Reference Aguirre-Urreta and Rawson2012) for Mina San Eduardo. These sections correspond to expanded sedimentary successions, without significant hiatuses or interruptions in between, allowing estimation of the maximum thickness of each zone/subzone and thus intuitively reasonable estimations of maximum durations. The summed thicknesses of the zones from the Agua de la Mula Member and the precise absolute ages from Aguirre-Urreta et al. (Reference Aguirre-Urreta, Lescano, Schmitz, Tunik, Concheyro, Rawson and Ramos2015) are then used to estimate an average sedimentation rate, which in turn is used together with the maximum thicknesses of all the zones/subzones from Agrio Formation to calculate their maximum durations. We use these durations to calculate approximate average ages for each zone/subzone (Fig. 4). The continental Avilé Member is considered here as included in the time interval covered by the W. vacaense Zone, despite encompassing a hiatus at its base (which has been interpreted as a major sequence boundary; see Veiga et al. Reference Veiga, Spalletti and Flint2002). Although this implies an underestimation of the duration of the W. vacaense Zone and of the ages of zones/subzones from the Pilmatué Member, such bias is not expected to be severe or to affect the overall results from subsequent analyses.
Morphometrics
Two prominent external features of the shell, its outline and ribbing pattern, are quantified using geometric morphometric methods. The shell-outline shape of 137 specimens is quantified as a closed contour by means of a 2D elliptic Fourier analysis (Kuhl and Giardina Reference Kuhl and Giardina1982) using seven harmonics (Fig. 1C). Whenever the margin of the shell is chipped, the outline defined by an ontogenetically younger growth line of the same specimen is used instead. Ribbing pattern is a more complex trait to address. To produce a comparable measurement, the single posterior rib reaching the posterior ventral end of the shell and the anterior rib converging with it are selected as a reference and digitized as a series of 1000 (x, y) equally spaced coordinates (Fig. 1C). The shape of this reference pair of ribs is then quantified as an open contour through a 2D “extended coordinate analysis” (Milla Carmona et al. Reference Milla Carmona, Lazo and Soto2017): placement of three landmarks subdivides the curve (Fig. 1C) into two segments representing the commarginal anterior and subradial posterior ribs, each of which is standardized to an optimum (i.e., the lowest number of coordinates encompassing 99% of the perimeter of each segment for the most complex shape in the sample), constant number of (x, y) coordinates (105 and 300, respectively) following MacLeod (Reference MacLeod1999), and then aligned through Procrustes superimposition (Gower Reference Gower1975; Rohlf and Slice Reference Rohlf. and Slice1990). These coordinates are not allowed to slide, because the sliding process severely distorts the intricate shape of the ribs of Ptychomya (see Supplementary Fig. 1), a problem that has been acknowledged and discussed elsewhere (MacLeod Reference MacLeod2013). In both shell-outline and ribbing-pattern analyses, a principal component analysis is performed on the resulting shape descriptors (Fourier coefficients and superimposed coordinates, respectively). The first principal component resulting from the analysis of each trait is retained (from here onward, shell-outline and ribbing-pattern variables). Both shell-outline and ribbing-pattern variables are corrected for allometric variation by obtaining the residuals of a linear regression against size. For further details on the geometric morphometrics procedures undertaken, see Milla Carmona et al. (Reference Milla Carmona, Lazo and Soto2017).
For shell size measurement, only gerontic specimens (Álvarez and Pérez Reference Álvarez and Pérez2016) are used. When a specimen reaches this ontogenetic stage, it slows down its growth along the sagittal plane (i.e., length and height) and accelerates its growth along the transverse axis (i.e., width). As a result, incremental growth lines (recognized using magnifying glasses) start to accumulate near the ventral margin, and the shell becomes more globose. Five landmarks are placed on the outlines of these specimens in lateral view, marking (1) the umbo, (2) the transition between dorsal and posterior margins, (3) the transition between posterior and ventral margins, (4) the point of maximum convexity of the ventral margin, and (5) the tip of the anterior margin (Fig. 1C). Unlike analysis of shell-outline shape, analysis of shell size requires using the full size of gerontic specimens. To do so, the position of landmarks in chipped sections of the margin is reconstructed using an iterative procedure, as follows. First, the position of the missing landmark(s) for a given specimen is estimated visually. Second, a reference configuration is constructed by placing the same five landmarks on the shell-outline averaged from the specimens of the same species and zone/subzone. Third, Procrustes superimposition is performed to align the landmark configurations of the specimen and the reference. Fourth, the visually estimated (x, y) positions are averaged with the (x, y) positions of the corresponding landmarks from the reference configuration. Fifth, the visually estimated (x, y) positions are replaced by the averaged (x, y) ones. This procedure is repeated (using the averaged [x, y] coordinates instead of the visually estimated ones) until the Procrustes distance between the two configurations reduces to 1%. The ratio between the area of the initial and final polygons was used as a factor to correct the centroid size calculated from the initial configuration of landmarks, which in turn is used as the proxy for shell size.
The shell-outline, ribbing-pattern, and shell size variables are standardized (i.e., z-transformed to zero mean and unit variance) to facilitate comparison. All the morphometric procedures described are performed in the R environment (R Core Team 2016) using the ‘R Base,’ ‘geomorph’ (Version 3.0.1; Adams and Otárola-Castillo Reference Adams and Otárola-Castillo2013), and ‘Momocs’ (Version 1.1.0; Bonhomme et al. Reference Bonhomme, Picq, Gaucherel and Claude2014) packages, with the exception of the digitization of the coordinates for ribbing-pattern analysis, which is carried out using tpsDig (Version 2.26; Rohlf Reference Rohlf2016).
Paleontological Time-Series Analysis
Variation of morphology through time is assessed using the framework developed by Hunt (Reference Hunt2006, Reference Hunt2008) for paleontological time-series analysis. In this approach, variation in mean morphology shown by a lineage through successive temporal levels is fit to different statistical models within a likelihood framework. Each statistical model constitutes the formalization of a classic, descriptive evolutionary pattern or model. The different models are compared by means of standard model-selection tools (typically, through the sample size–corrected Akaike information criterion [AICc] scores and derived Akaike weights), and the model that achieves the best balance between number of parameters and explanatory power is then selected as the preferred model of evolution. Paleontological time-series analyses are performed in the R environment using the package ‘paleoTS’ (Version 0.5.1; Hunt Reference Hunt2015).
We evaluate the fit of shell outline, ribbing pattern, and shell size of individual species and the genus as a whole to four basic models of evolution: general random walk (GRW), unbiased random walk (URW), stasis, and strict stasis. GRW and URW can be broadly described as directional and random evolution, respectively, whereas under stasis, morphology remains stable, showing no net evolutionary change. Strict stasis is a particular version of stasis in which morphology remains invariant through time. These simple models of evolution are not intended to be exact representations of the observed evolutionary modes. Rather, they constitute useful abstractions that allow the general characterization of the evolutionary dynamics shown by the studied lineages (Hunt Reference Hunt2007). Although more complex models are available, these four general models of evolution are an adequate choice for the analysis of sequences with a low number of temporal levels (Hunt et al. Reference Hunt, Hopkins and Lidgard2015), such as the present case (between 5 and 12 temporal levels). All models are fit using the joint parameterization (Hunt Reference Hunt2008).
Our data set presents two potentially serious problems regarding sample size, affecting inferences at different analytical levels. First, some combinations of species and zones/subzones (i.e., temporally restricted populations) present a very low number of specimens, some even at the extreme of being represented by a single individual (see Table 1). Low sample size at the population level casts doubts on the representativeness of the sample and can result in imprecise estimates of mean trait values. This is not so much a problem of lack of fossils as of preservation: the bulk of the sample was discarded for being laterally crushed, fragmented, or externally altered. We decided to include populations with a sample size of one or two specimens as long as they were reasonably representative of the morphology of the other conspecific, contemporaneous discarded specimens. Morphological variances for these “populations” are calculated by averaging the variance from specimen-rich populations from the same species lineage. The second problem is a low number of temporal steps. As paleontological time-series analysis use the mean trait value of successive levels from a stratigraphic sequence, the number of temporal steps in which a studied lineage is recorded effectively constitutes its sample size. For this reason, only lineages represented in at least five temporal steps were analyzed (G. Hunt personal communication 2017). Hence, the species restricted to the Agua de la Mula Member (P. coihuicoensis and P. windhauseni), whose stratigraphic distributions span only three ammonoid zones, are not included in paleontological time-series analysis. Ribbing pattern and shell size of P. esbelta are not analyzed either, as these traits are measured in specimens from only four zones/subzones. However, since these species represent an important part of the evolutionary history of Ptychomya in the Agrio Formation in terms of stratigraphic representativeness, taxonomic diversity, and morphological variation, their patterns of change through time are still addressed descriptively in the “Results” section.
Disparity Analysis
The shape disparity shown by the genus (not individual species) through time is addressed using variance as a proxy: variances of shell-outline and ribbing-pattern variables are calculated from pooled specimens from the Pilmatué and the Agua de la Mula Members. Significant differences in disparity are tested by constructing bootstrap (1000 permutations) 95% confidence intervals and assessing their degree of overlap. Disparity analysis is performed in the R environment.
Accompanying Biotic and Abiotic Factors
To explore the possible association between biotic and abiotic factors and morphological evolution of Ptychomya, two additional sources of data are compiled: (1) the oxygen (δ18O) and carbon (δ13C) isotopic curves published by Aguirre-Urreta et al. (Reference Aguirre-Urreta, Price, Ruffell, Lazo, Kalin, Ogle and Rawson2008), and (2) the number of genera present in the associated bivalve fauna, taken from field observations and collection (CPBA) occurrences. Only genera interpreted as belonging to the same paleoecological guild of Ptychomya (i.e., shallow burrowers; Lazo Reference Lazo2007b) are counted. Data from the same zone/subzone are pooled together and averaged for integration into the same geochronologic scale used for the rest of the procedures undertaken. The resulting isotopic and paleodiversity curves are used as proxies for environmental stability and ecospace availability, respectively. These curves are then discussed and interpreted in the light of the published literature to explore potential processes driving the evolution of Ptychomya. Correlation between the two isotopic curves is examined by calculating the Pearson’s correlation between the lagged differences (i.e., the vector of differences between values of consecutive zones/subzones) for the values of each isotope.
Results
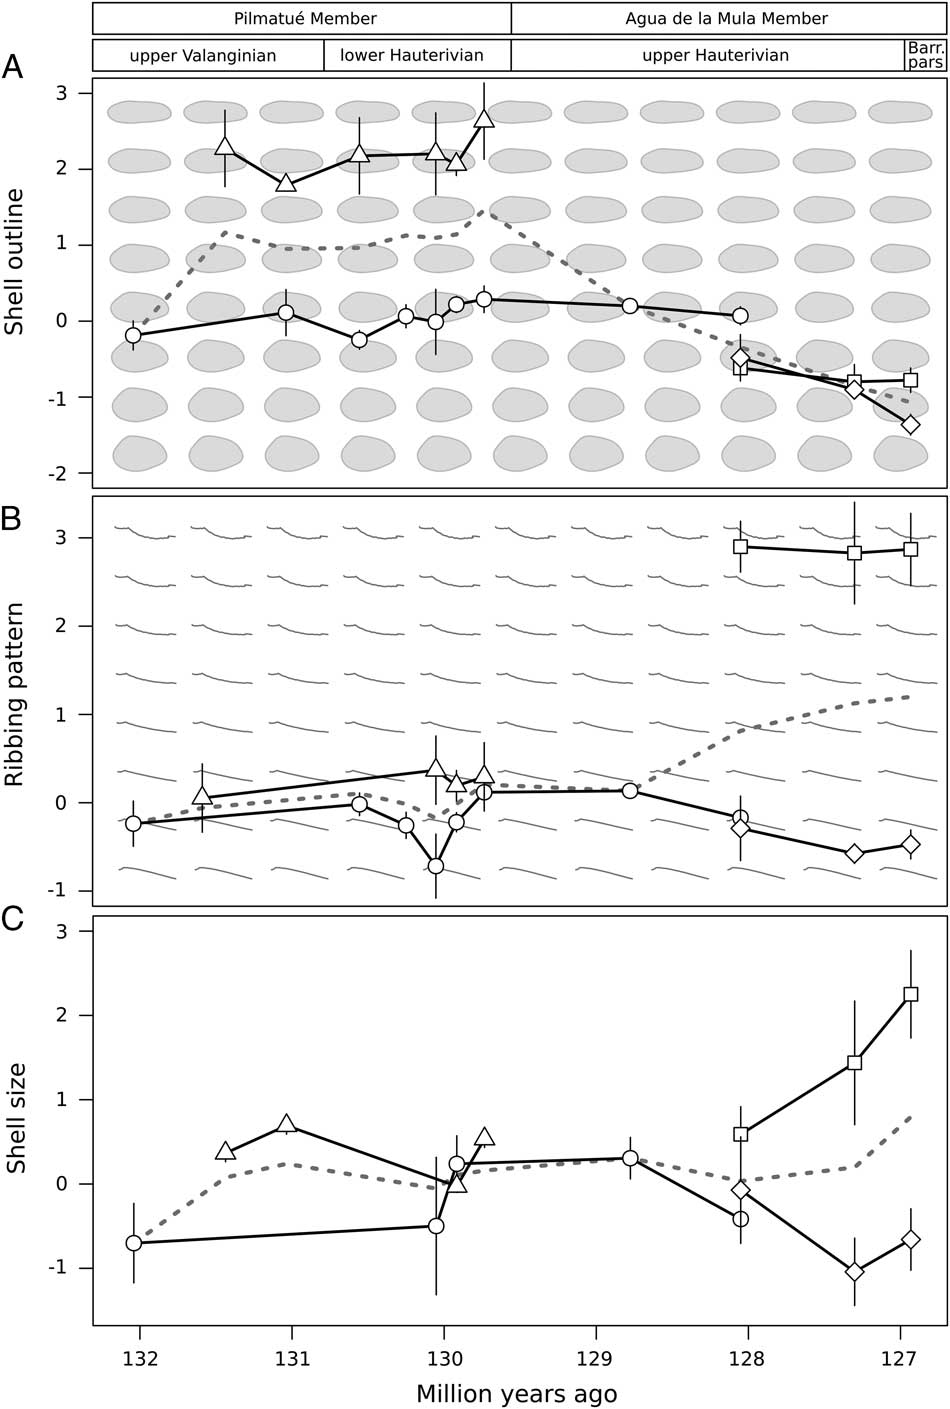
The shell-outline variable constructed captures differences in the overall geometry of the shell corresponding to 89% of the total shell-outline shape variation. Higher scores represent elongated, subrectangular to suboval outlines with convex posterior ventral margins, whereas lower scores represent relatively shorter and higher shells with subtrapezoidal geometry and concave-downward posterior ventral margins (see shape-change vector from the vertical axis of Fig. 5A). The ribbing-pattern variable captures variation in the curvature and zigzagging of the reference pair of ribs, accounting for 71% of the total ribbing-pattern shape variation. Higher scores represent markedly concave-upward anterior and posterior ribs exhibiting marked zigzagging, whereas negative values represent slightly convex-upward posterior ribs and nearly straight, poorly developed anterior ribs (see shape-change vector from the vertical axis of Fig. 5B).
Morphological evolution of Ptychomya. (A) Mean shell-outline shape evolution. (B) Mean ribbing-pattern shape evolution. (C) Mean shell size evolution. Dashed line, Ptychomya; circles, P. koeneni; triangles, P. esbelta; squares, P. coihuicoensis; diamonds, P. windhauseni. The shapes in the background of plots A and B vary only in the vertical axis and were generated by sampling the shell-outline and ribbing-pattern variables at regular intervals and then premultiplying these scores by the inverse of the eigenvector matrix resulting from the PCA used to obtain each variable (see MacLeod Reference MacLeod2009). These shapes, as well as the vertical axis scale of each plot, are expressed in the standard deviations of the corresponding variable. Bars are standard errors. Abbreviation: Barr., Barremian.

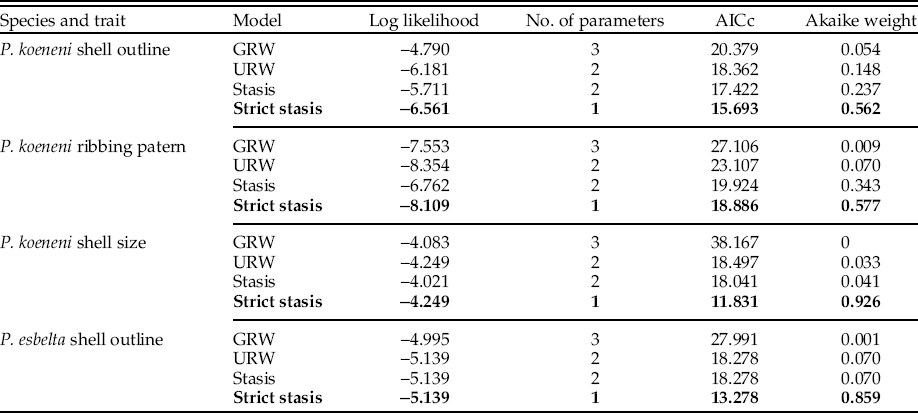
Results of paleontological time-series analyses are summarized in Tables 2 and 3. Change through time in mean trait values of the four species of Ptychomya and the genus as a whole is depicted in Figure 5. For the older pair of species (P. koeneni and P. esbelta), strict stasis is the best-supported model for all traits measured. Although shell outline and ribbing pattern of P. koeneni show no great support for this model (Akaike weight of the best-supported model is less than 2.7 times the weight of the next best-supported model; Hopkins and Lidgard Reference Hopkins and Lidgard2012), the second best-supported model is stasis in both cases (Table 2). Ribbing pattern and shell size of P. esbelta seem to fluctuate around stable values, although the latter trait shows relatively wider fluctuations (Fig. 5B,C). Ptychomya esbelta shows a larger and more elongated shell than P. koeneni (Fig. 5A,C). Both species possess a very similar ribbing pattern, although P. esbelta shows slightly straighter to mildly concave-upward posterior ribs. On the other hand, although the younger pair of species (P. coihuicoensis and P. windhauseni) exhibit stable values for four of the six measured traits, each species seem to present at least one variable evolving under a directional regime. Mean shell-outline shape of P. windhauseni shows a negative trend through time, attaining a very characteristic high, short, and posteroventrally projected shell-outline shape (Fig. 5A), while also being the smaller species of the cluster on average (Fig. 5C). Unlike this species’ characteristic shell-outline shape and size, its ribbing pattern is almost identical to that of its putative ancestral species, P. koeneni (Fig. 5B). On the other hand, P. coihuicoensis shows an increasingly larger shell, quickly becoming the largest species of the cluster (Fig. 5C). Like P. windhauseni, P. coihuicoensis possesses relatively higher shells than its predecessors, although this trait remains stable at less extreme values during its evolutionary history (Fig. 5A). However, the trait that really distinguishes P. coihuicoensis (a ribbing pattern with relatively well-developed anterior ribs and markedly concave-upward, zigzagging posterior and anterior ribs) shows no sign of net change (Fig. 5B).
Results from time-series analyses for traits measured at the species level. Bold indicates the best-supported evolutionary model for each case. Abbreviations: AICc, sample size–corrected Akaike information criterion score; GRW, general random walk; URW, unbiased random walk.

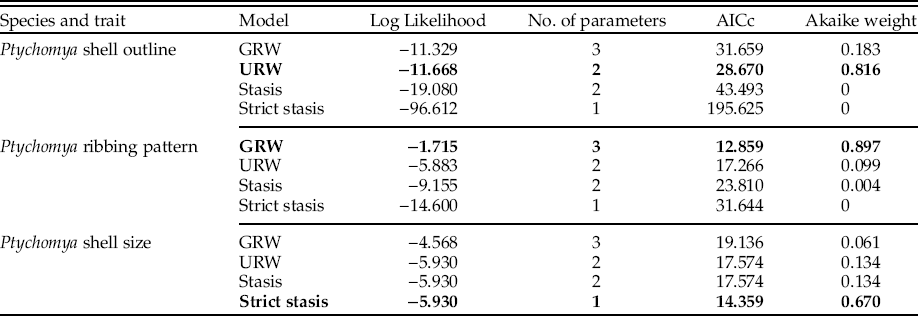
Results from time-series analyses for traits measured at the genus level. Bold indicates the best-supported evolutionary model for each case. Abbreviations: AICc, sample size–corrected Akaike information criterion score; GRW, general random walk; URW, unbiased random walk.

The average morphology inferred for the genus shows an increase in mean shell-outline score and shell size at the C. ornatum Subzone (mid-upper Valanginian) related to the first occurrence of the larger and slenderer shell outline of P. esbelta. From that point until the top of the Pilmatué Member, at the W. vacaense Zone (uppermost lower Hauterivian), the mean shell-outline score and shell size of the genus remain stable. In the same interval, the mean ribbing-pattern score fluctuates but remains relatively constant around forms with poorly developed anterior ribs and straight posterior ribs with no zigzag arrangement. This pattern extends beyond the Pilmatué Member, until the C. schlagintweiti Zone (mid-upper Hauterivian). Therefore, the mean ribbing-pattern shape of the genus remains mostly unaffected by the appearance and subsequent extinction of P. esbelta.
During the upper Hauterivian–lowest Barremian interval, Ptychomya exhibits a different trend. At the base of the Agua de la Mula Member (lowermost upper Hauterivian) the mean shell-outline score of the genus drops, this time due to the extinction of P. esbelta. Shortly after, at the C. diamantensis Zone (mid-upper Hauterivian), the first occurrence of the relatively shorter and higher shells of P. coihuicoensis and P. windhauseni further decrease the mean shell-outline score of the genus. The extinction of the subrectangularly shaped P. koeneni (last occurring at the C. diamantensis Zone) and the directional anagenetic pattern of evolution displayed by P. windhauseni extend this trend until the last record of the genus in the Agrio Formation at the S. riverorum Zone (lowest Barremian). Simultaneously, the mean shell size of the genus remains stable at values similar to those observed at the top of the Pilmatué Member, showing only a slight final increment produced by the large shell size attained by P. coihuicoensis at the S. riverorum Zone. On the other hand, the mean ribbing-pattern score of the genus increases during the C. diamatensis and P. groeberi Zones due to the appearance of the highly disparate ribbing pattern of P. coihuicoensis and the extinction of P. koeneni.
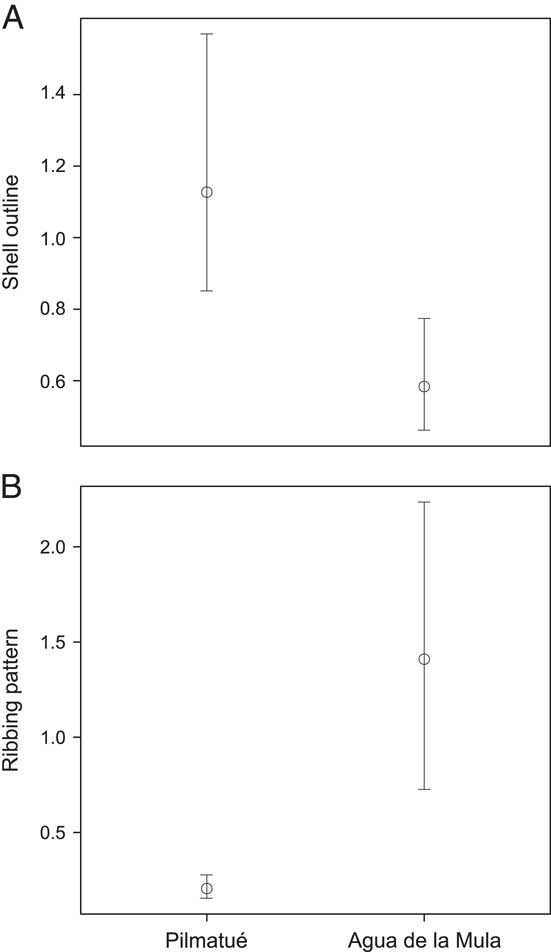
The mean morphology of the genus in this geographic and stratigraphic setting is found to be evolving under a mix of evolutionary patterns (Table 3, Fig. 5). Whereas shell size exhibits strict stasis, shell-outline evolution is random: evolutionary change does occur, but shows no consistent direction. Ribbing pattern, on the other hand, shows a directional trend toward higher scores (i.e., more developed anterior ribs and concave-upward, zigzagging posterior ribs and) from the base to the top of the Agrio Formation. All three models are strongly supported (Table 3). Shell outline displays high disparity during the lower/upper Valanginian–lower Hauterivian interval, as expected given the disparate shell-outline shapes of P. koeneni and P. esbelta. However, it is significantly reduced in the upper Hauterivian–lowest Barremian, never recovering, despite the comparable number of species and the mixture of anagenetic patterns shown by P. coihuicoensis and P. windhauseni for this trait (Fig. 6A). Ribbing-pattern disparity shows the opposite pattern: low values during the lower/upper Valanginian–lower Hauterivian and a marked increase for the upper Hauterivian–lowest Barremian, mainly due to the appearance of the highly disparate ribbing pattern of P. coihuicoensis (Fig. 6B).
Comparison between morphological disparity shown by Ptychomya in the Pilmatué Member vs. the Agua de la Mula Member. (A) Shell-outline disparity. (B) Ribbing-pattern disparity. The vertical scale of each plot is expressed in the standard deviations of the corresponding variable. Bars represent 95% bootstrap confidence intervals for the disparity of each trait in each unit.

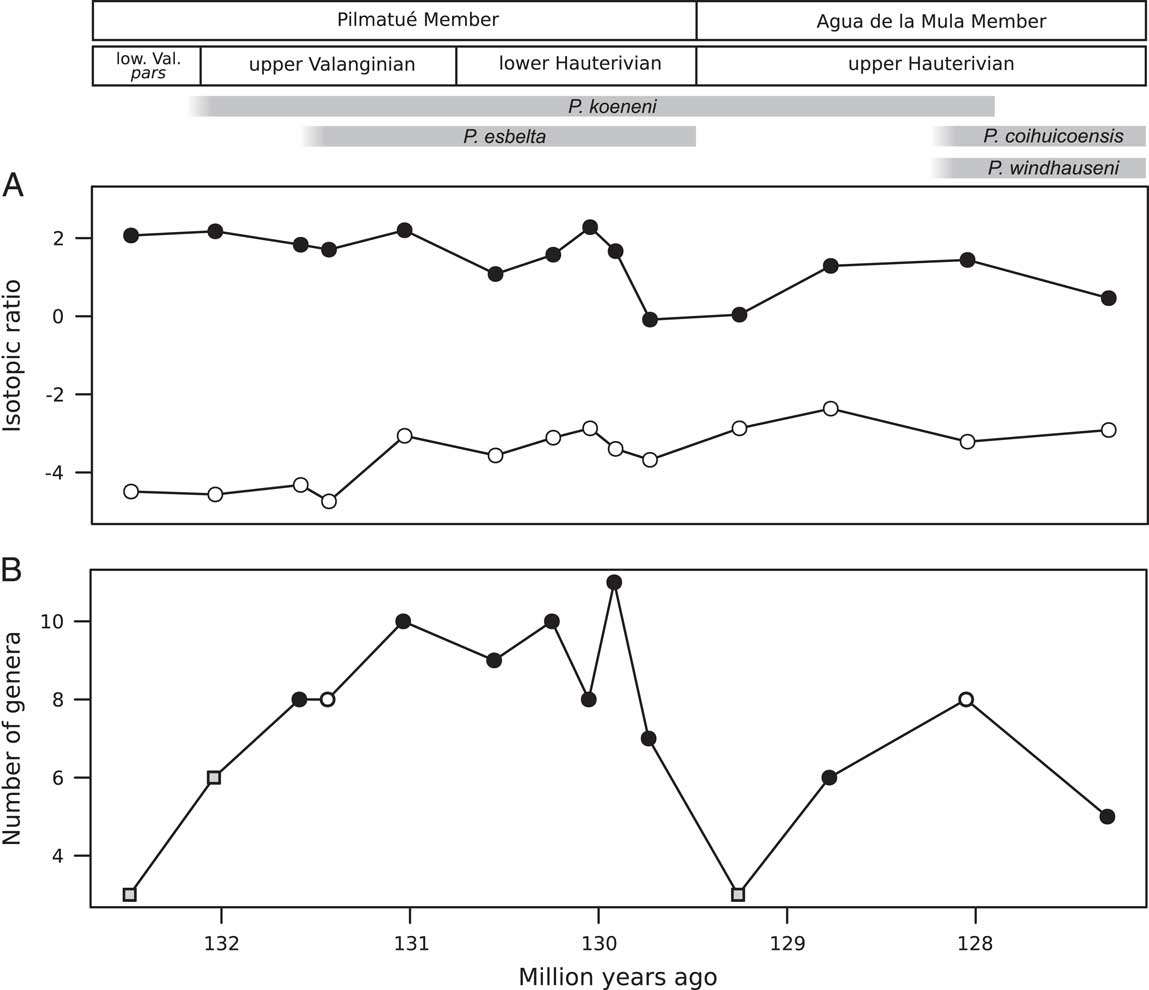
Results of isotopic and paleoecological data compilation are shown in Figure 7. Both sources of data lack the S. riverorum Zone, as they were collected before the recognition of this zone from the top section of the P. groeberi Zone (and hence data from the former are pooled with data from the latter). Also, unlike morphological data, isotopic and shallow-burrowing bivalve records exist for the O. (O.) atherstoni Subzone and S. riccardii Zone from the Pilmatué and the Agua de la Mula Members, respectively. Both δ18O and δ13C show constantly fluctuating values throughout the studied interval (Fig. 7A). δ13C shows its lowest values at the onset of the Pilmatué Member, during the K. attenuatum and P. angulatiformis Subzones (upper Valanginian), after which it remains relatively stable at higher values. δ18O stays relatively stable at high values during the K. attenuatum Subzone–H. gentilii Zone before falling at the W. vacaense Zone. The curve rises again at the C. schlagintweiti Zone (upper Hauterivian), but never reaches the values attained during the Valanginian (Fig. 7A). Interestingly, during most of the interval covered by the Pilmatué Member, values of both isotopes increase and decrease together (Pearson’s r=0.609), although their fluctuations differ in magnitude. This correlation is not observed for the Agua de la Mula Member (Pearson’s r=0.131). Diversity of shallow-burrowing bivalves shows its lowest values at the onset of each member (P. angulatiformis Subzone, mid-upper Valanginian, and S. riccardii Zone, lower upper Hauterivian, respectively), with only three genera present. After these minima, the number of shallow-burrowing bivalve genera starts to rise in both units (Fig. 7B). In the Pilmatué Member, the number of genera stabilizes around 9, with a maximum of 11 genera occurring at the H. gentilii Zone (upper lower Hauterivian). For the Agua de la Mula Member, the overall generic diversity is lower, and the paleodiversity curve lacks the plateau attained in the Pilmatué Member. Instead, it reaches a maximum of 8 genera present at the C. diamantensis Zone (mid-upper Hauterivian), dropping immediately after (Fig. 7B).
Isotopic and paleodiversity data compiled for the lower/upper Valanginian–uppermost Hauterivian interval. (A) Isotopic curves for carbon (filled circles) and oxygen (open circles). (B) Paleodiversity curve showing the number of shallow-burrowing bivalve genera present in the different zones or subzones; gray squares mark ammonoid zones for which dysoxic events have been recognized (see text), whereas open circles indicate first occurrences of Ptychomya species within this interval. Stratigraphic units and ranges of species are figured on top. Abbreviation: low. Val., lower Valanginian.

Discussion
As noted by previous authors (e.g., Weaver Reference Weaver1931; Aguirre-Urreta et al. Reference Aguirre-Urreta, Lazo, Griffin, Vennari, Parras, Cataldo, Garberoglio and Luci2011), the morphological evolution of Ptychomya through the Lower Cretaceous of the Neuquén Basin is highly complex. Our results show that this complexity arises from the interaction between the characteristic morphologies and anagenetic patterns of evolution exhibited by the different species present, as well as the morphological change associated with speciation and extinction events within this interval. These factors, combined with the mosaic evolution of the addressed traits, result in changes in both the average morphology and the morphological disparity displayed by the genus at different moments of its evolutionary history.
Recent surveys on evolutionary modes in the fossil record found very low relative frequencies of directional evolution (5% to 10%) and high frequencies of stasis and random evolution, with a slight predominance of the latter (Hunt Reference Hunt2007; Hopkins and Lidgard Reference Hopkins and Lidgard2012; Hunt et al. Reference Hunt, Hopkins and Lidgard2015). Our results do support a low incidence of directional evolution, as none of the traits analyzed at the species level is evolving under GRW (although the shell size of P. coihuicoensis and shell outline of P. windhauseni do show sustained accumulation of morphological change throughout their stratigraphic distribution). However, we also found a null incidence for URW in traits analyzed at the species level. Instead, our results show an overwhelming preponderance of stasis, with all traits analyzed at the species level showing no net morphological change. As mentioned earlier, qualitative assessment of the ribbing-pattern and shell size of P. esbelta and P. windhauseni and the ribbing pattern and shell outline of P. coihuicoensis shows overall stable values over time, concordant with a pattern of morphological stasis. Therefore, the evolution of Ptychomya in this particular geographic and stratigraphic setting represents a model in which stasis is predominant and change is mostly driven by the morphological shift associated with the emergence of new species. These two features represent the main predictions of the punctuated equilibria theory (Eldredge and Gould Reference Eldredge and Gould1972; Gould and Eldredge Reference Gould and Eldredge1977), and thus evolution of Ptychomya in the studied setting can be regarded as mostly speciational. The anagenetic accumulation of morphological change observed for some traits does not invalidate this evolutionary model, although it does complicate the evolutionary picture of this genus.
First occurrences of new species of Ptychomya in the Agrio Formation take place at two different times: the first at the C. ornatum Subzone (mid-upper Valanginian), when P. esbelta is initially recorded; and the second at the C. diamantensis Zone (mid-upper Hauterivian), when both P. coihuicoensis and P. windhauseni appear. As expected from a case of speciational evolution, transitional forms are not recorded; instead, species appear abruptly and show little or no net anagenetic evolution (with the exceptions of P. coihuicoensis shell size and P. windhauseni shell outline). The origin of any species can be considered to be at least as old as its first occurrence, but probably older. The extent of this delay is uncertain for our cluster of species. However, assuming a punctuated model of evolution and considering the quality of the benthic invertebrate fossil record of the Agrio Formation, the average duration of a zone/subzone estimated for the studied interval (ca. 350 Kyr) and the estimated time required for marine invertebrates to complete cladogenesis (ca. 220 Kyr; Jackson and Cheetham Reference Jackson and Cheetham1999), it should encompass no more than one biostratigraphic level.
When contrasting timing of speciation with paleodiversity data, it becomes apparent that new Ptychomya species originate after times in which shallow-burrowing bivalve assemblages are depleted (O. (O.) atherstoni–K. attenuatum Subzones, S. riccardii–C. schlagintweiti Zones), appearing in the fossil record when this diversity is either recovering (C. ornatum Subzone) or reaching a peak (C. diamantensis Zone). The diversity minima coincide with the two most important transgressive episodes known in the Agrio Formation and the occurrence of two major events of marine dysoxia. These dysoxic events have been recognized at the bases of the Pilmatué and the Agua de la Mula Members by the presence of black shale deposits, high concentrations of total organic matter, low diversity, sometimes dwarfed invertebrate assemblages, and other paleoecological indicators of oxygen-controlled conditions (Tyson et al. Reference Tyson, Esherwood and Pattison2005; Aguirre-Urreta et al. Reference Aguirre-Urreta, Price, Ruffell, Lazo, Kalin, Ogle and Rawson2008; Guler et al. Reference Guler, Lazo, Pazos, Borel, Ottone, Tyson, Cesaretti and Aguirre-Urreta2013; Cataldo and Lazo Reference Cataldo and Lazo2016). Guler et al. (Reference Guler, Lazo, Pazos, Borel, Ottone, Tyson, Cesaretti and Aguirre-Urreta2013) proposed that the enclosed geographic configuration the Neuquén Basin during the Early Cretaceous could have caused its temporary isolation from the Pacific Ocean, leading to reduced circulation, stratified water masses, and reduced seafloor oxygen levels, which in turn could have caused local extinction of benthic faunas. The diminished shallow-burrowing bivalve diversity would have resulted in greater ecological availability (Losos and Mahler Reference Losos and Mahler2010; Yoder et al. Reference Yoder, Clancey, Des Roches, Eastman, Gentry, Godsoe, Hagey, Jochimsen, Oswald, Robertson, Sarver, Schenks, Spear and Harmon2010). Therefore, the speciation events observed in Ptychomya during the Agrio Formation could have been triggered by ecological opportunity, a process widely accepted as a major driver of clade diversification and adaptive radiation (Wellborn and Langerhans Reference Wellborn and Langerhans2015).
The anagenetic patterns of evolution shown here to characterize species of Ptychomya throughout the Agrio Formation fit surprisingly well to the model of plus ça change (Sheldon Reference Sheldon1996). This model proposes that morphological stasis constitutes the usual response to geologically quickly fluctuating physical conditions, whereas directional evolution can be expected to occur in more gradually changing settings. Although both the Pilmatué and Agua de la Mula Members are inferred to have been deposited in highly cyclic, shallow-marine environments, they also present some important differences in terms of their overall environmental interpretation. In particular, the Pilmatué Member is characterized by a high cyclicity of lithofacies and aggradational succession of strata. Also, as mentioned earlier, carbon and oxygen curves, commonly used as proxies for organic matter input and temperature/salinity, respectively, show a rough correlation during the Pilmatué Member, increasing and decreasing together through the zones/subzones of this interval. The persistence of this relationship, despite fluctuations in their values, together with the stratigraphic arrangement of this unit, suggest the preponderance of some sort of fluctuating paleoenvironmental stability during the deposition of this unit. This situation changes for the interval covered by the Agua de la Mula Member, as the loss of correlation between isotopic values is accompanied by a general shallowing-upward trend, evidenced in the progradational (although still cyclic at a finer scale) succession of strata. Following the plus ça change model, the prevalence of stasis and lack of directional change observed for P. koeneni and P. esbelta in the Pilmatué Member would have been the result of the fluctuating (although stable at broader timescales) paleoenvironmental conditions inferred to predominate in the basin during the late Valanginian–early Hauterivian. On the other hand, the directional patterns of evolution shown by the younger P. coihuicoensis and P. windhauseni would reflect the evolutionary response of these species to the increasingly shallower conditions prevailing in the basin during the late Hauterivian–earliest Barremian.
Although alternative processes cannot be ruled out, the ecological opportunity and the plus ça change scenarios proposed here to explain different aspects of the evolution of Ptychomya seem particularly well suited to explain the observed evolutionary patterns in light of the complementary historical evidence. These hypotheses imply the adaptive nature of the morphological change displayed by the genus through the Agrio Formation, either associated with punctuations (i.e., rapid cladogenesis) or more slowly accumulated (i.e., anagenetic). However, although the traits addressed in this work are of undoubted adaptive significance for burrowing bivalves (Stanley Reference Stanley1970), a detailed morphofunctional model for these species has not been developed yet.
Conclusions
Throughout the Agrio Formation of the Neuquén Basin, the genus Ptychomya exhibits a complex pattern of morphological evolution. This complexity arises from three main sources of evolutionary variation, namely, (1) species turnover, (2) the mosaic evolution of different traits, and (3) the anagenetic pattern of evolution of each individual species lineage. Most of the addressed traits are found to be evolving under stasis, with two notable exceptions: shell outline of P. windhauseni and shell size of P. coihuicoensis, which show trends toward higher and larger shells, respectively. Therefore, the bulk of the evolutionary change displayed by the genus is associated with speciation events, aligning our results with the main predictions of the punctuated equilibria theory.
The timing of speciation and evolutionary patterns shown by the species lineages of Ptychomya can be explained by looking at the depositional history of the Agrio Formation. Origination of new species seems to be related to the ecological opportunity generated by two dysoxic episodes affecting the Neuquén Basin during the early/late Valanginian and earliest late Hauterivian, which are in turn associated with two local major transgressive episodes. After the first speciation event, in which P. esbelta appeared, and for the remainder of the late Valanginian–early Hauterivian, morphologies remained under stasis in response to the fluctuating, although to a broader scale stable, paleoenvironmental conditions. Partial desiccation and subsequent flooding of the basin triggered a second pulse of speciation, in which P. coihuicoensis and P. windhauseni appeared. The new, progressively shallower conditions somewhat changed the rules of the evolutionary game for Ptychomya, prompting the sustained accumulation of morphological change displayed by P. coihuicoensis and P. windhauseni.
Further research should be focused in two main directions: (1) the development of a thorough model of functional morphology for this genus and (2) the exploration of features of the evolution of other prominent bivalve genera from the Agrio Formation that are shared with Ptychomya. Both of these aspects need to be addressed to fully understand the details and extent of the adaptive processes driving the evolution of Ptychomya and to develop further insights into how the evolutionary processes operate at macroevolutionary scales.
Acknowledgments
We want to thank N. Mongiardino, O. Lehmann, D. Pérez, A. Elgorriaga, A. Toscano, C. Cataldo, and V. García Alonso for their helpful comments at different stages of this study. We are especially grateful to J. Crampton, G. Hunt, and one anonymous referee for useful comments and suggestions that greatly improved the article. This research was supported by grants ANPCyT PICT 2013-1506, UBACyT 20020130100106BA, CONICET PIP 11220120100542, and ANPCyT PICT 2015-1381 awarded to I. M. Soto, M. B. Aguirre-Urreta, V. A. Ramos, and D. G. Lazo, respectively. This is the contribution R-230 of IDEAN.
Supplementary Material
Data available from the Dryad Digital Repository: http://doi.org/10.5061/dryad.gn5j6