INTRODUCTION
Essential amino acid (AA) requirements for broiler chickens are well documented, but for practical prediction of performance, difficulty remains in deciding the most advantageous dietary AA patterns to use. This difficulty is partly due to non-linearity of the growth response to change in dietary AA concentrations (Gous & Morris Reference Gous and Morris1985; Oviedo-Rondón & Waldroup Reference Oviedo-Rondón and Waldroup2002). To develop accurate models of AA requirements, estimates of maintenance requirements and efficiencies of utilizing indispensable AAs for whole body protein accretion are essential (Edwards & Baker Reference Edwards, Fernandez and Baker1999). There are models for predicting the AA requirements of poultry. Curnow (Reference Curnow1973) introduced a smooth population curve to describe egg production based on a broken-stick assumption and information about the standard deviations of body weight (BW) and egg output. The model was used by Fisher et al. (Reference Fisher, Morris and Jennings1973) for laying hens and Boorman & Burgess (Reference Boorman, Burgess, Fisher and Boorman1986) for growing chickens to estimate AA requirements. Researchers at Edinburgh (e.g. Emmans Reference Emmans, Hillyer, Whittemore and Gunn1981) proposed a programme that utilizes projected Gompertz growth curves to partition energy and protein intake of broilers between daily maintenance requirement, protein and feather growth. Hurwitz et al. (Reference Hurwitz, Sklan and Bartov1978) constructed a model to estimate protein and AA requirements of broilers for maintenance and growth. The model was later modified to take into account effects of environmental temperature and differences in composition of weight gain (proportion of lipid) on energy needs in both chickens and turkeys (Hurwitz et al. Reference Hurwitz, Frisch, Bar, Eisner, Bengal and Pines1983). National Research Council (NRC) (1994a) accepted this model as a good estimator of requirements for some AAs for which no experimental results were available. However, the model of Hurwitz et al. (Reference Hurwitz, Sklan and Bartov1978) is founded on the premise that growth rate determines requirements based on some fixed rate of nutrient utilization, which does not represent adequately the biological phenomena involved (Pesti & Miller Reference Pesti and Miller1997). There are numerous studies suggesting that a limiting AA is utilized with constant efficiency over the range of intakes from maintenance to that required for maximal protein accretion (e.g. Hurwitz et al. Reference Hurwitz, Sklan and Bartov1978, Reference Hurwitz, Frisch, Bar, Eisner, Bengal and Pines1983; Baker Reference Baker1991; Baker et al. Reference Baker, Fernandez, Parsons, Edwards, Emmert and Webel1996; Edwards et al. Reference Edwards, Baker, Fernandez and Parsons1997, Reference Edwards and Baker1999; Edwards & Baker Reference Edwards, Fernandez and Baker1999). In contrast, Heger & Frydrych (Reference Heger and Frydrych1985), Gahl et al. (Reference Gahl, Crenshaw and Benevenga1994), Vazquez & Pesti (Reference Vazquez and Pesti1997), Baker et al. (Reference Baker, Batal, Parr, Augspurger and Parsons2002) and Fatufe et al. (Reference Fatufe, Timmler and Rodehutscord2004, Reference Fatufe and Rodehutscord2005), demonstrated that efficiency of utilization of AAs declined as their intake approached optimum.
Non-linear models have been used to estimate AA requirements. For example, Samadi & Liebert (Reference Samadi and Liebert2007a, Reference Samadi and Liebertb) used an exponential function relating N intake to N retention and calculated lysine and threonine requirements in growing chicks. The potential and validity of a specially re-parameterized monomolecular model (Darmani Kuhi et al. Reference Darmani Kuhi, Kebreab, Owen and France2001) to partition AA intakes between requirements for maintenance and growth have been demonstrated recently in relation to broilers using results from two types of study, namely bioassay and nitrogen balance experiments (Kebreab et al. Reference Kebreab, France, Darmani Kuhi and Lopez2008). The present study aims to apply this model to provide estimates of AA requirement for maintenance and efficiency of utilization of dietary AA for live weight gain (LWG), protein and AA accretion using the results of four studies (Baker et al. Reference Baker, Fernandez, Parsons, Edwards, Emmert and Webel1996; Edwards et al. Reference Edwards, Baker, Fernandez and Parsons1997, Reference Edwards and Baker1999).
MATERIALS AND METHODS
Experimental data
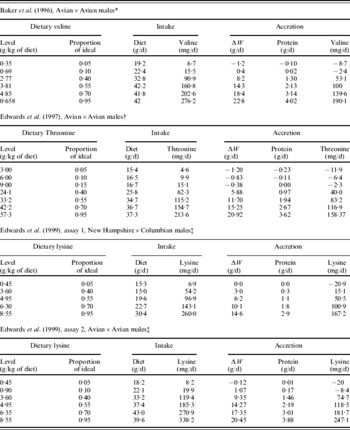
Results of four bioassays, conducted to determine maintenance requirement and efficiency of utilization of dietary AA in young chicks, taken from the literature for slow and fast growing broiler strains, were used in the current study (Baker et al. Reference Baker, Fernandez, Parsons, Edwards, Emmert and Webel1996; Edwards et al. Reference Edwards, Baker, Fernandez and Parsons1997, Reference Edwards and Baker1999). In each assay, chicks were given free access to crystalline AA diets containing graded levels of AA to meet ideal levels of indispensable AA requirements (Table 1).
Accretion of body-weight (ΔW), protein, and AA in chicks fed graded levels of valine, threonine and lysine

* Data are means of four pens of four chicks during a 10-d assay (10–20 post-hatching). Average initial weight was 158 g.
† Data are means of four pens of four chicks during a 10-d assay (10–20 post-hatching). Average initial weight was 157 g.
‡ Data are means of three (assay 1) and four (assay 2) pens of four chicks during a 10-d assay (10–20 post-hatching). Average initial weight of chicks was 103 and 157 for assay 1 and 2, respectively.
The model
The suitability of the monomolecular equation (Eqn 1), specifically re-parameterized for analysing energy balance data, in relation to broilers and turkeys has been investigated recently (Darmani Kuhi et al. Reference Darmani Kuhi, Kebreab, Owen and France2001, Reference Darmani Kuhi, Kebreab, Lopez and France2003, Reference Darmani Kuhi, Kebreab, Lopez and France2004; Kebreab et al. Reference Kebreab, France, Darmani Kuhi and Lopez2008). In the current study, this equation was used to provide estimates of AA requirements for maintenance, gain and protein (or AA) accretion in fast and slow growing broilers:

where y is BW gain (BWG) or protein (or AA) accretion [g of BWG or g of protein (or mg of AA) accretion/g of BW/d], y max is the theoretical maximum attainable value for y, K is a fractional rate parameter [mg of AA intake/g of BW/d]−1, x is AA intake [mg of AA/g of BW/d] and xm is AA intake at maintenance. The model was fitted to the data and the parameters and AA requirements for maintenance estimated. The average efficiency of utilization between Δ1×maintenance and Δ2×maintenance (Δ2⩾Δ1⩾1) is determined by

Statistical procedures
Due to the absence of a single robust criterion for model evaluation, three criteria were used to evaluate model adequacy: (1) model behaviour when fitting the curves using non-linear regression, (2) statistical performance and (3) comparison of biologically meaningful indicators obtained using the model. All statistical analyses were performed using the non-linear function of SigmaPlot (SPSS 1998). The proportion of variation accounted for (R 2), the amount of total variation about the mean value of y explained by the fitted curves, was used as a measure of adequacy of the model.
RESULTS
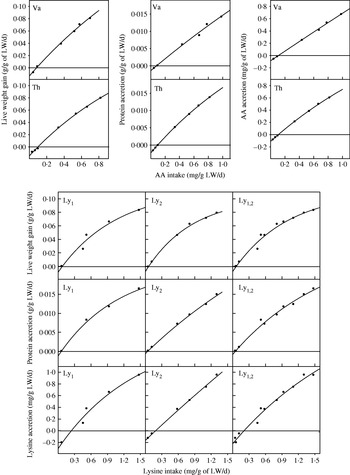
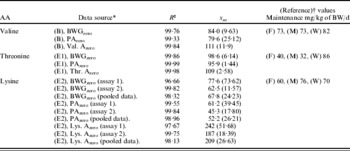
Figure 1 shows the fit of the model to the data on BWG (or protein (or AA) accretion) v. AA intake. The resultant curves (Fig. 1) and general goodness of fit, based on variation accounted for (R 2) and standard error (s.e.) estimated for the growth parameters, indicated that fits of the model to the data sets were acceptable (Table 2). The curves shown in Fig. 1 were extrapolated to the y-axis, so that x at y zero (which represents the AA requirement for maintenance) can be computed. Estimates of maintenance AA requirements for zero BWG, zero protein accretion and zero AA accretion were then calculated (Table 2). The maintenance requirements estimated by the model were in the range of 80–111, 96–109 and 52–209 mg/kg of live weight (LW)/day for valine, threonine and lysine, respectively, depending on the response criterion. The results giving higher maintenance requirements of AA using zero AA accretion are in agreement with the results of Baker et al. (Reference Baker, Fernandez, Parsons, Edwards, Emmert and Webel1996) and Edwards et al. (Reference Edwards, Baker, Fernandez and Parsons1997, Reference Edwards and Baker1999) who stated that the maintenance requirement for a given AA depends on the response criterion being measured.
Plots of LWG, protein and AA accretion against AA intake, showing fit of monomolecular equation to data. The AA were valine (Va), threonine (Th) and lysine (Ly). The data for Va were from Baker et al. (Reference Baker, Fernandez, Parsons, Edwards, Emmert and Webel1996), Th from Edwards et al. (Reference Edwards, Baker, Fernandez and Parsons1997) and Ly from Edwards et al. (Reference Edwards and Baker1999). For Ly, the numbers indicate fit of equation to data from assays 1 and 2, and pooled data (assays 1 and 2).

The maintenance requirements (xm) for individual AAs (mg/kg of BW/day) obtained using the model together with reported values of maintenance requirements. s.e. are given in brackets

* (B) Baker et al. (Reference Baker, Fernandez, Parsons, Edwards, Emmert and Webel1996), (E1) Edwards et al. (Reference Edwards, Baker, Fernandez and Parsons1997), (E2) Edwards et al. (Reference Edwards and Baker1999), BWGzero=based on zero BWG, PA zero=based on zero protein accretion, Val. Azero=based on zero valine accretion, Thr. Azero=based on zero threonine accretion and Lys. Azero=based on zero lysine accretion.
† References: (F) Fisher (Reference Fisher1998), (M) McDonald & Morris (Reference McDonald and Morris1985) and (W) Wiseman (Reference Wiseman1994).
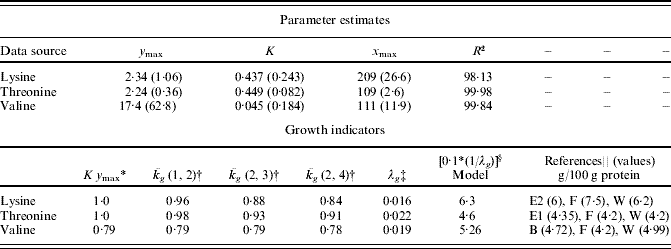
Indicators calculated from the monomolecular equation together with reported values of growth indicators are shown in Table 3. From values of  g at different multiples of maintenance, it can be seen that efficiency of utilization of threonine and lysine is greatest at low intake levels and decreases as intake is increased.
Parameter estimates obtained and growth indicators calculated from the monomolecular equation together with their reported values
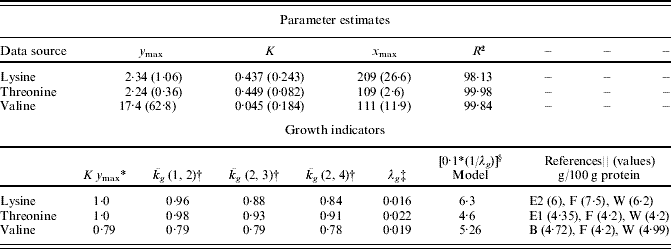
* The product K y max is the maximum efficiency (mg of lysine, threonine or valine accretion/mg of lysine, threonine or valine intake) and occurs when y equals zero (i.e. at maintenance).
† Average efficiency of AA utilization for AA accretion (mg of AA accreted/mg of AA ingested) between 1–2, 2–3 and 2–4×maintenance.
‡ Average efficiency of AA utilization for protein accretion between 1–4×maintenance (g of protein accretion/mg of AA).
§ Average AA requirement for protein accretion between 1–4×maintenance (g of AA/100 g of protein accretion).
∥ Reported values of AA composition of the whole carcass of young chicken. (B) Baker et al. (Reference Baker, Fernandez, Parsons, Edwards, Emmert and Webel1996), (E1) Edwards et al. (Reference Edwards, Baker, Fernandez and Parsons1997), (E2) Edwards et al. (Reference Edwards and Baker1999), (F) Fisher (Reference Fisher1998) and (W) Wiseman (Reference Wiseman1994).
DISCUSSION
Development of a more dynamic approach to determining AA requirements requires knowledge of digestibility of dietary protein, pattern of AA deposition, partial efficiency with which absorbed AAs (protein) are used for maintenance and deposition, and how metabolic modifiers alter rate of protein accretion and maintenance requirement (NRC 1994b). AA requirements of broilers have been determined using different methodologies, such as growth variables, carcass analysis, radioactive isotope studies, plasma AA analysis and rates of AA oxidation. However, the most common procedures are the evaluation of broiler performance as a function of graded levels of AA intake (the graded supplementation technique, D'Mello Reference D'Mello1982), where a basal diet deficient in the test AA is progressively supplemented with increasing doses of the synthetic form of the test AA, and the summit dilution technique (Fisher & Morris Reference Fisher and Morris1970), in which a summit diet with excessive amounts of all AAs but with the test AA first limiting is progressively diluted with either a non-protein diluent or a dilution feed with the balance of AAs reflecting that in the summit diet (Gous & Morris Reference Gous and Morris1985; Gous Reference Gous2007). The concentration of an AA in the diet producing maximal BW, highest feed conversion efficiency, etc. is determined as being requirement for the AA and is normally expressed as a fixed concentration of diet. These fixed values of AAs are compiled in tables of requirements and utilized for feed-cost formulation. With fixed requirements, it is impossible to predict the effect on rate of growth, feed intake, or carcass composition by manipulation of concentration and balance of dietary AAs. Furthermore, single fixed numbers for requirements are not useful for applying to an accurate cost-benefit analysis. Since responses of birds to dietary energy, protein and AAs are diminishing returns phenomena, they should be evaluated as such to estimate optimum economic levels, rather than as biological maxima (Clark et al. Reference Clark, Gous and Morris1982; Gous & Morris Reference Gous and Morris1985). A linear or ‘broken stick’ method was used by Gous & Morris (Reference Gous and Morris1985) to determine lysine requirement. Samadi & Liebert (Reference Samadi and Liebert2008) applied the principles of the diet dilution technique using an exponential function for the modelling of lysine and threonine requirements in a stochastic manner. In the current study, a nonlinear deterministic model was used and an alternative simple method to estimate AA requirements in poultry was offered.
Darmani Kuhi et al. (Reference Darmani Kuhi, Kebreab, Owen and France2001, Reference Darmani Kuhi, Kebreab, Lopez and France2003, Reference Darmani Kuhi, Kebreab, Lopez and France2004) and Kebreab et al. (Reference Kebreab, France, Darmani Kuhi and Lopez2008) developed a monomolecular equation to estimate energy and crude protein needed by growing broilers and turkeys for maintenance and gain. In the study presented here, the aim was to assess applicability of this model in estimating AA requirements for maintenance, gain and protein (or AA) accretion in fast- and slow-growing broiler strains fed crystalline AA diets with a wide range of dosing levels. With regard to the estimates of AA requirements for maintenance (Table 2) and average AA requirement for protein accretion between 1× and 4× maintenance (Table 3), it can be seen that these estimates lie in the range reported by different researchers. The estimated maintenance requirements for lysine are higher based on lysine accretion than on either BW gain or protein accretion, which are in agreement with the results of Edwards et al. (Reference Edwards and Baker1999) who pointed out that the maintenance requirement estimates from zero lysine accretion were much higher than those obtained from zero protein accretion. According to Edwards et al. (Reference Edwards and Baker1999) this reflects a shift in type of protein in the body, with more collagen protein and less contractile protein being present in chicks fed lysine levels near maintenance. They conclude that the lysine requirement for maintenance of broiler chicks is not low but instead is high. The maintenance requirements for AAs can be influenced by a multitude of factors such as different concentrations of dietary AA, response criteria (protein or AA accretion), environmental conditions and genetics. According to Leclercq (Reference Leclercq1998) and Vazquez & Pesti (Reference Vazquez and Pesti1997) the particular mathematical model being used to calculate AA requirement can also influence AA requirement profiles. With the current estimates of the maintenance requirements for lysine (67·5, 52·2 and 209 mg/kg of LW/d for zero BW, protein and lysine accretion, respectively) together with the estimates of the total lysine requirements when growth rate, protein and lysine accretion reach their maximum values, the maintenance requirements for lysine represent 0·45, 0·35 and 0·13 of the total requirements which are in the range reported previously by researchers. A higher maintenance requirement for lysine as a percentage of total lysine requirements is in agreement with the result of Emmert & Baker (Reference Emmert and Baker1997), who pointed out that the use of lysine accretion as a criterion led to much larger estimates of maintenance requirement as a percentage of the total requirements. Additionally, an estimate of 6·3 g lysine for 100 g protein accretion and an efficiency of lysine utilization of 1·0–0·85, which are both biologically meaningful, can be considered as further evidence of the predictive ability of the model.
Average efficiency of recovering AA in whole body protein, between maintenance and 4×maintenance, estimated by the model was 1·0–0·91 for threonine, 1·0–85 for lysine and 0·79–0·78 for valine (Table 3), which is in agreement with values of 0·95–1·00 reported by Harper et al. (Reference Harper, Benevenga and Wohlhueter1970) and Morris (Reference Morris, Freeman and Lake1972) for efficiency of utilization of limiting AAs. These results are also in agreement with reported values of 0·85–1·0 and 0·80–0·94 achieved in growing pigs given semi-purified diets and fed to optimum rates of growth (Whittemore Reference Whittemore1983; NRC 1994b). Considering the values of g at different multiples of maintenance, the efficiency of utilization of threonine and lysine is greatest at low intake levels and decreases as intake is increased. These results are supported by conventional wisdom, namely that a gradual decrease in utilization of nutrients for producing gain occurs as intake increases. This is partly due to a slight fall in digestive efficiency of the animal with increased feeding level and partly to the fact that anabolic processes are less efficient than catabolic ones. Protein turnover is higher as protein intake is increased, as any excess in AA supply causes a rise in AA degradation rates (Riis Reference Riis and Riis1983a, Reference Riis and Riisb). Therefore, successive increments of daily intake of nutrients result in progressively smaller increments in daily gain (Blaxter & Boyne Reference Blaxter and Boyne1978).
In conclusion, results presented here and those previously reported for broilers and turkeys (Darmani Kuhi et al. Reference Darmani Kuhi, Kebreab, Owen and France2001, Reference Darmani Kuhi, Kebreab, Lopez and France2003) and Kebreab et al. (Reference Kebreab, France, Darmani Kuhi and Lopez2008) can be considered as a basis for accepting the general validity of the monomolecular equation to predict the magnitude and direction of responses of growing broilers and turkeys to dietary energy and protein (or AA) intake without making any initial assumptions.