I. INTRODUCTION
Thermoelectric power generation has garnered interest over the past decade as a clean and reliable technology for recovering unused heat energy from industrial processes, automotives, and nature. The attractiveness of oxide thermoelectrics in lieu of their alloy counterparts are the relative low cost, low toxicity, and natural abundance of their constituent elements, as well as their superior high-temperature stability in air. Reference He, Liu and Funahashi1 Standard power generation modules consist of an array of p- and n-type thermoelectric legs (thermoelements) connected thermally in parallel but electrically in series. The latter is generally achieved by bridging neighboring thermoelements with precious metal foil interconnects (usually silver) and/or conducting pastes (again, usually silver-based). Reference Funahashi and Urata2–Reference Han, Jiang, Li, Su, Lan, Qin, Han, Zhong, Chen and Yu4 In an effort to not mitigate the low-cost advantages oxide thermoelectrics, a cheaper interconnect material was investigated. A high-chrome iron alloy (Crofer® 22 APU, ThyssenKrupp VDM GmbH; denoted Cr22A) developed for solid-oxide fuel cell applications was chosen for its oxidation resistance and a thermal expansion coefficient close to that of Ca3Co4O9 (henceforth referred to as Ca349).
In a previous investigation Reference Holgate, Han, Wu, Bøjesen, Christensen, Iversen, Nong and Pryds5 of the interface between Ca349 and a custom high-chrome iron alloy without any barrier layer, the interfaces degraded at high temperatures due to a reaction between the Ca in the Ca349 and the protective chromia-containing scale of the alloy to form the poorly conducting CaCrO4. It was the intent of this investigation to prevent this reaction by introducing a barrier layer consisting of a relatively well-conducting oxide. This technique has been widely used in the solid oxide fuel cell (SOFC) community with some success. Reference Komatsu, Arai, Chiba, Nozawa, Arakawa and Sato6–Reference Waluyo, Park, Lee, Lim, Park, Song and Lee10 Komatsu et al. Reference Komatsu, Arai, Chiba, Nozawa, Arakawa and Sato6 demonstrated that La(Ni,Fe)O3 resists the uptake of Cr from the chromia scale of nickel alloys such as Inconel 600, and Yang et al. Reference Yang, Xia, Li and Stevenson7 have shown that (Mn,Co)3O4-coated Cr22A can successfully be applied to a SOFC cathode material ((La,Sr)FeO3) to create a stable and conducting interface. The specific purpose of this study was to investigate the effectiveness of these barrier materials when applied to the interface between the thermoelectric material Ca3Co4O9 and the Crofer® 22 APU interconnect alloy.
Pre-selection of candidates for a barrier layer material involved consideration of the thermal expansion, electronic conductivity, and chemical stability in air as well as when interfaced with a chromium containing compound. As thermoelectric power generation modules are generally used in “one-way applications” where there is a definitive “hot-side”, the application of the barrier layer is only necessitated at this side of the module. Therefore only the thermal, electrical, and thermomechanical properties of the barrier layer material within the operational temperature range of the hot-side need to be considered. A range of 600–800 °C was decided as a likely and reasonable hot-side operational temperature.
Both LaNi0.6Fe0.4O3 (LNFO) and Mn1.5Co1.5O4 (MNCO) have thermal expansion coefficients (αT = 11.8 and 11.5 × 10⁻⁶ °C−1 at 800 °C, respectively Reference Basu, Tietz, Teller, Wessel, Buchkremer and Stöver11,Reference Wu and Liu12 ) compatible with the thermoelectric material Ca349 in an untextured polycrystalline form (10–13 × 10−6 °C−1). Reference Holgate, Wu, Søndergaard, Iversen, Nong and Pryds13 In addition to its low cost and resistance to corrosion, the interconnect material Cr22A was also chosen for its compatible αT ∼12 × 10−6 °C−1). Reference Yang, Xia, Li and Stevenson7
II. EXPERIMENTAL METHODS
Ca349 used in the interfaced samples was produced from a solid state reaction of CaCO3 (Sigma Aldrich, 99%) and Co3O4 (Alfa Aesar, 99.7%). The starting powders were loaded into a polyethylene bottle with zirconia milling cylinders and a few drops of ethanol to promote caking of the powders during milling. After 24 h of roll milling, the powders were poured loosely into an alumina crucible and calcined at 900 °C for 24 h. An x-ray diffraction pattern (Bruker D8, Cu Kα radiation) of the resulting powders suggests a complete reaction and the formation of the Ca3Co4O9 phase. While some undetectable impurity phases of CaO or Co3O4 may have been present, the dynamic spark plasma sintering (SPS) process (described elsewhere Reference Wu, Holgate, Nong, Pryds and Linderoth14 ) used to densify the powders followed by subsequent annealing in air is sufficient to produce phase-pure samples. LNFO was synthesized by a citrate-nitrate sol–gel autocombustion method from La, Ni, and Fe nitrate-hydrates (M(NO3)X·YH2O; M = La, Ni, or Fe). The MNCO powders with a nominal composition of MNCO were obtained from fuelcellmaterials.com.
The application of the conducting oxide barrier layers was achieved by first preparing a spray-coating slurry consisting of the oxide powders, organic solvents, and a polymer binder. The oxide powders and a mixture of methylethylketone and ethanol (MEKET) were placed in a polyethylene bottle with zirconia milling cylinders and roll milled overnight to grind and disperse the oxide powders. Using a laser diffraction particle size analyzer (LS 13320, Beckman Coulter), the average particle size of the oxide powders was determined and the milling process repeated until submicrometer powders were obtained. Subsequently, a mixture of polyvinylpyrrolidone and polyvinylbutyral were added as a dispersant and binder, respectively, and the mixture returned to the rolling mill for an additional 12–24 h.
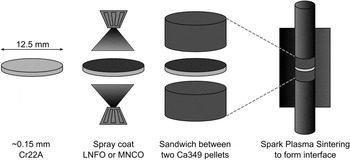
The spray coating and interfacing process is depicted in Fig. 1. Circular disks with a diameter of 12.5 mm were cut from a thick foil (∼0.15 mm) roll of Crofer® 22 APU. The Cr22A disks were then spray coated on both sides with either LNFO or MNCO using a handheld pneumatic sprayer. The Ca349 pellets densified by SPS were cut in half forming two thinner pellets, which were then mechanically polished with SiC P1200 paper to ensure parallel and planar top and bottom surfaces. To form the layered samples for characterization the two coated disks and one uncoated disk of Cr22A were each placed between two polished Ca349 pellets inside of a graphite die with graphite punches. A fourth sample was prepared without any Cr22A by simply placing the two polished halves of a cut Ca349 pellet back into a SPS die for rejoining under the same conditions as the ones containing the Cr22A alloy. The SPS program utilized the same ramp and approach to 850 °C as was used to form the Ca349 pellets, Reference Wu, Holgate, Nong, Pryds and Linderoth14 but the hold segment was replaced with a one minute rise to 870 °C before shutting off the current. The pressure used for the joining process was lowered to 35 MPa. The motive for lowering the pressure and reducing the duration of the hold segment was to limit deformation of the Ca349 pellets and limit interface reaction to bonding. The purpose of raising the temperature 20°C during the hold segment was to prevent too drastic a fall in the current between “approach” and “hold” segments.
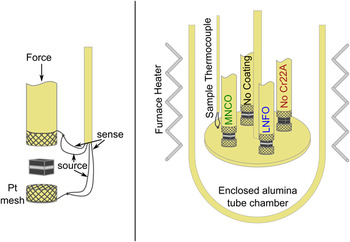
Measurement of the electrical conductivity of each material involved was carried out in air on bulk bar-shaped samples using a custom four-probe measurement equipped with a Model 580 micro-ohmmeter (Keithley Instruments, Cleveland, OH). Characterization of the stability of the interface was performed by measuring the resistances across the layered samples using a custom impedance spectroscopy rig designed for SOFC cathode testing (Fig. 2). Equipped with a Solartron 1255 frequency response analyzer paired with a Solartron 1287 potentiostat, the test rig performs a pseudo-four-probe ac resistance measurement as a function of frequency. The pure platinum source and sense leads are joined just outside of the sample, creating a two-probe measurement with very little lead resistance, which is subtracted using a preliminary baseline measurement with the same conditions of the sample measurement. Four samples were measured in independent channels with switching to the Solartron handled by a custom built multiplexer. An 8 × 8 mm2 specimen was cut from the center of each sample for the test rig measurement, and the tops and bottoms sputter coated with a thin layer of platinum. A more careful analysis of the interfacial contact resistance was carried out on samples cut from the leftover pieces of the layered pellets using a custom system described elsewhere. Reference Holgate, Han, Wu, Bøjesen, Christensen, Iversen, Nong and Pryds5 Analysis of the microstructure and composition at the interfaces was performed using a TM3000 scanning electron microscopy (SEM) from Hitachi (Tokyo, Japan) equipped with a Bruker SDD EDS detector (Billerica, MA).
III. RESULTS AND DISCUSSION
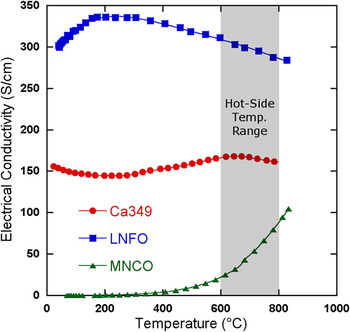
To compare the conductivities of the materials involved, bar-shaped samples were cut from bulk pellets prepared by SPS of the raw powders of each material. The electrical conductivities of the thermoelectric and barrier layer materials (measured in air) are shown in Fig. 3. The electrical conductivity of the p-type thermoelectric Ca349 remains on the order of 150 S/cm throughout the whole temperature range (RT to 800 °C) due to the presence of several structural or magnetic transitions affecting the electronic transport. While the magnitude is indicative of a degenerate semiconductor, from about 200 to 600 °C the weak positive temperature dependence resembles a more intrinsic behavior. The conductivity of MNCO is that of a more intrinsic semiconductor with a relatively narrow band gap, and it is only above ∼600 °C that MNCO becomes conducting enough to be practical as a barrier layer material. On the other hand, LNFO (which is n-type with a relatively low Seebeck coefficient) is twice as conducting as Ca349 throughout the whole temperature range and may be a better candidate for applications with lower or varying hot-side temperatures.
Spray coating and interfacing process.

Resistance versus time measurement configuration. The details of the measurement leads shown in the single channel diagram on the left are omitted for clarity in the full schematic on the right.

Comparison of the electrical conductivities of Ca349 (synthesized by the sol–gel method), LNFO, and MNCO. All measurements were taken in air. Note: Although Ca349 used in the layered samples for interfacial studies was synthesized by solid state reaction, which has a slightly lower conductivity than that of the sol–gel synthesized sample displayed here, the difference is insignificant when comparing the conductivities of either solid state or sol–gel Ca349 with those of MNCO and LNFO.

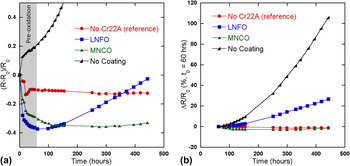
The normalized change in the resistance across each multilayered sample is presented in Fig. 4(a). Since the measurement is technically a two-probe measurement, any changes in the electrical contact between the platinum mesh leads and the sample will be included. However, all samples are Ca349 where the Pt mesh leads make contact, and previous results show that the contact between Ca349 and the Pt mesh leads is stable. Reference Holgate, Han, Wu, Bøjesen, Christensen, Iversen, Nong and Pryds5 Most notable is the rapid degradation of the Ca349/Cr22A/Ca349 sample with no barrier layer. Consistent with the results of Ref. Reference Holgate, Han, Wu, Bøjesen, Christensen, Iversen, Nong and Pryds5, the unabated formation of poorly conducting CaCrO4 results from the reaction of Ca from the Ca349 and Cr from the scale of Cr22A. The rest of the samples show similar trends during the first 50 h, dynamically decreasing with time as the effects of the dynamic SPS processing to form the interfaces are relaxed (reduction and decomposition of the Ca349, pore formation, internal stress, etc.). From this point, the reference sample that was formed by SPS two Ca349 pellets directly together shows a slightly decreasing trend throughout the measurement, which may be due to reduction of the contact resistance with the Pt mesh or further relaxation of any defects in Ca349. In the case of the two samples with the barrier coatings, there is a further reduction in their resistances between 50 and 100 h that is most likely due to further densification of the barrier layers.
Reduced, normalized resistance versus time at 800 °C relative to the values at (a) t = 0 and (b) t = 60 h.

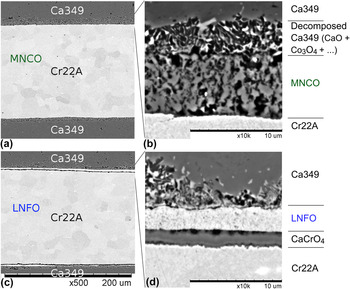
To be consistent with the previous work, Reference Holgate, Han, Wu, Bøjesen, Christensen, Iversen, Nong and Pryds5 the first ∼60 h is considered to be the pre-oxidation time, and so Fig. 4(b) displays the percent change in resistance from the value at 62 h. This more clearly displays the relative stabilities of the interfaces. The LNFO-coated sample exhibits a steadily increasing resistance while the MNCO-coated sample appears to be much more stable. From the SEM images of the interfaces as-SPSed reveal that while an attempt was made to be consistent with the application of the barrier layers, the MNCO layer [Figs. 5(a) and 5(c)] is thicker but less dense than the LNFO layer [Figs. 5(b) and 5(d)]. Due to the difference in mechanical properties between MNCO and LNFO, the same conditions during the preparation of the spray coating slurries resulted in different particle sizes, and this difference in conjunction with the different sintering activities of the two materials resulted in the differences in microstructures of the as-SPSed barrier layers.
(a) and (c): as-SPSed samples of MNCO and LNFO coated Cr22A, respectively. (b) and (d): Higher magnification images with labels of major phases inferred from EDS results.

The relative thinness of the LNFO layer (about 2 µm) may have contributed to the preformation of the CaCrO4 layer observed between the LNFO and Cr22A. Unfortunately, delamination of the LNFO sample during the cool-down segment of the resistivity versus time test prevented any analysis of the time-evolution of the interface microstructure—specifically of the CaCrO4 layer. It is possible that a thicker application of the LNFO layer with optimized interfacing conditions may prevent initial formation of CaCrO4, and thus its growth thereafter.
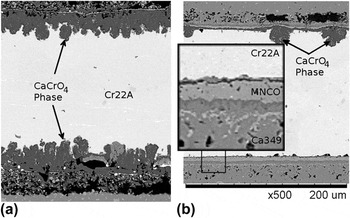
Even in the case of the MNCO sample, the spray coated MNCO layers on either side of the Cr22A were not of the same thickness (3 compared to 5 µm), despite an attempt keep the spray coating application consistent. In the SEM micrographs of Fig. 6, the interfaces of the uncoated and MNCO-coated Cr22A samples show that indeed the MNCO inhibits the growth of the poorly conducting CaCrO4 intermediate phase. Figure 6(a) shows unabated growth of this phase all along the interface, consuming the Cr22A while leaving behind large voids in the Ca349. While some localized growth of CaCrO4 can also be seen in Fig. 6(b) on the side of the Cr22A where the MNCO coating was the thinnest, the bottom thicker layer seems to have been effective in preventing this reaction.
Comparison of (a) uncoated Cr22A and (b) MNCO-coated Cr22A/Ca349 interfaces after ∼450 h in the resistance-versus-time measurement.

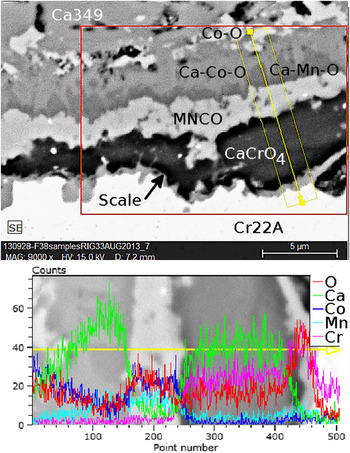
A closer analysis of the inset of the MNCO-coated interface after testing is presented in Fig. 7 with an EDS line scan across the interface where the MNCO was compromised and a localized growth of CaCrO4 occurred. A thinning of the MNCO can be observed where the CaCrO4 has formed, which most likely occurred during the pre-oxidation period. The light colored islands farthest above the interface are cobalt oxide, which is left from the decomposition and reformation of the Ca349 region adjacent to the MNCO during the dynamic interfacing process and then the pre-oxidation time. Between this layer and the MNCO layer is a region of calcium cobaltate that may be a cobalt deficient phase. The dark area just above the MNCO layer is likely to be calcium manganate, which is relatively conducting. It is not obvious from the results of this work whether or not the growth of this intermediate between Ca349 and MNCO is limited or will continue until the MNCO is consumed. Neither is it known when the formation of this manganate phase started. However, within the time frame of this study, the growth of this phase does not appear to have been detrimental to the electrical or mechanical integrity of the interface.
EDS line scan of the interface of MNCO-coated Cr22A and Co349 where the barrier layer was breached and CaCrO4 was formed.

A. Contact resistance
Because of the promising data on the stability of the MNCO-coated Cr22A/Co349 interface, the initial (as-SPSed) contact resistance was measured by a linear extrapolation of the resistance as a function of distance to the interface using a four-probe configuration with multiple voltage leads. Reference Holgate, Han, Wu, Bøjesen, Christensen, Iversen, Nong and Pryds5 This was performed in air from RT up to about 800 °C. Due to the poor conductivity of the MNCO at lower temperatures, only data above 600 °C were obtained. Multiplying this interfacial contact resistance by the area of the interface produced area-specific contact resistance (ASRC) value of 0.98 mΩ·cm2 at 807 °C. While this is an order of magnitude higher than what we have measured for the Ag/Ca349 interfaces using the same measurement technique (0.04 mΩ·cm2) it is important to note that this result is acceptable for applications with a hot-side temperature near 800 °C as a quick calculation will show that for a Ca349 thermoelement with a height equal to twice the width of its square cross-section, the contribution of an ASRC (T = 800 °C) = 0.98 mΩ·cm2 is only ∼4% of the whole Ca349 contribution (assuming a T-independent σ = 150 S/cm for Ca349, which is a reasonable approximation for a practical cold-side temperature of 200 °C).
Since the power output of a thermoelectric device is proportional to the temperature difference across the elements, the thermal contact resistances between interconnects and elements are also of interest. In the previous report on the Ni/Ca349 interfaces (Ref. Reference Holgate, Wu, Søndergaard, Iversen, Nong and Pryds13), the thermal contact of those interfaces were deduced from a “two-layer + contact resistance” model used with the laser flash technique (Netzsch LFA 457). The calculated results indicated a thermal contact resistance on the order of 0.03–0.07 mm2·K/W, which would conservatively yield ΔT’s across the interface of a few tens of millikelvin for typical element geometries. Considering the relatively high electrical contact resistance of that system, which undoubtedly plays a role in the thermal contact resistance, it is expected that thermal contact resistance of the Ca349/MNCO/Cr22A would not significantly degrade the effective thermoelectric efficiency of the element-interconnect system.
IV. CONCLUSION
The results of this study suggest that the goal should be the prevention of migration of Cr or Ca through the barrier layer as evident by the formation of ionic chromates despite the preservation of the barrier layer. Porosity, grain size, and thickness of the barrier layer, both initially and after the initial pre-oxidation time are key. The work of Yang et al. Reference Yang, Xia, Li and Stevenson7 suggests that heat treating MNCO-coated Cr22A before joining with Ca349 may be a positive route to allow for an initial growth of the Cr22A scale and the densification of the MNCO barrier layer before introducing the Ca-containing Ca349. Additionally, Wang et al. Reference Wang, Liu and Fergus15 found that the addition of Fe or Ti to MNCO further stabilized the MNCO/Cr22A interface. These results in conjunction with the results of this work suggest that (Mn,Co)3O4-based barrier layers applied by spray coating on the commercially available Crofer® 22 APU alloy may be a viable option for interconnecting Ca3Co4O9-based thermoelectric power generation modules, but further work is needed to optimize the barrier layer composition and thickness, as well as the processing conditions. Additionally, subsequent investigations are needed to identify a suitable n-type thermoelectric material counterpart to which this method may be applied.
ACKNOWLEDGMENTS
The authors thank Ming Chen, Sebastian Molin, and Nikolaos Bonanos for many helpful discussions, as well as Ebtisam Abdellahi for assistance with sample preparation for SEM. The authors also thank the Programme Commission on Energy and Environment (EnMi), which is part of the Danish Council for Strategic Research (Contract No. 10-093971), for sponsoring the research of the OTE-POWER project, and the Danish National Research Foundation (DNRF93) for additional funding.