I. INTRODUCTION
The base metal electrode (BME) multilayer ceramic capacitors (MLCCs) are sintered in reducing atmospheres for preventing oxidation of nickel (Ni) inner electrodes. Thus, the dielectrics of MLCCs are based on the defect-chemically acceptor-doped BaTiO3 system, although the actual composition is complex with a mixture of amphoteric dopants that can occupy the barium (Ba) or titanium (Ti) site such as yttrium (Y), dysprosium (Dy), holmium (Ho) and codoped B-site acceptors, such as magnesium (Mg), manganese (Mn), chromium (Cr), and sintering aids, etc.Reference Hennings1–Reference Sakabe, Hamaji, Sano and Wada6 The incorporation of acceptors into the bulk of BaTiO3 has the effect of fixing the concentration of charged oxygen vacancies through ionic compensation; viz,  $[{\rm{A']}} \approx {\rm{2[V}}_{\rm{O}} ^{ \bullet \bullet } ]$, which indicates oxygen vacancies with double positive charge. This compensation suppresses the electron generation and improves insulation resistance. On the other hand, these oxygen vacancies are mobile at moderate temperatures and under high electric fields, and cause resistance degradation and reliability problems of the dielectric layers.Reference Waser, Baiatu and Härdtl7–Reference Yoon, Park, Hong and Sinn15
As the dielectrics of multilayer ceramic capacitors (MLCC) are exposed to progressively higher electric field conditions as the thickness of dielectric layer becomes thinner, the reliability problem is of increasing concern. Thus, the behavior of resistance degradation has been intensively studied,Reference Waser, Baiatu and Härdtl7–Reference Rödel and Tomandl23 and its precise understanding becomes more and more important. The principles of degradation mechanism of insulation resistance in perovskite materials are well established.Reference Waser, Baiatu and Härdtl7 Under the simultaneous thermal and direct current electric field stresses, the electromigration of highly mobile oxygen vacancies occurs, resulting in depletion and pile-up of oxygen vacancies and consequent generation of holes and electrons in the positive-biased and negative-biased region, respectively. This situation is similar to the forward-biased p-n junction diode, and thus leakage current is enhanced, resulting in resistance degradation. Recently the direct experimental evidence of the polarization of oxygen vacancies in the resistance-degraded specimen has also been measured with electron energy loss spectroscopy (EELS), with direct quantification of the oxygen vacancy concentration and detection of Ti3+/Ti4+.Reference Yang, Dickey, Randall, Randall and Mann12 In a model iron (Fe)-doped strontium titanate (SrTiO3) single crystal system, the degradation in insulation resistance was directly associated with the increase in polaron conduction.Reference Liu, Yang and Randall20
Several methods are well known to improve the resistance degradation of acceptor-doped BaTiO3 system of BME MLCC dielectrics. One of the most general directions is obtaining finer microstructures, as a reduction in the grain size can lead to a significant improvement in the lifetime.Reference Waser, Baiatu and Härdtl7, Reference Yoon, Randall and Hur18, Reference Yoon, Randall and Hur19, Reference Waser and Hagenbeck21 The grain size reduction creates more grain boundary depletion space charge layers to limit the transport of the oxygen vacancies  $({\rm{V}}_{\rm{O}} ^{ \bullet \bullet } )$.Reference Vollmann and Waser10, Reference Waser and Hagenbeck21 More recently, it was also reported that the actual effective acceptor concentration and thereby
 ${\rm{V}}_{\rm{O}} ^{ \bullet \bullet }$ concentration in the grain decreases by the reduction in grain size, and thus, the improved degradation resistance with the fine grain dielectrics, is the result of a decrease in the effective acceptor concentration in the grain as well as the increase of the number of grain boundaries between the anode and cathode.Reference Yoon, Randall and Hur18, Reference Yoon, Randall and Hur19
From the compositional design, rare earth elements, such as Y, Dy, Ho, erbium (Er), etc., are well known to greatly improve reliability of acceptor-doped BaTiO3 dielectrics.Reference Hennings1–Reference Sakabe, Hamaji, Sano and Wada6 Incorporation of variable-valence acceptors, i.e., transition metal elements, such as Mn, Cr, Fe, Ni etc., was also demonstrated to show much better reliability compared with the fixed valence acceptors, such as Al, Mg etc.Reference Waser, Baiatu and Härdtl8, Reference Morita, Mizuno, Chazono, Kishi, Yang, Liu, Dicky and Randall22 in spite of being in the same class of acceptors. Concerning the effect of calcium (Ca) incorporation in BaTiO3, there is some controversy. Earlier papers reported that Ca-doped BaTiO3 could exhibit enhanced reliability compared with undoped BaTiO3 due to the lattice shrinkage and the increase of the enthalpy of reduction.Reference Sakabe, Wada, Hiramatsu and Tonogaki24, Reference Sakabe and Takagi25 However, a recent study showed that Ca incorporation into Ba-site had little influence on the ionic conduction evaluated by Warburg impedance, and thus resistance degradation behavior.Reference Yoon, Kang, Kwon and Hur26
Another one of the widely used elements to modify dielectric properties of BaTiO3 is zirconium (Zr).Reference Hennings, Schnell and Simon27–Reference Dobal, Dixit, Katiyar, Yu, Guo and Bhalla30 However, the reports that studied its influence on the electrical conduction and resistance degradation are very limited. Recently, it was reported that the resistance degradation of Zr-doped BaTiO3 bulk ceramics was limited by the incorporation of Zr, which was explained by the observed behavior of the sharp increase of band gap and enthalpy of reduction that is supposed to significantly decrease oxygen vacancy concentration.Reference Levi31 Therefore, Zr-doped BaTiO3 instead of BaTiO3 as the base powder of MLCC dielectrics might improve the possibility of enhanced reliability of MLCC. In this study, the effect of Zr incorporation in BaTiO3 on the electrical, ionic conduction and resistance degradation was investigated utilizing alternating current (AC) impedance analysis. In addition, prototype MLCCs were prepared using these Ba(Ti1−yZry)O3 base powders and formulated X5R additives of commercial application, and estimated the possibility of the improvement of reliability when Ba(Ti1−yZry)O3 is applied instead of BaTiO3.
II. EXPERIMENTAL PROCEDURES
Zr-doped BaTiO3 [Ba(Ti1−yZry)O3] base-powders were prepared by solid-state reaction method. The starting materials were barium carbonate (BaCO3) (BW-KT, Sakai Chemical Co. Ltd., Osaka, Japan), zirconium (IV) oxide or zirconium dioxide (ZrO2) (TZ25, Terio Co. Ltd., Quindao, China), and titanium (IV) oxide or titanium dioxide (TiO2) (F4, Showadenko Co. Ltd., Chigasakai, Japan). The designed powder compositions were Ba(Ti1−yZry)TiO3 with Ti-site incorporation of Zr, where y were 0, 0.02, 0.04, 0.06, 0.08, and 0.1 respectively. Each lot of starting materials for Zr-doped BaTiO3 powders were weighed based on the designed composition and mixed by beads-milling in an ethanol solution with a dispersant (BYK-103, BYK Chemie, GmbH, Wesel, Germany). These mixed powder slurries were dried at 150 °C. After this, these dried powders were calcined for 2 h at 950–1100 °C in air with a heating rate of 10 °C/min. The average particle sizes of all of these Zr-doped BaTiO3 base-powders were strictly controlled to be ∼200 nm by careful control of calcination temperature and calcinations loading amount. The Zr concentrations of synthesized powders were checked by x-ray fluorescence (XRF; model No. RIX-2000, Rigaku, Tokyo, Japan) analysis, and there were little deviations from the designed values. Absence of second phase was also confirmed from x-ray diffraction (XRD; diffractor model No. RINT 2200HF, Rigaku, Tokyo, Japan) analysis.
These Ba(Ti1−yZry)O3 base-powders were mixed with sintering aid of 0.4 mol% silicon dioxide (SiO2) and 0.5 mol% titanium dioxide (TiO2) by ball-milling in an ethanol/toluene (50/50) solution with a dispersant (BYK-103, BYK Chemie, GmbH, Wesel, Germany) for 12 h to prepare bulk ceramics. After this, an organic binder solution (Polyvinyl Acetal Resin) was added and ball-milled again for 15 h. These slurries were separated from the zirconia media and tape-cast into green sheets to ∼10 μm thickness. Bulk ceramics with ∼0.8 mm thickness were made by stacking, pressing, and cutting the green sheets. The compacts underwent a binder-burned out process. Coarse-grained samples with the grain size of about 24–45 μm were obtained by firing at 1300 °C for 2 h in a pO2 of ∼10−8.4 atm (H2/N2/H2O atmosphere, 1%H2/99%N2) followed by a reoxidation annealing at 1000 °C for 5 h in N2 atmosphere (pO2 = ∼10−6 atm), which is similar to the conventional BME MLCC sintering condition. Electrodes for the measurement of impedance and electrical resistance of the bulk ceramic samples were prepared by deposition of platinum (Pt) film through sputtering.
Prototype Ni inner electrode-MLCC samples comprising 19 dielectric layers, of size 3.2 × 1.6 mm and thickness about 2.5 μm were also prepared. In this case, Ba(Ti1−yZry)O3 base powders were mixed with formulated X5R additives of commercial application that included yttrium (III) oxide (Y2O3), magnesium oxide (MgO), barium carbonate (BaCO3), silicon dioxide (SiO2), aluminum oxide (Al2O3) and manganese dioxide (MnO2) for the dielectrics of cast sheet. The preparation for the casting slurries followed the same manner as mentioned above for the bulk ceramics. Standard multilayer process of casting, screen-printing of Ni-electrode on the green sheets, stacking, pressing, and cutting was applied. These green MLCC chips were binder-burned out, and sintered at 1180 °C for 2 h in a pO2 of ∼10−9.7 atm (H2/N2/H2O atmosphere, 1%H2/99%N2) followed by reoxidation annealing at 1000 °C for 3 h in N2 atmosphere (pO2 = ∼10−6 atm). Terminal copper (Cu) electrodes were formed on both ends of the chips by dipping into Cu-paste and heat-treatment at 800 °C.
The electrical resistances were measured by two-point probe method, using a source-measure unit (Model 237, Keithley Instruments, Cleveland, OH). The behaviors of resistance degradation of coarse-grained bulk ceramic specimens were measured at the temperature of 200 °C by applying voltage steps of direct current (DC) field 50 up to 500 V/mm, and those of MLCC specimens were measured at 150 °C by applying voltage steps of DC field 5 up to 60 V/μm, respectively. The time duration for each voltage step was 10 min and resistance was measured every 5 s. The impedance data were measured by a impedance/gain phase analyzer (Solartron 1260, Farnborough, Hampshire, UK) with a dielectric interface (Solartron 1296, Farnborough, Hampshire, UK) over frequencies from 5 mHz to 1 MHz in a temperature range of 150–540 °C. The evaluation of each resistance (R), capacitance (C) component value for a properly assumed equivalent RC circuit and data analysis was carried out using EQUIVALENT CIRCUIT (Ver 3.97) software,Reference Boukamp32 which extracts R, Q (constant phase element) and n (the relaxational distribution parameter ranging from zero to unity) by a nonlinear least squares (NLLS) fitting.
The microstructures of bulk ceramics and MLCCs were observed using field emission scanning electron microscopy (FESEM; Model ULTRAPLUS, Carl Zeiss SMT GmbH, Oberkochen, Germany). The average intercept length was obtained and then multiplied by 1.776 to estimate the average grain size.Reference Han and Kim33
III. RESULTS AND DISCUSSIONS
A. Microstructures of sintered Ba(Ti1−yZry)O3 bulk ceramics
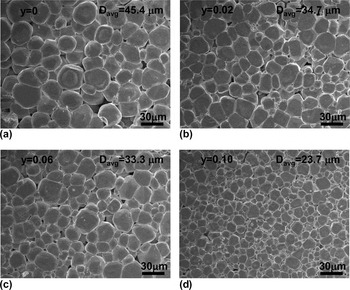
Figures 1(a)–1(d) show microstructures of Ba(Ti1−yZry)TiO3 ceramics with coarse grains that were sintered at 1300 °C in a pO2 of ∼10−8.4 atm (H2/N2/H2O atmosphere, 1%H2/99%N2) followed by a reoxidation annealing at 1000 °C for 5 h in N2 atmosphere (pO2 = ∼10−6 atm). All of the Ba(Ti1−yZry)TiO3 specimens in the range of 0 ≤ y ≤ 0.1 show significant grain growth, where the grain sizes of samples for y = 0, 0.02–0.06, and 0.08–0.1 were about 45, 34, and 24 μm, respectively. The grain size of 10 mol% Zr-doped BaTiO3 (y = 0.1) specimen is somewhat smaller than that of the specimen of y = 0, but still maintains coarse grains and the difference is less than 2-fold. It is important to compare under similar condition of the microstructure as shown in Fig. 1 for studying exclusively the Zr concentration effect on the resistance degradation, as the grain size also has a significant effect on degradation behavior.Reference Waser, Baiatu and Härdtl7, Reference Yoon, Randall and Hur18, Reference Yoon, Randall and Hur19, Reference Waser and Hagenbeck21
Microstructures of Ba(Ti1−yZry) TiO3 bulk ceramics that were sintered at 1300 °C in a pO2 of ∼10−8.4 atm (H2/N2/H2O atmosphere, 1%H2/99%N2) followed by a reoxidation annealing at 1000 °C for 5 h in N2 atmosphere (pO2 = ∼10−6 atm): (a) y = 0, (b) y = 0.02, (c) y = 0.06, and (d) y = 0.1.

B. Resistance degradation behavior of Ba(Ti1−yZry)O3 bulk ceramics
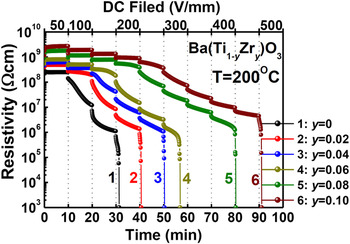
Figure 2 shows electrical resistivity at high temperature under DC field versus time for the Ba(Ti1−yZry)TiO3 coarse-grained bulk ceramics. The resistivities were measured at the temperature of 200 °C by applying voltage steps of DC field from 50 up to 500 V/mm. The behavior of resistance degradation is observed to be more and more improved with the increase of Zr concentration, i.e., the resistance value becomes more stable and the time and electric field of the loss of resistance increased. The improved degradation behavior of the sample No.4 (y = 0.06) compared with No.2 (y = 0.02), where the grain sizes are almost the same compared with each other, definitely demonstrate the increased Zr concentration effect. Thus, it is supposed that Zr incorporation has the effect to inhibit resistance degradation in these coarse grained ceramic specimens and thus caused the result of Fig. 2.
Electrical resistivity at high temperature under DC field versus time for the Ba(Ti1−yZry)TiO3 coarse-grained bulk ceramics that were sintered at 1300 °C in a pO2 of ∼10−8.4 atm (H2/N2/H2O atmosphere, 1%H2/99%N2) followed by a reoxidation annealing at 1000 °C for 5 h in N2 atmosphere (pO2 = ∼10−6 atm).

C. Impedance spectroscopy analysis for Ba(Ti1−yZry)O3 bulk ceramics
To investigate the variation of the electrical properties of grain and grain boundary with increasing Zr concentration for the coarse grained Ba(Ti1−yZry)O3 bulk ceramic specimens, an impedance spectroscopy analysis was applied. The details for the evaluation of grain conductivity (σg), grain boundary conductivity (σgb), and potential barrier height of grain boundary (ΔφGB) are described elsewhere.Reference Yoon, Randall and Hur16–Reference Yoon, Randall and Hur18, Reference Guo and Maier34–Reference Fleig, Rodwald and Maier37
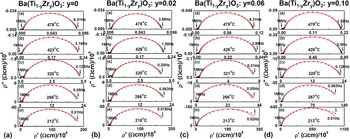
Figures 3(a)–3(d) show a series of complex impedance plane plots of measured (open circles) and fitted (red line) data for several temperatures of the Ba(Ti1−yZry)O3 bulk ceramic specimens for y = 0, 0.02, 0.06, and 0.1, respectively. The impedance data were measured at roughly 50 °C interval in a temperature range of 150–540 °C, and represented in units of resistivity (Ω-cm). Two RC responses can be identified in all temperature ranges for all specimens, although the semicircle in the high-frequency range is much smaller than that in the low-frequency range so that it may not easy to be distinguished. The fitted data also demonstrate 2 RC responses of the impedance data. The big semicircle in the low-frequency range is associated with the grain boundary RC network, and the small semicircle in the high-frequency range is related to the grain RC network.
Complex impedance plane plots of measured (open circles) and fitted (red line) data for several temperatures of the Ba(Ti1−yZry)O3 bulk ceramic specimens: (a) y = 0, (b) y = 0.02, (c) y = 0.06, and (d) y = 0.1, respectively.

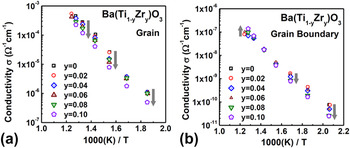
Figures 4(a) and 4(b) show the grain conductivity (σg) and the grain boundary conductivity (σgb) versus inverse absolute temperature for the Ba(Ti1−yZry)O3 bulk ceramic specimens with different Zr concentrations. Both the grain and grain boundary conductivity of all specimens roughly show an Arrhenius-type behavior. The tendency can be observed that the grain conductivity (σg) decreases with the increase of Zr concentration for all measurement temperatures as indicated by the arrows in Fig. 4(a). The difference is less than about 1/2 order of magnitude between the samples of y = 0 and y = 0.1. The activation energies of the grain conductivity [E σ(g)] evaluated from the slopes of log σg versus 1000(K)/T plot of Fig. 4(a) were about 0.95 eV showing almost similar values each other irrespective of Zr concentration. In an undoped or very low concentration of acceptor-doped BaTiO3, the ionic transference number was reported to be less than 0.1,Reference Yoon, Randall and Hur16, Reference Yoon, Randall and Hur18 which means the electrical conduction is predominantly governed by electronic carriers. In such a case, the activation energy of the bulk electrical conduction is determined by the ionization energy acceptors.Reference Yoon, Randall and Hur38 Therefore, it is supposed that the ionization energies of background acceptors in Ba(Ti1−yZry)O3 bulk ceramic specimens are not influenced by Zr concentration.
(a) Grain conductivity (σg), and (b) grain boundary conductivity (σgb) versus inverse absolute temperature for the Ba(Ti1−yZry)O3 bulk ceramic specimens with different Zr concentrations (y).

On the other hand, the evaluated activation energies of the grain boundary conductivity [E σ(gb)] from Fig. 4(b) increased with the increase of Zr concentration ranging from 0.83 eV for the sample of y = 0–1.0 eV for the sample of y = 0.1. It is reported that the activation energy of the grain boundary conductivity [E σ(gb)] has the following relationReference Rodwald, Fleig and Maier39:
 $$E_\sigma _{(gb)} = E_{\rm{\sigma }} _{{\rm{(g)}}} + e\Delta \phi _{GB} - kT + {{d\Delta \phi _{GB} } \over {{\rm{d}}(1/kT)}}\left( {{e \over {kT}} - {1 \over {{\rm{\Delta }}\phi _{{\rm{GB}}} }}} \right),$$
where ΔφGB is grain boundary potential barrier height. Therefore, it is supposed that the observed effect of Zr concentration on E σ(gb) is associated with its influence on ΔφGB and additional terms of temperature dependence of ΔφGB.
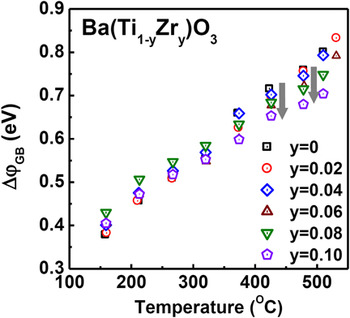
Figure 5 shows grain boundary potential barrier height (ΔφGB) versus temperature for the Ba(Ti1−yZry)O3 bulk ceramic specimens for different Zr concentrations. In the low-temperature range, e.g., 213 °C, which is close to the test temperature of resistance degradation of Ba(Ti1−yZry)O3 bulk ceramic specimens in this study, distinct difference of ΔφGB by the variation Zr concentration is not observed showing similar values for each other ranging from 0.46 to 0.5 eV. In the high-temperature range of 478 and 510 °C, the barrier height ΔφGB slightly decreases with the increase of Zr concentration as indicated by the arrows in Fig. 5. Considering that the barrier height (ΔφGB) is determined by the ratio of grain and grain boundary conductivity (σg/σgb),Reference Fleig, Rodwald and Maier37 such behavior may be predicted by the behavior of E σ(g) and E σ(gb) with the increase of Zr concentration as shown in Figs. 4(a) and 4(b). It should be noted that the correlation between resistance degradation and ΔφGB can hardly be identified. Whereas it is known that ΔφGB has significant effect on the electrical conduction under the low electric field condition,Reference Souza40 its significant influence on the degradation behavior is not observed where ΔφGB is supposed to be negligible under high electric field condition.Reference Yoon, Randall and Hur16–Reference Yoon, Randall and Hur18
Grain boundary potential barrier height (ΔφGB) versus temperature for the Ba(Ti1−yZry)O3 bulk ceramic specimens for different Zr concentrations (y).

D. The behavior of ionic conduction of Ba(Ti1−yZry)O3 bulk ceramics
It is known that complex impedance response of a mixed conductor system with selectively blocking electrodes can show high-frequency semicircles of grain and grain boundary contributions followed by a low-frequency Warburg element, which is originated from the combination of electrode capacitance by the blocked charge species at the electrode interface and the chemical capacitance caused by the stoichiometric polarization.Reference Jamnik and Maier41, Reference Jamnik and Maier42 If grain boundaries are selectively blocking, the similar Warburg element might also occur even under the condition of the completely nonblocking electrode.Reference Jamnik, Guo and Maier43
The intersection of the low-frequency part of the grain boundary semicircle of impedance response on the real axis is the sum of the bulk grain and grain boundary resistance of the total carrier species (R tot = R gtot + R GBtot). If the electrode provides an ion blocking, as is the case in this study, the zero-frequency intersection of the impedance response on the real axis is the sum of the bulk grain and grain boundary resistance of the nonblocked species of electronic carrier (R eon = R geon + R GBeon). The resistance of total carrier species can then be expressed as
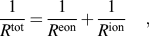 $${1 \over {R^{{\rm{tot}}} }} = {1 \over {R^{{\rm{eon}}} }} + {1 \over {R^{{\rm{ion}}} }}\quad,$$
where R ion is the sum of the bulk grain and grain boundary resistance of the blocked species of ionic carrier. From Eq. (2), the ionic transference number, t ion can be determined viz.
 $$t_{{\rm{ion}}} = {{\sigma _{{\rm{ion}}} } \over {\sigma _{{\rm{tot}}} }} = {{R^{{\rm{tot}}} } \over {R^{{\rm{ion}}} }} = {{R^{{\rm{eon}}} - R^{{\rm{tot}}} } \over {R^{{\rm{eon}}} }},$$
where σion and σtot are the conductivity of ionic species and the conductivity of total carrier species, respectively.
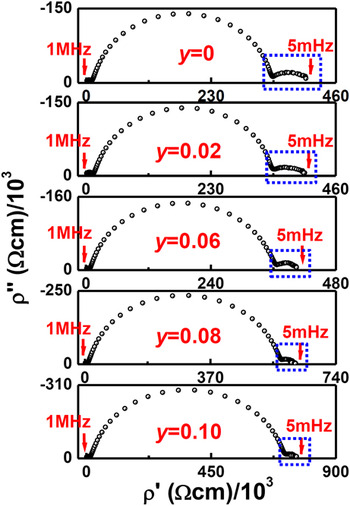
Figure 6 shows a series of complex impedance plane plots, including a low-frequency Warburg impedance indicated by dotted box that were measured at 428 °C for the Ba(Ti1−yZry)O3 bulk ceramic specimens. The grain impedances of all specimens are too small in the high-frequency range, and grain boundary impedances and finite Warburg impedances are clearly observed. The magnitude of Warburg impedance systematically decreases with the increase of Zr concentration. The estimated ionic transference numbers, t ion using Eq. (3) were roughly 0.15, 0.14, 0.10, 0.07, and 0.05 for the specimen of y = 0, 0.02, 0.06, 0.08, and 0.10, respectively. A decrease of the grain conductivity shown in Fig. 4(a) and of the ionic conduction contribution, i.e., t ion, shown in Fig. 6, corresponds to a decrease in the oxygen vacancy concentration  $[{\rm{V}}_{\rm{O}} ^{ \bullet \bullet } ]$ with the increase of Zr concentration. This in turn also directly scales to resistance degradation behavior depending on Zr concentration in Ba(Ti1−yZry)O3 bulk ceramic specimens.
A series of complex impedance plane plots, including a low-frequency Warburg impedance indicated by dotted box that were measured at 428 °C for the Ba(Ti1−yZry)O3 bulk ceramic specimens with y = 0, 0.02, 0.06, 0.08, and 0.1, respectively.

E. Evaluation of the possibility for the improvement of reliability of the prototype MLCC by applying Ba(Ti1−yZry)O3 base powder
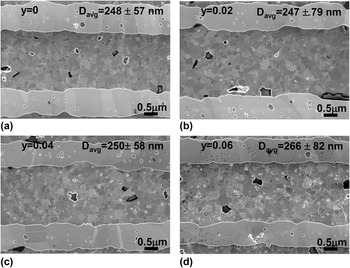
The above results of Zr incorporation effect in the Ba(Ti1−yZry)O3 bulk ceramics offer the possibility that Ba(Ti1−yZry)O3 instead of BaTiO3 as the base powder of MLCC dielectrics might improve the reliability of MLCC. The prototype MLCCs were prepared using these Ba(Ti1−yZry)O3 base powders and formulated X5R additives of commercial application, and estimated resistance degradation behavior for the specimens of y = 0, 0.02, 0.04, 0.06, where grain sizes of dielectrics are almost similar each other. The specimens of y = 0.08 and 0.1 were excluded because the same microstructure as the specimen of y = 0–0.06 could not be obtained in this study. Figures 7(a)–7(d) show microstructures of X5R additives-doped Ba(Ti1−yZry)TiO3 prototype MLCC samples that were sintered at 1180 °C for 2 h in a pO2 of ∼10−9.7 atm (H2/N2/H2O atmosphere, 1%H2/99%N2) followed by reoxidation annealing at 1000 °C for 3 h in N2 atmosphere (pO2 = ∼10−5 atm). Two Ni-inner electrodes and a dielectric layer can be clearly discerned, where the thickness of dielectric layer is about 2.5 μm. The grain sizes of the samples of y = 0, 0.02, 0.04, and 0.06 range 247–266 nm which is almost the same as each other. Under the same grain size condition, resistance degradation behavior was compared.
Microstructures of the prototype MLCC samples of X5R additives-doped Ba(Ti1–yZry)TiO3 that were sintered at 1180 °C for 2 h in a pO2 of ∼10−9.7 atm (H2/N2/H2O atmosphere, 1%H2/99%N2) followed by reoxidation annealing at 1000 °C for 3 h in N2 atmosphere (pO2 = ∼10−6 atm): (a) y = 0, (b) y = 0.02, (c) y = 0.04, and (d) y = 0.06, respectively.

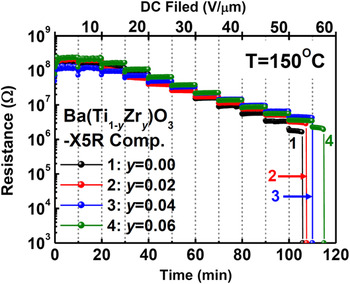
Figure 8 shows electrical resistivity at high temperature under DC field versus time for the X5R additives-doped Ba(Ti1−yZry)TiO3 prototype MLCC samples. The resistivities were measured at the temperature of 150 °C by applying voltage steps of DC field from 5 up to 60 V/μm, and most representative data for each sample were plotted to avoid confusion. The sample of No. 1 (y = 0), No. 2 (y = 0.02) and No. 3 (y = 0.04) show resistance drop under the electric field of 55 V/μm, and the samples of No. 4 (y = 0.06) does under 60 V/μm respectively. Although it may be described that the sample of No. 4 (y = 0.06) exhibits a slightly improved behavior of resistance degradation compared with the sample of No. 1 (y = 0), the difference is not so significant as observed in Fig. 2 for the Ba(Ti1−yZry)O3 bulk ceramics, where about 2-fold difference in the electric field strength for the resistance drop was observed between the samples of y = 0 and y = 0.06. It is supposed that the influence of additives on the resistance degradation is far more significant and thus far outweighs the effect of relative difference in the ionic conduction of Ba(Ti1−yZry)O3 under the MLCC test condition where the applied electric field strength is much higher than those for the coarse-grained bulk ceramics.
Electrical resistivity at high temperature under DC field versus time for the prototype MLCC samples of X5R additives-doped Ba(Ti1−yZry)TiO3 for y = 0, 0.02, 0.04, and 0.06, respectively, that were sintered at 1180 °C in a pO2 of ∼10−9.7 atm (H2/N2/H2O atmosphere, 1%H2/99%N2) followed by a reoxidation annealing at 1000 °C for 3 h in N2 atmosphere (pO2 = ∼10−6 atm).

A cautious interpretation of these results suggest that the resistance degradation of MLCC under such high electric field might not be explained by only oxygen vacancy-related behavior alone. It is known that the electrical conduction of insulating materials is determined by trapping/detrapping phenomena of charge carriers at trap sites under high electric field condition, where the injection of free charge carriers occurs from electrodes into dielectrics.Reference Kao44 The abrupt increase of leakage current, i.e., resistance degradation occurs when the concentration of injected charge carriers exceeds the density of available trap sites. Besides oxygen vacancy, the crucial role of electron/hole trap sites and their efficiency in controlling resistance degradation was also reported recently in comparison of the resistance degradation between Mg-doped and Mn-doped BaTiO3 ceramics.Reference Yoon, Randall and Hur45 In our preliminary study for these prototype MLCCs the impedance data showed only one distorted semicircle due to fine grain sizes and Warburg impedance could not be observed, which made it difficult to utilize impedance analysis. The studies of current (I) – voltage (V) characteristics and thermally stimulated depolarization current are under way to understand the resistance degradation of these prototype MLCCs under such high electric field condition.
IV. SUMMARY AND CONCLUSIONS
The behavior of the resistance degradation showed a systematic change toward slower degradation rates with the increase of the Zr concentration (y) in Ba(Ti1−yZry)O3 coarse-grained bulk ceramics. The impedance analysis showed that this behavior was caused by a decrease of the grain conductivity (σg) and ionic conduction contribution associated with oxygen vacancy concentration  $[{\rm{V}}_{\rm{O}} ^{ \bullet \bullet } ]$ in the grain with the increase of Zr concentration for the similar grain size series. These results also correspond well the reported phenomenon of the increase of the enthalpy of reduction by Zr incorporation.
On the other hand, the prototype MLCC samples fabricated by applying these Ba(Ti1−yZry)O3 base powders and formulated X5R additives did not show such distinct difference in degradation behavior with the variation of Zr concentration as had occurred in Ba(Ti1−yZry)O3 bulk ceramics, although a slight improvement might be observed by the increase of Zr concentration. It is supposed that the influence of additives on the resistance degradation is far more significant and thus far outweighs the effect of relative difference in the ionic conduction of Ba(Ti1−yZry)O3. Therefore, besides oxygen vacancy concentration  $[{\rm{V}}_{\rm{O}} ^{ \bullet \bullet } ]$ yet another factor such as trapping/detrapping phenomena of charge carriers at trap sites are also believed to have a crucial role in controlling resistance degradation under MLCC test condition of the extremely high electric field, where the injection of free charge carriers occurs from electrodes into dielectrics.