Introduction
Outdoor or organic farming is becoming a more widespread way of keeping chickens. This type of farming demands robust chickens that are able to combat common environmentally caused infections before they spread to the flock. Years of selection in battery systems with a very high level of hygiene have reduced the selection pressure on defence mechanisms towards pathogens, herein the micro-organisms transmitted via manure. This type of selection may have compromised the immunological robustness of chickens of today.
One way of preparing chickens to a life in environments where they are subjected to natural levels of infection pressure could be to prime the immunological system of the chickens at an early stage of life with micro-organisms that they will encounter later in life.
For correct function, the immune system must learn from the environment. As suggested by Rook and Stanford (Reference Rook and Stanford1998), only exposure to the right immunogens will keep the alertness of the immune system ‘in shape’, and educate/stimulate all compartments of the immune system correctly. Thus, it is important for the immune system to be introduced to micro-organisms that enhance cytokine production at a natural level, and to enhance immunity not only through antibody production, but also through cellular pathways.
However, several investigations in chickens (Hangalapura et al., Reference Hangalapura, Nieuwland, de Vries Reilingh, Heetkamp, Van den Brand, Kemp and Parmentier2003, Reference Hangalapura, Nieuwland, de Vries Reilingh, Van den Brand, Kemp and Parmentier2004 and Reference Hangalapura, Kaiser, Poel, Parmentier and Lamont2006; Mujahid et al., Reference Mujahid, Sato, Akiba and Toyomizu2006; Star et al., 2006; El-Lethey et al., Reference El-Lethey, Huber-Eicher and Jungi2003) and in mice (Viswanathan et al., Reference Viswanathan, Daugherty and Dhabhar2005; Dhabhar and Viswanathan, Reference Dhabhar and Viswanathan2005) demonstrated that also stressful situations affect the immune system, but depending on the severity and the extension of the stress situation, various types of stress can be beneficial or detrimental to the immune system. Although it was difficult to assess a consistent definition of short-term acute stress, the results of almost all of the published investigations were that acute stress in chickens seemed to stimulate different compartments of the immune system (Hangalapura et al., Reference Hangalapura, Kaiser, Poel, Parmentier and Lamont2006; Mujahid et al., Reference Mujahid, Sato, Akiba and Toyomizu2006) while stress of a more chronic character would inhibit parts of the immune system (El-Lethey et al., Reference El-Lethey, Huber-Eicher and Jungi2003; Hangalapura et al., Reference Hangalapura, Nieuwland, de Vries Reilingh, Van den Brand, Kemp and Parmentier2004; Star et al., 2006).
In chickens it is well known that the major stress hormone is corticosterone, and in Reference Gross and Siegel1983, Gross and Siegel found that increased corticosterone levels altered the distribution of heterophils and lymphocytes in peripheral blood. Furthermore, chronic stress with elevated corticosterone levels was shown to be immunosuppressive (El-Lethey et al., Reference El-Lethey, Huber-Eicher and Jungi2003). The immunosuppressive effect of corticosterone was probably caused directly by the corticosterone levels or by the changes in sensibility to corticosterone in different cell types.
It was our hypothesis that an appropriate development of natural defence mechanisms can be achieved by applying small doses of infective material to the chicken flock as well as by a short-term non-infectious stimulation of the immune system, which would be of no infectious risk.
A further hypothesis was that the reaction to the stimuli would depend on the genetic material, since breeding of the chosen strains, Babcock B380 and Hellevad, was done under intensive (at a high level of ‘biosecurity’) and more extensive (at reduced level of ‘biosecurity’) conditions, respectively.
Thus, the objective of the present study was to examine the effect of infection pressure and the effect of a non-infectious stressor or stimulus to immunologic variables in two chicken strains. The infection pressure was conducted by introducing small amounts of manure and litter from another chicken flock, while the non-infectious stressor was short-term heat stress.
The immunological variables were selected to elucidate different aspects of immunity in blood. Thus, measuring the concentration of chicken mannan-binding lectin (cMBL) in serum assessed the innate acute response to Escherichia coli, because chickens normally react to infections by elevated cMBL concentrations in serum (Juul-Madsen et al., 2002 and Reference Juul-Madsen, Munch, Handberg, Sørensen, Johnson, Norup and Jørgensen2003). The cellular immunity was reflected by the percentage (%) of CD4-positive (+) lymphocytes, and the mean fluorescence intensity (m.f.i.) of CD4 on CD4+ lymphocytes, while the humoral status was assessed by the % of MHCII-positive (+) lymphocytes and the m.f.i. of MHCII on MHCII+ lymphocytes, in addition to the level of antibodies against E. coli in serum 3 weeks post infection with E. coli.
Material and methods
Experimental chickens
The experiment was performed with layer chickens of the Hellevad and Babcock B 380 (referred to as Babcock) strains. Chickens of the Hellevad strain are a crossbreed of White Leghorn and New Hampshire (Sørensen et al., 2004).
For each trial, 500 eggs of each strain were bought, incubated and hatched at the Research Centre Foulum (University of Aarhus, Denmark).
After hatch, only females were selected for the experiment, and the day-old chickens were transferred to positive-pressure isolators. Water and commercial chicken feed were supplied ad libitum. The lighting period was 12 h daily from 0700 to 1900 h, and the chickens were subjected to a standard temperature regimen for chickens from 1 day to 9 weeks of age gradually declining from 34°C at hatch to 21°C at 32 days of age. From the 32nd day, the temperature was kept at 21°C.
Culture of E. coli inoculum
A mixture of three E. coli strains, O2, O11 and O78, and all strains were isolated from herds with outbreaks of colisepticaemia. The mixture was used for inoculation and prepared as follows. Each of the E. coli strains was cultured for 4 to 5 h at 37°C in Bacto™ Veal Infusion Broth (Becton Dickinson, Le Pont-De-Claix, Cedex, France), centrifuged at 17 000 × g at 4°C for 15 min, and resuspended in 0.9% NaCl. A mixture consisting of the three isotypes of E. coli with a concentration of 108 colony-forming units per ml was prepared.
Experimental infections and design
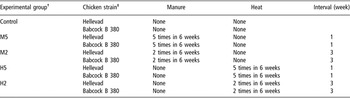
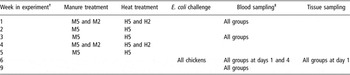
The experimental infections were performed in two independent, identical replicates at different times, each including 150 Babcock and 150 Hellevad chickens. The chickens were allocated at random to five groups of 30 birds and placed in 10 isolators. For the first 6 weeks, the chickens were subjected to one of the experimental groups as shown in Table 1. Chickens were subjected to either (A) nothing for the first 6 weeks (the control group) or (B) a mild infection pressure by putting a fixed amount of manure and litter from another chicken flock into the isolator, two (M2) or five (M5) times during the first 6 weeks or (C) a mild stress by heating up the isolator to 8°C higher than the normal cage temperature for 2 h, two (H2) or five (H5) times during the first 6 weeks. Manure and litter for mild infection pressure originated form a flock with access to outdoor areas, and it was stored untreated at room temperature during the first 6 weeks of each experiment. The dose was 175 cm3 at each treatment. The manure was tested on blood agar and MacConkey agar. On blood agar, a wide variety of bacteria was seen (hemolytic and non-hemolytic) and on the MacConkey agar, a large number of E. coli colonies was seen. At 6 weeks of age, all chickens were inoculated orally and nasally with 1 ml of E. coli inoculum (0.5 ml was placed in the mouth and 0.5 ml was added as drops distributed equally between each nostril) at days 1, 2 and 3. An outline of the experimental period is shown in Table 2. The experiment was terminated after 9 weeks.
Treatment in each of the experimental groups

†The experimental groups were allocated to different isolation chambers between the two trials to minimise the effect of isolation chamber.
‡Chickens of the Hellevad and the Babcock B 380 strains were allocated to different isolation chambers.
Specification of times for treatment and sampling in each of the experimental groups

†All chickens were assessed to their respective isolation chamber at week 0.
‡At weeks 1 and 3, blood sampls were taken in advance of conducting the treatments.
The experiment was originally performed in three replicates, but due to technical problems in the isolation chambers a whole replicate was ruled out.
Blood, serum and tissue samples
Blood samples stabilised with citrate (0.5 ml), and samples for serum (0.5 ml) were collected from 5 birds per replica, in each group at the age of 1, 3, 6 and 9 weeks, and the blood sampled chickens were weighed. At 6 weeks of age, serum samples were collected at day 1 (before challenge with E. coli) and at day 4 (after the E. coli challenge). All samples were taken between 0800 and 1000 h, and the same chickens were followed throughout the experiment. To assure that no E. coli infection was present in the chicken groups prior to the E. coli challenge, five chickens from each group were killed at week 6. The left lung was aseptically removed from those chickens, and the tissue was placed in sterile NaCl 0.9%. The lungs were shredded with scissors and mixed for 2 min in sterile Steriblend bags (Bibby Sterilin, Staffordshire, UK) on a BagMixer (Interscience, St Nom la Breteche, France) before they were tested in culture on blood agar and MacConkey agar (Merck, Darmstadt, Germany) for the presence of E. coli. Autopsies were conducted on accidentally dead chickens.
ELISA measurements of serum MBL
The measurement of cMBL in chicken serum was performed as described by Norup and Juul-Madsen (Reference Norup and Juul-Madsen2007). Micro-titre wells (Maxisorp, Nunc, Roskilde, Denmark) were coated with anti-chicken cMBL Ab (HYB 182-01, AntibodyShop, Gentofte, Denmark) in phosphate-buffered saline (PBS). After coating, wells were blocked by using Tween 20. Following washing, the serum samples diluted in tris-buffered saline (TBS) containing Ca2+ were added. As a standard, a two-fold dilution series of a normal chicken serum (7.1 μg cMBL per ml) was used. After incubation and washing, the wells received biotinylated mouse anti-cMBL (HYB 182-01) in TBS. After further incubation and washing, horseradish peroxidase (HRP)-conjugated streptavidin (P0397, Dako, Glostrup, Denmark) diluted in TBS was added. The presence of HRP was determined by adding a substrate solution of TMB (<0.05% w/w 3,3′,5,5″ tetramethylbenzidin). Colour development was stopped with 100 μl H2SO4 and the absorbance at 450 nm was read with the absorbance at 650 nm as a reference. Intra- and inter-assay variations were 7.3% and 7.6%, respectively, for the high serum control, and 4.7% and 10.6%, respectively, for the low serum control.
Flow cytometry
Flow cytometry was conducted on blood samples collected at 1, 3, 6 and 9 weeks of age. Isolation of mononuclear cells from citrate-stabilised blood samples was performed according to the manufacturer’s procedure using Lymphoprep™ 1.077 (Gibco BRL, Life Technologies, Gaithersburg, MD, USA). The mononuclear cells were washed and resuspended in RPMI medium without pH indicator (Gibco BRL, Life Technologies), but containing 2% foetal bovine serum (Gibco BRL, Life Technologies). Cells were counted and diluted to a final concentration of 1 × 10⁷ cells/ml. For the flow cytometric analysis, we used 50 μl cells from each sample in a total volume of 200 μl FACS-buffer (0.2% BSA, 0.2% sodium azide, 0.05% horse serum in PBS pH = 7.4). The primary antibody incubation was performed for 15 min at 4°C.
The antibodies were anti-chicken B-Lβ (2G-11) and anti-chicken CD4 (fluorescein isothiocyanate (FITC)-conjugated CT4). Since the anti-chicken B-Lβ antibody was unlabelled, a secondary antibody incubation was performed in a total volume of 150 μl FACS-buffer containing FITC-labelled goat F(ab′)2 fragment anti-mouse immunoglobulin G (IgG) (H + L) (Coulter Immunotech, Miami, FL, USA), diluted 1 : 50 for 15 min in darkness at 4°C. The 2G-11 antibody was kindly donated by K. Skjødt, Odense, Denmark, CT4 was obtained from the Southern Biotechnology Associates, Inc. (Birmingham, AL, USA) and the secondary antibody was obtained from Coulter Immunotech (Miami, FL, USA). Samples were analysed on a Coulter Epics flow cytometer with excitation at 488 nm from an argon laser. Analytic gates were chosen based on forward and side scatters to include small lymphocytes and exclude debris, dead cells and erythrocytes. Flow cytometer alignment verification was performed using Flow-Check™ Fluorospheres (Abbott Laboratories, Abbott Park, IL, USA), and day-to-day standardisation of the flow cytometer was performed using Uniform Dyed Microspheres (0.96 μm; Coulter Immunotech). For each of the protocols, control samples without any antibody and with secondary antibody were run.
ELISA measurement of serum E. coli antibody titres
Micro-titre wells (Maxisorp) were coated with 100 μl of sonicated E. coli (mixture of the three strains O2, O11 and O78) suspended in a carbonate buffer of 15 mmol/l Na2CO3, 35 mmol/l NaHCO3, pH 9.6 (a stock of sonicated E. coli with an optical density, OD600/1 cm at 1.63 diluted 1 : 30). After incubation overnight at 4°C, residual protein-binding sites were blocked by 200 μl PBS containing 1% (w/v) bovine serum albumin (BSA) in 130 mmol/l NaCl, 9.6 mmol/l Na2 HPO4·2H2O, 2.2 mmol/l KH2PO4, pH 7.4 (PBS) for at least 1 h at room temperature. Following washing in 200 μl PBS containing BSA 0.05% (w/v) (PBS-BSA), 100 μl diluted serum in PBS-BSA was added to the wells. Wells receiving only buffer were used as negative controls, and as standard a dilution series of a serum, selected on the basis of a high OD, was used (units are given arbitrarily in proportion to this serum). All dilutions were added in duplicate. After incubation for 1 h 30 min at room temperature and washing in PBS-BSA, the wells received 10 ng HRP-conjugated goat anti-chicken IgG (AA129P; Serotec, Oxford, UK) in 100 μl PBS-BSA. Upon further incubation for 1 h and washing using PBS-BSA, the presence of HRP was determined by adding 100 μl of substrate solution (<0.0 5% w/w 3,3′,5,5″ tetramethylbenzidin). Colour development was stopped with a 1 mol/l solution of H2SO4 and determined by reading the absorbance at 450 nm with absorbance at 650 nm as a reference.
To be certain that all antibodies bound were specific for E. coli, serum samples were prepared in a non-precipitated and a precipitated version. Serum was precipitated with a suspension of sonicated E. coli (0.7 μl E. coli stock per μl serum), incubated for 1 h at room temperature followed by centrifugation (17 000 × g for 15 min, 20°C). All titres were calculated from the standard curve, and the actual antibody titre for each sample was thereafter calculated as the difference between the non-precipitated and the precipitated titre value. Intra- and inter-assay variations were 8.5 and 12.1, respectively, for the high E. coli Ab serum control and 6.3 and 9.0, respectively, for the low E. coli Ab serum control.
Statistical analysis
As indicated in section Experimental infections and design, the experiment was originally performed in three replicates, but the third replicate was excluded in the statistical analysis. All variables were subjected to analysis of variance via linear normal mixed models with multiple error terms in the statistical package PROC MIXED (Statistical Analysis Systems Institute, 1996) using maximum likelihood for parameter estimation. To obtain homogenous variance, the variables, cMBL, E. coli antibody titre and body weight, were transformed by the logarithmic transformation. Individual measurements were used as experimental units.
All immune variables were analysed by a model including the following general fixed effects: strain, treatment group, week in the experiment and, optionally, the interaction between these effects if they were significant. Except for the E. coli antibody titre where no initial level was measured, the initial level at week 1 of the dependent variable was included as covariate as were all significant two-, three- and four-way interactions with the general fixed effects. For variables where an initial level existed, replicates and the interaction between replicates, strain and treatment group were used as random effects. This was modelled by using a random regression approach at the isolator-level (as subject) with random intercept and slope with respect to the initial level of the dependent variable at week 1. In the design, the Isolator level was identical to the interaction between replicate, strain and treatment group. The model for the variables, cMBL and E. coli antibody titre, included only the random intercept.
Week was treated as repeated measurements using a heterogeneous autoregressive covariance structure. If resulting in an improved fit statistics (AIC), the residual variance was assumed different for each treatment group, strain or the interaction between treatment groups and strain. This was modelled using the repeated statement of PROC MIXED with the actual effect as a GROUP factor.
Body weight was analysed by a comparable model with respect to the fixed and random effects but without the repeated level as only the initial and ending point were used. This models only included replicate and the interaction between replicate, strain and treatment group as random effects.
Due to unbalanced data material as a result of missing observations, Satterthwaite’s approximation was used in all models. The missing observations were due to a low number of samples that coagulated before the analysis was performed, or due to difficulties in blood collection from some animals. Results of the analysis with the mixed procedure are given in F-value and the degree of freedom for the investigated effect (df1), of the error term in the denominator (df2), and the P-value. A P-value at 0.05 was chosen as level of significance. Pairwise comparisons belonging to effects are presented by the P value. All means presented are least-square means and standard error. All analyses were performed as two-tailed tests.
Results
All results, except the antibody titre and the body weight, are corrected according to the values for each chicken at week 1, and therefore results in the figures are only shown for the weeks 3 to 9.
Body weight
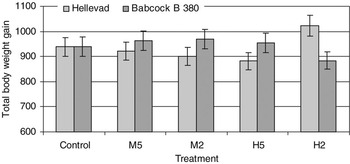
The body weight gain from 1 to 9 weeks of age was calculated (Figure 1), and within each chicken strain there were no difference between the weights in each treatment group at the first week of age. Strain and treatment interacted significantly on the body weight gain (F (4,81) = 4.73, P = 0.0018). The Hellevad strain tended to have an elevated body weight gain in the H2 group (P = 0.0532) and the Babcock had a slightly, but not significantly, depressed body weight gain in the H2 group compared with their respective control treatment. Consequently, chickens of the Hellevad strain had a significantly higher body weight gain in the H2 group than chickens of the Babcock strain (P = 0.0034, Figure 1). In addition, H2 in both strains differed or tended to differ from the remaining treatment groups (P < 0.075).
Body weight gain calculated from 1 to 9 weeks of age. Total body weight gain was calculated for chickens in each treatment group for both the Hellevad and the Babcock B 380 strains. Bars indicate ±s.e. (n = 40 per column).

Mannan-binding lectin
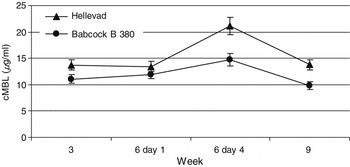
The basic MBL level in serum was measured at 1 to 9 weeks of age (Figure 2). A significant chicken strain × week interaction was seen (F (3,339) = 4.96, P = 0.0022). The cMBL level in Hellevad was higher than in Babcock throughout the whole experiment (P ⩽ 0.0325, Figure 2). A significant increase was seen in the serum cMBL level in both strains from the day of infection to 4 days after the first dose of E. coli was given (P < 0.0001), with the apparently largest increase in the Hellevad strain (55% up-regulation), whereas Babcock up-regulated with 35% only (Figure 2).
Serum cMBL concentration in Hellevad and Babcock B380 chickens throughout the experiment. At week 6, serum samples were collected at day 1 before onset of E. coli challenge, and at day 4 after the first dose of E. coli was given. Bars indicate ±s.e. (n = 50 per time point).

There tended to be an interaction between chicken strain and treatment on the level of cMBL (F (4,9) = 3.10, P = 0.0729). The cMBL level differed between breeds in all treatments except treatment H2 (P ⩽ 0.0271). In treatment H2, cMBL of the Hellevad chickens was slightly but non-significantly decreased compared with the control group, whereas cMBL of Babcock chickens was increased (P = 0.0296), and therefore the difference between breeds disappeared in this treatment (results not shown).
Immuno-phenotyping by flow cytometry
The presence of two surface molecules (CD4 and MHC II) and their m.f.i. in lymphocytes was determined by flow cytometry at weeks 1 to 9.
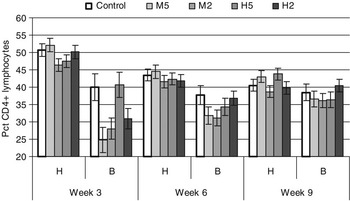
In the % of CD4+ lymphocytes, a significant interaction was present between chicken strain, treatment, week and initial level at week 1 (F (8,207) = 2.89, P = 0.0046, Figure 3). If the % of CD4+ lymphocytes in chickens was at an average level at week 1, the % of CD4+ differed significantly between Hellevad and Babcock in all treatment groups at weeks 3 and 6 with treatment H5 at week 3 as an exception (P ⩽ 0.0343). In general, Hellevad was the breed having the highest proportion of lymphocytes being CD4+ (Figure 3). At the end of the experiment (week 9), differences between the two chicken strains was reduced to include the M5 and the H5 groups only (P < 0.006), and for these groups the differences had become less pronounced. No significant differences were seen between controls and treatments for the Hellevad strain, but at week 3 a significant difference between treatments M5 and M2 (P = 0.0154) and between M5 and H5 (P = 0.0386) was seen. For the Babcock strain, on the other hand, the proportion of CD4+ lymphocytes tended to be or was significantly reduced in treatments M5, M2 and H2 at week 3 and M5 and M2 at week 6 compared with the control (P ⩽ 0.0656). Chickens of the Hellevad strain had a higher proportion of CD4+ lymphocytes at week 3 than at weeks 6 and 9 in all treatment groups (P ⩽ 0.0167). Chickens of the Babcock strain, on the other hand, did not differ between weeks in the control group while the proportion of CD4+ lymphocytes increased with time in groups M5, M2 and H2 as well as from week 3 to week 6 in H5 (P ⩽ 0.0358).
Percentage of lymphocytes stained positive for CD4 shown for Hellevad (H) and Babcock B 380 (B) chickens in each treatment group at each week. At week 6, the samples were collected at day 1 (i.e. pre-challenge) Bars indicate ±s.e. (n = 10 per column).

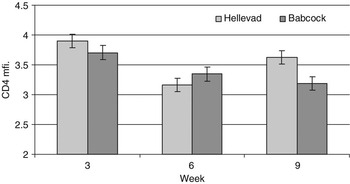
For the m.f.i. of CD4 on CD4+ cells, significant interactions were found between chicken strain, week and the m.f.i. at week 1 (F (2,230) = 5.91, P = 0.0032, Figure 4) as well as between treatment and week (F (8,230) = 2.05, P = 0.0419). When the m.f.i. of CD4 on CD4+ lyphocytes was at an average level at week 1, the m.f.i. in the two chicken strains differed significantly at all weeks. Hellevad had the highest m.f.i. of CD4 on CD4+ cells at weeks 3 and 9, and Babcock had the highest m.f.i. of CD4 on CD4+ cells at week 6 (P ⩽ 0.0006, Figure 4).
Mean fluorescence intensity (m.f.i.) of CD4 on CD4+ lymphocytes in all chickens of each strain at each week. At week 6, the samples were collected at day 1 (i.e. pre-challenge). Bars indicate ±s.e. (n = 50 per column).

In the H2 group, m.f.i. of CD4 on CD4+ cells was significantly lower at week 6 than in the control group, as was also the case in the M5 group at week 9 (P ⩽ 0.0295). Furthermore, the M2 and H2 groups tended to be lower than the control group at week 9 (P ⩽ 0.084 – results not shown).
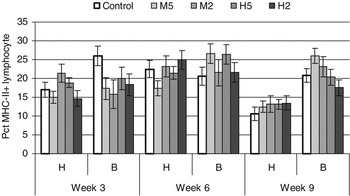
In the % of MHCII+ lymphocytes, a significant interaction was seen between chicken strains, treatments and week (Figure 5, F (8,214) = 2.61, P = 0.0097). The % of MHCII+ lymphocytes differed significantly between Hellevad and Babcock in all treatment groups at week 9, with H2 as an exception (P ⩽ 0.0214). At weeks 3 and 6, onlythe control group and the M5 group, respectively, differed significantly between breeds (P ⩽ 0.0158). Generally, Babcock was the breed with the highest proportion of their lymphocytes being MHCII+ (Figure 5). Only for chickens of the Babcock strain, significant differences between treatment groups and control group were found. The % of MHCII+ lymphocytes of treatments M5, M2 and H2 were significantly lower than in the control group at week 3 (P ⩽ 0.0494), the M5 and the H5 treatments tended to have higher % of MHCII+ lymphocytes than the control group at week 6 (P ⩽ 0.0987)), whereas only the M5 group tended to have a higher proportion of MHCII+ lymphocytes than the control group at week 9 (P = 0.0532).
Percentage of lymphocytes stained positive for MHC-II showed for Hellevad (H) and Babcock B 380 (B) in each treatment group at each week. At week 6, the samples were collected at day 1 (i.e. pre-challenge). Bars indicate ±s.e. (n = 10 per column).

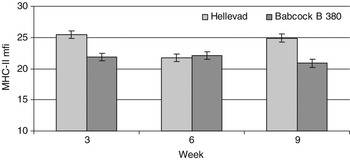
A significant interaction between chicken strain and week was found for the m.f.i. of MHCII on MHCII+ cells (F (2,239) = 53.35, P < 0.0001, Figure 6). At weeks 3 and 9, the two chicken strains differed significantly with Hellevad having the highest m.f.i. of MHCII+ (P < 0.0001), but at week 6 this difference was absent.
Mean fluorescence intensity (m.f.i.) of MHCII+ lymphocytes in all chickens of each strain at each week. At week 6, the samples were collected at day 1 (i.e. pre-challenge). Bars indicate ±s.e. (n = 50 for each column).

E. coli antibody titres
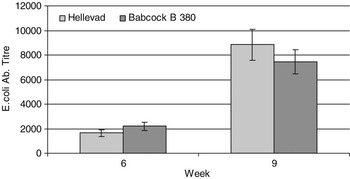
E. coli antibody titres were measured at weeks 6 and 9 of the experiment, but no significant effect of treatment was found. On the other hand, chicken strain and week were found to interact significantly (F (1,176) = 8.46, P = 0.0041, Figure 7). Both strains increased the antibody titre from week 6 to week 9 (P < 0.0001) and the strains tended to differ at week 6 (P = 0.0878), but not at week 9.
E. coli antibody titres at 6 and 9 weeks of age for chickens of the Hellevad and the Babcock B 380 strains. At week 6, the samples were collected at day 1 (i.e. pre-challenge). Bars indicate ±s.e. (n = 50 per column).

Discussion
The present results confirm that mildly infectious as well as non-infectious stressors affect the immune system of chickens, especially the cellular response. However, differences existed between strains in the response to the same stimuli. Overall, Hellevad chickens seemed to adapt at some level to non-infectious or weak stimuli more quickly and to be more discriminative with respect to stimuli they have the possibility to respond to. Chickens of the Babcock breed responded more in the proportion of CD4 lymphocytes to infectious as well as non-infectious stimuli although they adapted to the stimuli with time, especially if stimulation occurred frequently. The strains also differed in the balance between indicators of immunity, Hellevad being relatively more competent in showing a cMBL and CD4 lymphocyte response than Babcock.
The body weight gain was only slightly influenced by treatments as the gentle kind of stress performed in treatment H2 only caused a weak suppression of the body weight gain in the Babcock strain compared with the Hellevad strain. Normally stress, and especially stress for longer periods (Hangalapura et al., Reference Hangalapura, Nieuwland, de Vries Reilingh, Heetkamp, Van den Brand, Kemp and Parmentier2003), has a negative impact on body weight gain, which may be a consequence of elevated corticosterone levels. It has been shown that feeding corticosterone to chickens reduces body weight gain (Post et al., Reference Post, Rebel and ter Huurne2003).
The positive body weight gain in Hellevad chickens in treatment H2 in the present experiment might be caused by a reduced level of corticosterone or by reduced sensitivity to corticosterone as a reaction to the gentle stressor. The results indicate improved adaptability to infrequent non-infectious stress in Hellevad chickens.
In the present study, chickens of both the Hellevad strain and the Babcock strain up-regulated the level of cMBL in serum significantly in response to infection with E. coli. Chickens of the Hellevad strain up-regulated the cMBL level with 55% while only a 35% up-regulation was seen for chickens of the Babcock strain, although Hellevad had a higher basic cMBL level than Babcock. In contrast to this, Juul-Madsen et al. (2004) found that cMBL was up-regulated more in a strain with a low basic cMBL level than in a strain with a high basic cMBL level as a reaction to infection with infectious bronchitis virus (IBV). The difference in reaction to these infectious agents may be based on differences in the agents, bacterial v. viral infection, and/or differences in the way of infection.
In humans, the acute-phase-protein MBL is known to be able to bind to a series of infectious agents as long as certain carbohydrate structures are present on their surface. Through binding studies human MBL has been shown to bind E. coli (Shang et al., Reference Shang, Chen, Shen, Yu and Wang2005). Also, chicken MBL is regarded as an acute-phase protein, but to the authors’ knowledge no binding studies have been performed with cMBL, although it was shown that cMBL is normally up-regulated as a reaction to various infections (Juul-Madsen et al., 2002 and 2004; Nielsen et al., Reference Nielsen, Jensenius, Jørgensen and Laursen1999; Laursen and Nielsen, Reference Laursen and Nielsen2000).
In the present study, the distribution of T-helper cells and B-cells differed between the two chicken strains, which may reflect differences in the ability of the immune system to produce a specific cellular or humoral immune response, although several other components are involved in these response pathways. Chickens of the Hellevad strain were shown to have a higher proportion of CD4+ T-cells at weeks 3 and 6 and a lower proportion of MHCII+ cells (Figure 3) than chickens of the Babcock strain in the control groups. Therefore it would seem that Hellevad, compared with Babcock, had a better capacity for a cellular action at the expense of a reduced ability to produce antibodies against infectious agents or acting humorally.
In general, Hellevad chickens did not change the % of CD4+ cells in peripheral blood in response to treatments or with time (Figure 3) compared with the control group, but Hellevad chickens experiencing treatment M2 had a significantly lower % of lymphocytes being CD4+ than those experiencing treatment M5 at week 3, which is after 1 and 2 repeated manure exposures, respectively. Chickens in the M2 group had recently experienced their first exposure (to manure) and down-regulated the amount of CD4+ cells in response to this, while the M5 group – having already experienced the exposure once and perhaps finding it ‘harmless’, did not react again.
On the other hand, Babcock reacted not only to treatments of potentially infectious character, M5 and M2 at weeks 3 and 6, but also to a stress treatment, H2 at week 3, all by down-regulating the % of CD4+ lymphocytes in peripheral blood. A redistribution of CD4+ and CD8+ lymphocytes in peripheral blood, similar to what was found in Babcock, has been seen in an earlier study (Trout and Mashaly, Reference Trout and Mashaly1994) where both the CD4+ and CD8+ lymphocyte populations were down-regulated as a consequence of a more vigorous heat stress than conducted in the present experiment.
The % of MHCII+ lymphocytes did not change in reaction to treatments in the Hellevad strain, but was reduced in all treatment groups at week 9 (3 weeks after the E. coli infection). In contrast to this, chickens of the Babcock strain again reacted to the treatment groups M5, M2 and H2 at week 3 by a significant reduction in the % of MHCII+ lymphocytes compared with the control group. At week 6, Babcock chickens had elevated MHCII+ lymphocyte % in the treatment groups M5 and H5 compared with the control group, and at week 9 this elevation was only found for treatment M5.
In redistribution of the lymphocyte populations (CD4+ and MHCII+ lymphocytes), chickens of the Babcock strain were clearly more reactive to treatments both of potentially infectious character and to mild and rare non-infectious treatments than Hellevad, but seemed to be able to adapt to these stressful treatments over time, especially if the treatment were frequent. On the other hand, chickens of the Hellevad type did not redistribute the lymphocyte populations, which may indicate that immune reactions, especially to stressful situations of short duration are highly dependent on chicken strain as also indicated by Hangalapura et al. (Reference Hangalapura, Nieuwland, de Vries Reilingh, Van den Brand, Kemp and Parmentier2004).
The m.f.i. of CD4 on CD4+ lymphocytes (Figure 4) and of MHCII on MHCII+ lymphocytes (Figure 6) was measured. In both cases, there was no effect of treatments, but chickens of the Hellevad strain down-regulated m.f.i. of both CD4 and MHCII significantly from week 3 to week 6, but significantly up-regulated m.f.i. again after the E. coli infection. In contrast to this, m.f.i. of the two surface molecules in Babcock chickens did not differ with time or after infection with E. coli. This may indicate either an improved competence of fine-tuning or a too labile immune system in Hellevad chickens. In light of previous suggestions that trade-off between immunity and other life traits such as body weight gain may occur (Hangalapura et al., Reference Hangalapura, Nieuwland, de Vries Reilingh, Van den Brand, Kemp and Parmentier2004), the response of Hellevad may be interpreted as due to the way of selection, Hellevad chickens ‘save energy’ and only spend resources when necessary.
As Babcock was the strain with the highest % of MHCII+ lymphocytes, they were expected to be able to produce a higher level of specific antibodies against E. coli. However, this was not the case, as there was no significant difference in E. coli antibody titres between the chicken strains 3 weeks after infection. Others have found that stress (El-Lethey et al., Reference El-Lethey, Huber-Eicher and Jungi2003) and the major stress hormone, corticosterone (Post et al., Reference Post, Rebel and ter Huurne2003), influence antibody responses. However, this was dependent on the antigen tested (El-Lethey et al., Reference El-Lethey, Huber-Eicher and Jungi2003) suggesting that the antigen tested in the present study might be of a stress-resistant character, or that the antigen load has actually been too small to provoke the humoral differences or that the increase in MHCII+ lymphocytes reflected an increased activation of T-cells rather than an increased % of B-cells.
The present experiment is in agreement with an earlier study on cold stress (Hangalapura et al., Reference Hangalapura, Nieuwland, de Vries Reilingh, Van den Brand, Kemp and Parmentier2004) that found that the cellular response was more sensitive, especially to short-term stress than the humoral response, depending on the chicken line.
In conclusion, the chickens are redistributing different cell types in peripheral blood as a response not only to potentially infectious agents, but also in response to stressful non-infectious treatments. Responses to stress situations are dependent on the frequencies of stress treatments, and reaction patterns are highly dependent on chicken breed. This may reflect the superiority of one breed over another in reacting to treatments or evaluating whether a treatment is harmless or dangerous. However, the differences did not influence the disease resistance to infection with a mixture of E. coli O2, O11 and O78 in the present study.
Acknowledgements
This work was supported by the Ministry of Food, Agriculture and Fisheries, the Directorate for Food, Fisheries and Agri Buisness, the Research Centre for the Management of Animal Production and Health (CEPROS) and the Danish Ministry of Education, the Danish Council for Research Education (FUR).
The authors wish to thank Karl Petersen from the National Veterinary Institute, Technical University of Denmark for providing us with the E. coli strains.
Furthermore, we wish to thank I. M. Jepsen, L. Rosborg Dal and H. Svenstrup for their skilful help during sampling and analysis of samples. K. V. Østergaard is thanked for proofreading the manuscript.