Implications
Visual Image Analysis (VIA) primal cut yields are moderately heritable with sufficient genetic variability to allow response to selection. Primal cut yields were estimated to have strong, but not unity, genetic correlations and breeders will be able to genetically select animals that produce carcases with a greater proportion of the weight in the more valuable primal cuts. This will improve genetic progress for abattoir carcass traits as the estimated breeding values (EBVs) will be based on actual abattoir carcass data, rather than proxy traits as in the pedigree sector. As carcass traits are end of life traits these genetic parameters will also enable genomic selection to be implemented to increase genetic progress estimated early in life.
Introduction
Genetic improvement in the UK beef industry has traditionally been implemented in the purebred pedigree sector through voluntary performance recording. Genetic selection for carcass traits has been undertaken with EBVs for recorded proxy traits. Live weight at 400 days of age is a proxy for carcass weight and ultrasound scans for muscle and fat depth are proxies for carcass conformation and fat. However, due to the cost of ultrasound scanning, only a relatively small proportion of the purebred population have these carcass traits recorded (Moore et al., Reference Moore, Pritchard, Wilkinson, Mrode, Pearston, Kaseja, Wall and Coffey2014). Although genetic improvement is made in the commercial sector through the purchase of superior purebred bulls, the market signals to pedigree breeders are diluted as commercial farmers are paid based for the carcass on the EUROP classification system.
In the European Union, beef carcases are assessed using the EUROP classification system (European Council regulations 1208/81 and 2930/81). Carcases are valued per kilogram carcass weight at the base rate price (varies depending on breed, age and the animals type; steer, heifer, cow, etc.) with a penalty or premium added based on the EUROP conformation and fat class of the carcass. EUROP classification uses letters E (excellent), to P (poor) to grade conformation with particular emphasis on the round, back and shoulder. A five-point numeric scale is used to classify the amount of subcutaneous fat on the carcass and in the thoracic cavity, where the number one represents none or low fat cover and number five represents very high fat. Often the EUROP fat scale of five points is subdivided into three subclasses (−,= or +) (MLCSL, 2014).
Advances in imaging technologies such as VIA provide the opportunity to mechanically grade carcases, at line speed, for the EUROP traits but in addition for individual primal cut yields. Visual Image Analysis is still relatively new to the United Kingdom, but increasingly more abattoirs are installing VIA machines and are moving towards routinely using the technology. This creates the underlying framework to undertake genetic evaluation for individual VIA primal cut yields (Fillet, Striploin, Topside, Knuckle, Silverside and Rump) using large volumes of commercial abattoir data. In Ireland, VIA carcass traits have been investigated (Pabiou et al., Reference Pabiou, Fikse, Näsholm, Cromie, Drennan, Keane and Berry2009, Reference Pabiou, Fikse, Amer, Cromie, Näsholm and Berry2011a, Reference Pabiou, Fikse, Amer, Cromie, Näsholm and Berry2011b and Reference Pabiou, Fikse, Amer, Cromie, Näsholm and Berry2012) and found to have moderate-to-high heritabilities with strong, but not unity, positive genetic correlations between the VIA primal cuts. In these studies, carcass weight and EUROP traits conformation and fat were also considered and found to have moderate heritability. Carcass weight and EUROP conformation was estimated to have moderate-to-strong positive genetic correlations with the individual VIA primal cuts, whereas EUROP fat had moderately negative genetic correlations with the individual VIA primal cuts. Given the strong genetic correlations between the VIA primal cuts, Pabiou et al. (Reference Pabiou, Fikse, Amer, Cromie, Näsholm and Berry2011a and Reference Pabiou, Fikse, Amer, Cromie, Näsholm and Berry2011b) combined individual primal cuts into three categories based on the value of the primal cut (very high, high, medium, low). Again moderate-to-high heritabilities were estimated.
The objective of this study was to use VIA carcass information from the crossbred UK commercial prime slaughter population to estimate genetic parameters for individual primal cut yields, carcass weight and EUROP conformation and fat class to enable subsequent genetic evaluation of carcass traits.
Material and methods
Data sources
Carcass data (carcass measurements, animal identification, dates of birth and death, animal breed and type of slaughter animal (heifer, steer, young bull, mature bull or cow)) were collected from two abattoirs fitted with VBS2000 VIA machines (E+V Technology, Oranienburg, Brandenburg, Germany; http://www.eplusv.de/), installed to grade carcases at slaughter. One side of the carcass was positioned on a holding frame while a 2D (under normal lighting) and 3D (under striped lighting) image was taken by the VIA machine’s mounted digital camera using previously calibrated lighting arrangements. The resulting images are analysed using E+V software and prediction equations to predict six individual primal cuts from the hindquarter; Topside, Silverside, Striploin, Fillet, Knuckle and Rump, as well as carcass weight and the EUROP classification for conformation and fat. The predicted VIA primal cut yields were then multiplied by two to represent both sides of the carcass. Carcass weight and all six primal cut yields were estimated in kilogram, whereas EUROP conformation and fat was recorded according to EUROP standards and then recoded to a 15-point numerical scale described by Hickey et al. (Reference Hickey, Keane, Kenny, Cromie and Veerkamp2007). To increase the scale of variation the converted conformation and fat measurements was multiplied by three making the range 1 to 45.
Pedigree and additional animal information was obtained from the British Cattle Movement Service (BCMS) database, where it has been compulsory to register all dairy and beef cattle in the United Kingdom since 1996. For every animal, the BCMS database records the dam, date of birth, details of each farm movement by the animal, breed, sex and dates of death. In addition, the sire can be recorded, but is not compulsory, and is recorded in approximately a third of registered animals. Additional pedigree information was also available from the UK dairy milk recording organisations in the United Kingdom as well as the pedigree herd books for a number of different dairy and beef breeds. All sources of pedigree are consolidated to form a single UK dairy and beef ‘super pedigree’ that contains all known animals in the United Kingdom as well as all known pedigree, that is, if sire is recorded in one data source and dam in another source, the super pedigree is the only pedigree that contains both the sire and the dam.
Calculation of proportion of each breed
The animals breed is supplied in several sources of data. This is usually just a single three-letter breed code and does not enable the precise breed make up to be captured, especially of crossbreeds where all that is added is an additional ‘X’ to the three-letter breed code, and thus does not allow breed and hybrid vigour to be accounted for. Therefore, for all animals in the super pedigree the proportion of each breed (PEB) is calculated. The PEB of each animal is simply half the PEB of the sire plus half the PEB of the dam. For example, an animal with a sire that is 100% Limousin and a dam that is 50% Holstein Friesian : 50% Limousin will end up with a PEB of 75% Limousin : 25% Holstein Friesian. This approach is iterative, with parents first needing PEB calculated before progeny PEB can be computed. Where one or both parents are unknown a set of assumptions are applied to obtain an estimate of the PEB. When both parents are unknown and if the animal is included in the BASCO database (database storing pedigree and performance recording information for some beef breeds in the United Kingdom) with breed make up recorded, then the PEB is set to match the breed make up from BASCO. If the animal is not recorded in BASCO, then it is assumed to be 100% of the breed code supplied in BCMS data. In cases where one parent is known and the other is unknown, the same assumptions as above apply but with the PEB adjusted for the contribution of the known parent. For example, if the breed code in the BCMS data is Limousin, the sire is unknown and the dam is 100% Holstein Friesian then the PEB for the animal would be 50% Limousin : 50% Holstein Friesian.
Heterosis and recombination coefficients
To enable the effects of hybrid vigour to be considered in the analysis, heterosis and recombination effects were calculated for a limited number of breed ‘type’ categories. With such a large number of breeds represented in the data, it was not practical to model heterosis effects for every combination, therefore breeds were grouped into four breed types; dairy (n=27 unique breeds), native UK beef breeds (n=31 unique breeds), continental beef breeds (n=33 unique breeds) and remaining breeds (n=12 possible breeds, but there were only small numbers in the data). The PEB was then concatenated into these breed types such that a 50% Limousin : 50% Charolais would be 100% continental. For each animal and each combination of breed type (six) heterosis and recombination coefficients were computed where A and B represent the proportion of genes from the two breed types considered and s and d denote sire and dam, respectively (Van Der Werf and De Boer, Reference Van Der Werf and De Boer1989).
 $$\eqalignno{ & {\rm Heterozygosis}\,_{{{\rm AB}}} \,{\equals}\,{\rm A}_{{\rm d}} .{\rm B}_{{\rm s}} {\plus}{\rm A}_{{\rm s}} .{\rm B}_{{\rm d}} \cr & {\rm Recombination}\,{\rm loss}\,_{{{\rm AB}}} \,{\equals}\,{\rm A}_{{\rm s}} .{\rm B}_{{\rm s}} {\plus}{\rm A}_{{\rm d}} .{\rm B}_{{\rm d}} $$
Data set edits
A total of 111 394 prime slaughter commercial carcases records were available from two abattoir sites. Animals were defined as being prime slaughter if the abattoir classification was one of three categories: heifer (H), steer (S) and young bull (YB), where the abattoirs limit the ages of allowed animals into the three categories so that only prime slaughter animals are included. All animals were slaughtered between 2012 and 2014 – although one site only had kill data for a portion of 2014. Records were removed if: the sire was unknown (n=74 844); the age at slaughter was <365 days (12 months) (n=13) or >1095 days (36 months) for heifers and steers (n=1698) and >730 (24 months) for young bulls (n=44); the animal was an outlier (defined by±3 SD from the mean within sire breed and category (H; S; YB)) for any of the VIA primal cut yields, carcase weight or EUROP conformation and fat traits (n=886); the sire was not purebred (purebred defined as being 87.5+% of one breed) (n=670); the breed of the sire was from a numerically small breed (defined as breeds with <200 animals in the data set) (n=668); the animal belonged to a paternal half sib family with less than three half sibs (n=4955); the animal came from a birth herd with less than three records (n=465); the animal was in a finishing herd with less than three records (n=665); there were fewer than three animals in the birth season and herd (BSH) contemporary group, where season was defined in 4 months blocks (n=3314); the animal was in a single sire contemporary group (n=5296). After the above edits, only 111 records remained from the new VIA abattoir site, so these were removed leaving only one site in the analysis.
Final data set
After edits, 17 765 records remained from one abattoir, covering 11 different sire breeds from 660 birth herds and 668 finishing herds. Of these records there were 4758 heifers, 7642 steers and 5365 young bulls. Animals were born between February 2010 and August 2013, and slaughtered between July 2012 and September 2014. The population consisted of 1379 (7.8%) purebred animals and 16 386 (92.2%) crossbred animals. Based on the sire breed, the more numerous breeds were Charolais (25.2%), Limousin (18.8%), Simmental (18.6%), Angus (17.7%) and Holstein Friesian (10.7%). The remaining seven breeds combined accounted for 9.3% of the edited data set. A five-generation pedigree (n=87 788) was extracted from the bovine super pedigree for all animals remaining in the edited data set.
Statistical analysis
The statistical model was developed using the PROC MIXED procedure in the SAS software (SAS Institute, 2007). Fixed effects were determined from a sire model using backwards elimination to remove terms that were not significant. Significance was determined using the F test and P<0.05. First-order interactions were also fitted. The factors considered as fixed class effects were sex category (H, S or YB), BSH, finishing herd and kill season (defined as 4 months periods, starting from February). Considered as covariate effects were age at slaughter in days (linear and quadratic), dam age in days (linear and quadratic), the percentage of dairy breeds in the dam, and the heterosis and recombination coefficients for each breed type combination (described above).
For all traits sex category, BSH, finishing herd, kill season, slaughter age (linear and quadratic), linear dam age and percentage of dairy breeds in the dam were significant. Heterosis effects between the dairy, native beef and continental beef breed types were significant, but not those crosses involving the remaining breed types, most likely due to the small number of animals in the United Kingdom that cannot be grouped into the three main breed types. Recombination effects were found to be significant for dairy and native beef breed type crosses, and for most of the traits, the native beef and remaining breed type crosses. Significant first-order interactions were abattoir and sex category with the following terms; kill season, age at slaughter and percentage of dairy in the dam (i.e. abattoir×kill season, sex category×kill season, etc.). In addition, interactions between age at slaughter with percentage of dairy in the dam and dam age, and the interaction between dam age and the percentage of dairy in the dam were also found to be significant. In the case of the six primal cuts, an alternative model was also considered where carcass weight (linear and quadratic) was fitted as a covariate in addition to the model described above.
Univariate covariance components were estimated using single-trait animal models (ASReml; Gilmour et al., Reference Gilmour, Gogel, Cullis and Thompson2009). Relationships amongst animals were accounted for using a five-generation relationship matrix with unknown ancestors assigned to genetic groups as defined by the breed types used to estimate heterosis and recombination coefficients. The mixed linear model can be written as
 $${\bf{y}} \,{\equals}\,{\bf{Xb}} {\plus}{\bf{ZQg}} {\plus}{\bf{Zu}} {\plus}{\bf{e}} $$
where y is the vector of observations, b the vector of fixed effects, g the vector of genetic groups, u the vector of random effects, e the vector of residual effects and X, Z and Q matrices the respective incidence matrices. The fixed effects included in the model to estimate genetic parameters were those found to be significant as described earlier. To estimate genetic and residual covariances between the traits a series of bivariate models were undertaken using ASReml. For the primal cut yield traits, Topside, Silverside, Knuckle, Rump, Striploin and Fillet, a separate set of analyses were undertaken using the same methodology but also after adjusting for carcass weight.
Results
Phenotypic data
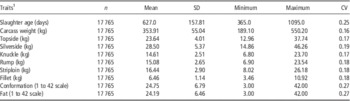
A summary of the phenotypic data is contained in Table 1. Animals were slaughtered on average at 627 days (20.5 months) of age with an average carcass weight of 354 kg. In total, the six VIA primal cut yields sum to 104.72 kg and account for 29.6% of the total carcass weight. The CV for all primal cut yields and carcass weight ranged from 0.16 to 0.19. Coefficients of variation for slaughter age, conformation class and fat score were higher ranging from 0.25 to 0.27. Average conformation and fat values were 24.75 and 24.19, respectively, corresponding to a value of R (good muscle development) for EUROP conformation class and to a value of 3 (average fat cover over the carcass with slight deposits of fat in the thoracic cavity) in the EUROP fat class.
Overall mean, SD, minimum, maximum and CV for Visual Image Analysis (VIA) carcass traits from 17 765 crossbred prime slaughter commercial cattle

1 Slaughter age is the age of the animal at slaughter; carcass weight is the weight of the carcass at slaughter; Topside, Silverside, Knuckle, Rump, Striploin and Fillet are all primal cut yields from the total carcass predicted using VIA; conformation and fat is the EUROP conformation and fat classes, predicted using VIA and converted to a numerical 1 to 42 scale; higher values represent more muscular carcases for conformation and higher levels of fat for fat.
Heritability
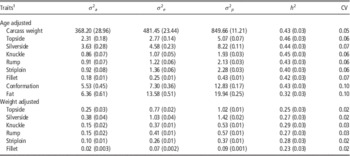
All carcass traits were moderately heritable with heritability estimates ranging from 0.32 for EUROP fat to 0.46 for the Topside primal yield (Table 2). Although the heritability estimates and genetic CV were similar for all primal cut yields, there were differences in the variances. The primal cut yield for Fillet has the lowest phenotypic variation at 0.43; it was also seen in Table 1 to be the smallest primal cut of those considered in this study. Both Topside and Silverside primal cuts were observed to be the larger primal cuts in the study and also showed the higher phenotypic variances. However, the genetic CV for all six primal yields was ~0.06. Carcass weight and EUROP conformation and fat class all had higher phenotypic variance estimates and had genetic CV of 0.05, 0.10 and 0.10, respectively. When the primal cut yields also had carcass weight fitted as a covariate in the model, heritability estimates were lower, but still moderate, ranging from 0.23 for Fillet to 0.29 for Knuckle primal cut yield. Phenotypic variances were also reduced.
Genetic, residual and phenotypic variances, trait heritability and genetic CV (standard errors in parenthesis) estimates for Visual Image Analysis (VIA) carcass traits from 17 765 crossbred prime slaughter commercial cattle

σ 2 a=genetic variance component; σ 2 e=residual variance component; σ 2 p=phenotypic variance component; h 2=heritability.
1 Carcass weight is the weight (kilogram) of the carcass at slaughter; Topside, Silverside, Knuckle, Rump, Striploin and Fillet are all primal cut yields (kilogram) predicted from the total carcass using VIA; conformation and fat is the EUROP conformation and fat classes, predicted using VIA and converted to a numerical 1 to 42 scale; higher values represent more muscular carcases for conformation and higher levels of fat for fat.
Genetic and phenotypic correlations
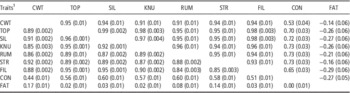
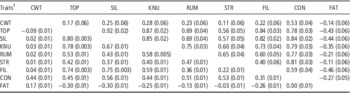
Strong positive genetic correlations between carcass weight and all the primal cut yields were estimated when traits were age adjusted (Table 3). These correlations were much reduced and only low to moderate in size when the primal cut yields were also adjusted for carcass weight (Table 4). Strong positive phenotypic correlations between these traits were also estimated, but once primal cut yields were adjusted for carcass weight, phenotypic correlations were not significantly different from zero.
Genetic (above diagonal) and phenotypic (below diagonal) correlations estimates (standard errors in parenthesis) for age adjusted Visual Image Analysis (VIA) primal cut yield carcass traits from 17 765 crossbred prime slaughter commercial cattle

CWT=carcass weight; TOP=Topside; SIL=Silverside; KNU=Knuckle; RUM=Rump; STR=Striploin; FIL=Fillet; CON=conformation; FAT=fat.
1 CWT is the weight (kilogram) of the carcass at slaughter; TOP, SIL, KNU, RUM, STR and FIL are all primal cut yields (kilogram) predicted from the total carcass using VIA; CON and FAT is the EUROP conformation and fat classes, predicted using VIA and converted to a numerical 1 to 42 scale; higher values represent more muscular carcases for CON and higher levels of fat for FAT.
Genetic (above diagonal) and phenotypic (below diagonal) correlations estimates (standard errors in parenthesis) for age and weight adjusted Visual Image Analysis (VIA) primal cut yield carcass traits from 17 765 crossbred prime slaughter commercial cattle

CWT=carcass weight; TOP=Topside; SIL=Silverside; KNU=Knuckle; RUM=Rump; STR=Striploin; FIL=Fillet; CON=conformation; FAT=fat.
1 CWT is the weight (kilogram) of the carcass at slaughter; TOP, SIL, KNU, RUM, STR and FIL are all primal cut yields (kilogram) predicted from the total carcass using VIA; CON and FAT is the EUROP conformation and fat classes, predicted using VIA and converted to a numerical 1 to 42 scale; higher values represent more muscular carcases for CON and higher levels of fat for FAT.
All six primal cut yields had strong positive – almost unity – genetic correlations to each other when adjusted for slaughter age. When the primal cut yields were also adjusted for carcass weight, the strength of the correlations reduced, but was still strong and positive; genetic correlations ranged from 0.40 between Fillet and Striploin to 0.92 between Topside and Silverside. This same trend can be observed with estimates of the phenotypic correlations; when the primal cut yields were adjusted for slaughter age and carcass weight phenotypic correlations ranged from 0.22 between Fillet and Striploin to 0.80 between Topside and Silverside.
EUROP conformation was estimated to have a moderate positive genetic correlation with carcass weight, and strong positive genetic correlations with the primal cut yields (regardless of whether carcass weight was adjusted for). A moderate negative genetic correlation was estimated with EUROP fat. In all cases, EUROP fat was estimated to have low-to-moderate negative genetic correlations with carcass weight and the primal cut yields. Generally, the size of the genetic correlations with primal cut yields increased when they were adjusted for carcass weight. Moderate positive phenotypic trends were estimated between EUROP conformation, and carcass weight and primal cut yields (regardless of whether primal cut yields were adjusted for carcass weight). Generally, the phenotypic correlations between EUROP fat and the other traits were not significantly different from zero or were low and negative. After adjusting for carcass weight, the phenotypic correlations between EUROP fat and the primal cut yields were low and negative. All correlation estimates show that animals that have genetically heavier carcases will also have increased primal cut yields, increased muscling of the carcass and decreased subcutaneous fat.
Discussion
The objective of this study was to estimate genetic parameters for abattoir VIA primal cut yields of UK commercial crossbred animals and determine if the traits are suitable for genetic evaluation. This was the first study in the United Kingdom estimating genetic parameters from large numbers of commercial cattle with VIA carcass traits recorded. Outside of the United Kingdom, there has only been a small number of studies estimating genetic parameters for individual carcass cut yield (Cantet et al., 2003; Pabiou et al., Reference Pabiou, Fikse, Näsholm, Cromie, Drennan, Keane and Berry2009) or with traits predicted from digital imaging (Pabiou et al., Reference Pabiou, Fikse, Amer, Cromie, Näsholm and Berry2011a). With 17 765 carcass records, this study is one of the largest studies to consider primal cut yields with most studies having <1000 animals (Cantet et al., 2003; Pabiou et al., Reference Pabiou, Fikse, Näsholm, Cromie, Drennan, Keane and Berry2009 and Reference Pabiou, Fikse, Amer, Cromie, Näsholm and Berry2011b) and only one other sizable data set with Pabiou et al. (Reference Pabiou, Fikse, Amer, Cromie, Näsholm and Berry2011a) analysing 52 722 carcases.
The UK beef industry consists of many different breeds with 94% of the prime slaughter population being crossbred and through cross-breeding, dairy genetics contributes 28% of the genes in the prime slaughter population (Todd et al., Reference Todd, Woolliams and Roughsedge2011). The data set used in this study was reflective of the prime slaughter population described by Todd et al. (Reference Todd, Woolliams and Roughsedge2011). In the edited data set the average carcass weight of 354 kg was similar to the 2013 national average of 341 kg reported by EBLEX (Reference Cantet, Pedro Steibel, Birchmeier and Santa Coloma2014).
Heritability estimates were reported in Table 2. The six primal cut yields were estimated to have moderate heritabilities in both models considered in this study. Adjusting for carcass weight reduced the heritability and phenotypic variance estimates of primal cut yields. However, the primal cut yields were adjusted for carcass weight to avoid encouraging the industry to select for larger animals, instead setting a breeding objective of increasing the proportion of weight in valuable primal cut yields for a given carcass weight means more valuable carcases and not just bigger carcases. Estimates in this study were comparable with those reported in the literature. Pabiou et al. (Reference Pabiou, Fikse, Näsholm, Cromie, Drennan, Keane and Berry2009) considered carcass dissection data from an experimental (n=413) and a commercial (n=635) data set similar to the UK data set used in this study. The primal cut yields were adjusted for age and heritability estimates in the experimental data set ranged from 0.14 (0.16) for Rib roast to 0.86 (0.23) for the Round primal cut. Similarly, in the commercial data set heritability of hind quarter cuts ranged from 0.40 (0.19) for Rib roast to 0.63 (0.20) for Fillet. In a much larger commercial data set, Pabiou et al. (Reference Pabiou, Fikse, Amer, Cromie, Näsholm and Berry2011a) estimated heritabilities ranging from 0.17 (0.018) for very high value cuts (Rib roast, Striploin and Fillet) to 0.40 (0.024) for high value cuts (Sirloin and the round) predicted from VIA. This same study considered the traits separately for heifers and steers and heritability estimates were generally higher for heifers and showed strong positive genetic correlations between the sexes (correlations ranged from 0.54 (0.14) to 0.76 (0.07)).
There have been more studies reported for carcass weight and EUROP conformation and fat. The moderate heritability estimated for carcass weight is similar to the average estimate of 0.40 reported by Utrera and Van Vleck (Reference Utrera and Van Vleck2004) from a review of 56 studies. Hickey et al. (Reference Hickey, Keane, Kenny, Cromie and Veerkamp2007) reported carcass weight heritability estimates from a number of different breeds in the Irish population ranging from 0.17 in Angus and Belgian Blue cattle to 0.65 in Charolais cattle. In a Finland study considering five beef cattle breeds, carcass weight heritability estimates ranged from 0.39 to 0.48 (Kause et al., Reference Kause, Mikkola, Stranden and Sirkko2015). A moderate heritability was estimated for both EUROP conformation and fat class, and these estimates are similar to those reported by Pabiou et al. (Reference Pabiou, Fikse, Amer, Cromie, Näsholm and Berry2011a). In a Swedish population, Eriksson et al. (Reference Eriksson, Näsholm, Johansson and Philipsson2003) estimated heritability for conformation of 0.22 in Hereford and 0.34 in Charolais. In the same study, heritability estimates for carcass fat were 0.38 and 0.27 for Charolais and Hereford, respectively. In Finland, Kause et al. (Reference Kause, Mikkola, Stranden and Sirkko2015) estimated heritabilities of between 0.30 to 0.44 for conformation and 0.29 to 0.44 for fat. The study by Hickey et al. (Reference Hickey, Keane, Kenny, Cromie and Veerkamp2007) showed a wide variation in carcass conformation and fat heritability estimates across the breeds considered. For carcass conformation, heritabilities ranged from 0.04 for Friesian to 0.36 for Limousin. For carcass fat, heritability estimates ranged from 0.00 for Limousin to 0.40 for Simmental.
This study found that there were moderate-to-strong genetic correlations between the carcass traits analysed (Tables 3 and 4). Carcass weight was found to be strongly positively correlated with carcass conformation (0.53) and negatively correlated with carcass fat (−0.14). Conformation and fat were also had a moderately negative correlation (−0.27). Pabiou et al. (Reference Pabiou, Fikse, Amer, Cromie, Näsholm and Berry2011a) also found these genetic relationships in steers, although with a lower genetic correlation between carcass weight and conformation (0.35). Hickey et al. (Reference Hickey, Keane, Kenny, Cromie and Veerkamp2007) found positive genetic correlations between carcass weight and conformation (0.11) but, in contrast to our findings, estimated positive genetic correlation between carcass weight and fat (0.26), and between conformation and fat (0.44). Kause et al. (Reference Kause, Mikkola, Stranden and Sirkko2015) also estimated positive correlations between carcass weight and fat with genetic correlation estimates ranging from 0.08 to 0.28. In agreement with our results, other studies also found positive genetic correlations between conformation and carcass weight, with values ranging from 0.25 to 0.66 (Van Der Werf and De Boer, Reference Van Der Werf and De Boer1989; Hirooka et al., Reference Hirooka, Groen and Matsumoto1996; Liinamo et al., Reference Liinamo, Ojala and van Arendonk1999; Parkkonen et al., Reference Parkkonen, Liinamo and Ojala2000; Kause et al., Reference Kause, Mikkola, Stranden and Sirkko2015) in dairy and dual purpose cattle herds.
Very strong, almost unity, genetic correlations (0.92+) were estimated between the VIA primal cut yields. Adjusting for carcass weight reduced the correlations with estimates ranging from 0.40 between Fillet and Striploin to 0.92 between Topside and Silverside. These strong positive correlations suggests that selection pressure for a given primal cut will result in increased yields for all six primal cuts, but as carcase weight has been adjusted for in the model, selection will not indirectly select for heavier carcase weights. High positive genetic correlations were also estimated by Pabiou et al. (Reference Pabiou, Fikse, Näsholm, Cromie, Drennan, Keane and Berry2009) from dissection carcass data with estimates ranging from 0.67 between Fillet and Striploin to 0.93 between Fillet and Round. Using predicted yields Pabiou et al. (Reference Pabiou, Fikse, Amer, Cromie, Näsholm and Berry2011a) estimated genetic correlations ranging from 0.45 between low value cuts and medium value cuts to 0.89 between high value cuts and very high value cuts.
Predictions based on digital imaging depend on having accurate prediction equations, which are often protected IP due to commercial sensitivity. Inaccurate prediction equations would increase noise and error into the analysis, and reduce the proportion of additive variance that can estimated and the effectiveness of genetic selection programmes. The technology has been shown to be capable of accurate predictions. The abattoirs with VIA machines installed in this study are licenced with the Rural Payments Agency to mechanically grade carcases for EUROP conformation and fat classes. Pabiou et al. (Reference Pabiou, Fikse, Amer, Cromie, Näsholm and Berry2011b) demonstrated R 2 values of 0.65 for predictions of low value cuts in heifers to 0.93 for predictions of high value cuts in steers using carcass weight and VIA information.
As a result of this study, the United Kingdom has implemented models that adjust primal yields by age and carcass weight to breed animals that are more muscular for their carcass weight and meet carcass specifications at optimal age of slaughter.
Acknowledgements
The authors gratefully acknowledge funding from Innovate UK and BBSRC, as well as the industry partners Anglo Beef Processors and the British Limousin Cattle Society (Project Reference 100971: Utilising sequence data and genomics to improve novel carcass traits in beef cattle), and Rural payments Agency’s for access to BCMS data. The authors also acknowledge Samantha Wilkinson and Juan Nani for assisting in the preliminary analysis.