INTRODUCTION
The integrity of species living in fragmented or patchy habitats is maintained by movements of individuals and gene flow across their geographical range (Morjan and Rieseberg, Reference Morjan and Rieseberg2004). Dispersal is often the main driver of gene flow, with poor dispersers generally showing greater genetic structure across their range (Avise, Reference Avise2000; Riginos et al. Reference Riginos, Douglas, Jin, Shanahan and Treml2011). The mobility and dispersal potential of organisms is often positively correlated with their body size (Shurin et al. Reference Shurin, Cottenie and Hillebrand2009), suggesting that small-bodied organisms are poorer dispersers and therefore show more pronounced genetic structure across their range.
General patterns of genetic structure in parasite populations and realized connectivity are yet to be investigated, despite the fact that gene flow in parasites impacts local adaptation, epidemiological processes and the spread of diseases. Nadler (Reference Nadler1995) proposed that both parasite and host factors could explain the genetic make-up of parasite populations. Parasites are generally very small, which should limit their dispersal potential. On the other hand, if they exploit mobile hosts as part of their life cycle, they may hitch rides and achieve dispersal disproportionate to their body sizes. Trematodes are an ideal group in which to test the hypothesis that parasite population structure is primarily determined by host mobility. Practically all trematodes use an aquatic snail as first intermediate host; they then require one or two additional hosts to complete one generation of their life cycle. The free-living infective stages of trematodes are microscopic and short-lived, therefore incapable of dispersal on any large spatial scale. Snails have extremely limited mobility on a geographical scale, and because their planktonic stages are never infected, they cannot act as vehicles of trematode dispersal. The other hosts in the life cycle may all be aquatic, i.e. invertebrates, amphibians or fish, in which case the life cycle is completed ‘locally’ (autogenic life cycle; sensu Esch et al. Reference Esch, Kennedy, Bush and Aho1988). Alternatively, the final host may be a bird or mammal, and therefore allow passage of parasites from one aquatic locality to another (allogenic life cycle). Two studies have compared trematode species with different types of life cycle but sharing one host, and found that the mobility of the final host may indeed shape patterns of genetic structure (Criscione and Blouin, Reference Criscione and Blouin2004; Blasco-Costa et al. Reference Blasco-Costa, Waters and Poulin2012).
Here, we test the universality of this finding across all trematode species for which data are available. We use the commonly reported fixation index, Fst, as a measure of population genetic differentiation. We take into account potentially confounding variables, such as the type of genetic marker used, the number of localities sampled per study, or the maximum geographic distance between them. The latter, a measure of spatial scale, is important as genetic divergence between populations increases with distance, following the ‘isolation by distance’ pattern (Slatkin, Reference Slatkin1993), such that studies spanning vast distances are more likely to uncover significant genetic structure. Our specific goals were to (i) evaluate the respective contributions of the type of life cycle, study scale and number of localities sampled to population genetic structure of trematodes, and (ii) test the hypothesis that parasites with autogenic life cycles will have greater genetic structure than parasites with allogenic cycles. Our investigation is the first meta-analysis (sensu lato) of genetic structure and its determinants for a large parasite taxon, and it identifies a clear general pattern likely applicable to other taxa.
MATERIALS AND METHODS
Search strategy and data extraction
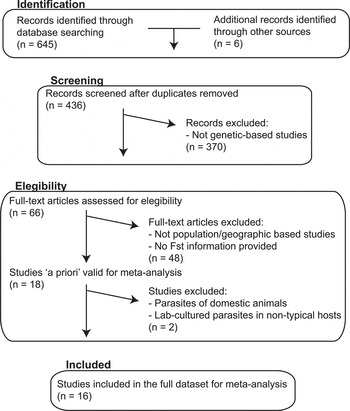
We gathered data from published studies on population genetic structure of trematodes found in a search of the ISI Web of Knowledge using the terms: ‘trematod*’ and Fst or F-statistics or ‘population genetics’ or ‘population genetic structure’ or ‘population structure’ or ‘genetic structure’ in February 2013 (see dataset in Table 1). Both authors validated this search independently. We only retained studies that surveyed at two or more locations and provided values for the fixation index. Studies based on random amplified polymorphic DNA were not considered since they only included allogenic species. The process for study inclusion is summarized in Fig. 1. Studies that did not exclude identical genotypes (clones) from their calculations may lead to inflated Fst values (Prugnolle et al. Reference Prugnolle, Roze, Théron and De Meeûs2005b), but these studies involved only allogenic species, for which low Fst values are expected. Inflated Fst values for allogenic species could bias our test toward acceptance of the null hypothesis, i.e. no difference in Fst between allogenic and autogenic species. However, if the null hypothesis were rejected with these data included, it would mean that the signal in the data is indeed strong. Thus, we retained the studies that did not exclude clones.
Flow diagram summarizing the process for the inclusion of studies in the meta-analysis.

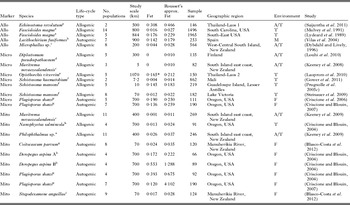
Full dataset on the population genetic structure of trematode species. (Abbreviations: Allo, allozymes; Micro, microsatellites; Mito, mitochondrial; A, Aerial; T, Terrestrial; M, Marine; F, Freshwater. Superfamily affiliation given in footnotes)

a Echinostomatoidea, bHemiuroidea, cMicrophalloidea, dDiplostomatoidea, eOpisthorchioidea, fSchistosomatoidea, gAllocreadioidea, hGorgoderoidea, iLepocreadioidea.
* Fst value for this record was estimated as pairwise Fst in the original publication; reported value here corresponds to the highest estimate.
Due to concerns regarding two studies, we decided to build two datasets for analysis, one including all selected studies (full dataset, Table 1) and a more conservative one in which the two studies below and all studies based on allozyme data were excluded (strict dataset). The only autogenic species investigated using allozyme data (Vilas et al. Reference Vilas, Sanmartin and Paniagua2004) was later shown to potentially consist of cryptic species (Criscione et al. Reference Criscione, Vilas, Paniagua and Blouin2011) and may, therefore, not be appropriate for our analysis. As a consequence, a comparison on allozyme data is not possible since no other study includes an autogenic species in the strict dataset. Additionally, Gower et al.'s (2011) study was later found to include 4 redundant loci (Gower et al. Reference Gower, Gabrielli, Sacko, Dembele, Golan, Emery, Rollinson and Webster2012). Despite the authors considering that this might not alter their results, we provisionally excluded this study from the strict dataset. Each entry in our dataset included the following variables: (i) trematode species, (ii) type of life cycle, (iii) number of localities sampled, (iv) sample size, i.e. the total number of individual specimens investigated, (v) maximum pairwise distance among localities, (vi) marker used, and (vii) species-wide Fst/Φst, as reported in the original study. Linear distances among localities were determined using Google Earth when not available in the original study.
Statistical analysis
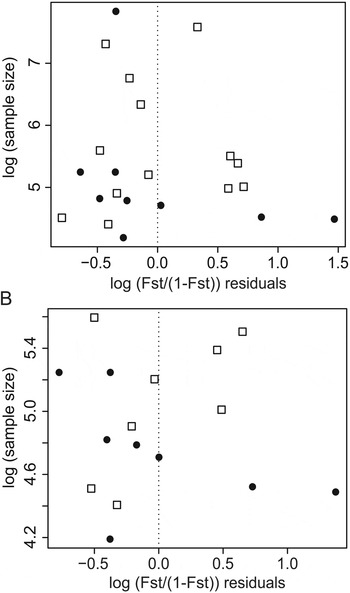
Meta-analysis is a powerful method to synthesize and quantitatively test hypotheses using primary results from published studies (Nakagawa and Poulin, Reference Nakagawa and Poulin2012; Poulin and Forbes, Reference Poulin and Forbes2012). We used the species-wide Fst/Φst value to calculate Rousset's (Reference Rousset1997) approximation of Fst/Φst that was used as response variable. To log transform these approximations in order that their distribution approaches normality, 0·01 was added to all Fst values. Because the methods for calculating the F-statistics differ across studies, it was implicitly assumed that the effect of the biological phenomena is much stronger than the variance among estimators (see also Riginos et al. Reference Riginos, Douglas, Jin, Shanahan and Treml2011; Kort et al. Reference Kort, Vandepitte and Honnay2012). Maximum distance among sampled locations (study scale) was also log transformed. Generalized linear mixed models (GLMMs) were used to investigate how population genetic structure (Fst) is affected by the following predictors: type of life cycle (allogenic or autogenic), number of sampled populations, maximum distance among sampled locations, i.e. study scale, and marker (mitochondrial DNA sequences, microsatellites or allozymes). The two continuous variables (number of sampled populations and study scale) were tested for independence, and found not to covary (full dataset: r = 0·019, N = 22, P = 0·935; strict dataset: r = −0·270, N = 16, P = 0·312). The interaction between marker and study scale was also considered since marker sensitivity may be scale-dependent. By incorporating random sources of variation in the model, GLMMs can account for random variance caused by stochastic and biological processes. Two random factors were included in all models to account for the phylogenetic and geographic (multiple studies carried out at the same sites/populations) non-independence of the data. The taxonomic level ‘Superfamily’, with 9 categories, and the geographic region of the studies, with 13 categories, were used as random effects. The null model included the marker effect because different markers have different mutation rates and different inheritance modes that can affect Fst estimations. Statistical analyses were performed using R v. 2.15 (www.r-project.org). GLMMs can accommodate both categorical and continuous variables, and non-orthogonal datasets. A normal error distribution was assumed and the Akaike information criterion (AIC) was used to choose among competing models. Finally, we explored the possibility of publication bias (see Møller and Jennions, Reference Møller and Jennions2001) by examining the relationship between the sample size (number of individual specimens investigated) across studies and the response variable. Sample sizes were plotted against the residuals of the best models as an approach akin to a funnel plot. Also a Spearman's rank correlation was computed between the sample sizes across studies and these residuals, to see if studies with small sample sizes tend to produce more variable results (i.e. showing poorer fit with the statistical models).
RESULTS
The full dataset comprised 22 records, including 16 species from 11 families, compiled from 16 published studies on population genetic structure of trematodes (Table 1). The strict dataset, on the other hand, included 16 records of 11 species from 10 families, compiled from 10 published articles. Some species (e.g. Schistosoma mansoni) had multiple entries from the same or independent studies.
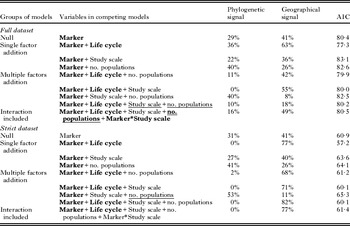
Consistently, statistical analyses of both datasets showed that the life-cycle type and marker used had significant effects on the species Fst (Table 2). Conversely, the spatial scale of the study and the number of populations sampled had little effect, limited to models with higher AIC values than the null model. The interaction between marker type and study scale was significant in the analysis of the full dataset but not significant for the strict dataset. Analyses using both datasets pointed at the same best model (with the lowest AIC value), the one including marker and type of life cycle.
Summary of the generalized linear mixed models of population structure in trematodes. (Variables in bold or underlined were significant for at least one factor in the specified model; bold: P<0·001; underlined: P<0·05. Phylogenetic and geographical signal in the data are shown as percentage of unexplained variance accounted by each random factor)

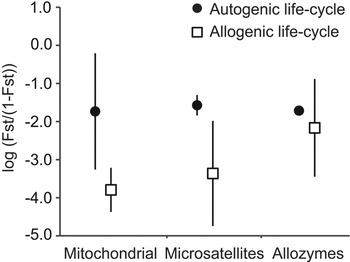
Any model including life-cycle type revealed this factor to be the most significant predictor of population structure. Estimates of genetic structure were significantly higher for parasites with autogenic life cycles (Fig. 2, P-value <0·05). Generally, the random effect accounting for the phylogenetic non-independence of the data contributed little to the unexplained variance, ranging from 0 (models including type of life cycle as predictor) to 53% (see Table 2). The percentage of unexplained variance accounted by the geographical non-independence of the data was higher when the phylogenetic random effect was lower (e.g. 63 and 77% in the best model for the full and strict datasets, respectively).
Mean (±s.e.) genetic structure for autogenic and allogenic trematode species by molecular marker used. Genetic structure is measured using Rousset's (Reference Rousset1997) approximation of Fst/Φst.

Visual inspection of the funnel plots suggests that publication bias may exist in the strict dataset in which residuals of studies with large samples sizes were as large as those with smaller sample sizes (Fig. 3B). However, the correlation between sample size and the residuals from the best model was not significant for either dataset (full dataset: ρ = −0·052; P = 0·818; strict dataset: ρ = −0·057; P = 0·833). Studies using allozymes had larger sample sizes than studies using other markers. The lack of a funnel shape in the strict dataset plot, which did not include records based on allozymes, may be due to the absence of studies with large enough sample sizes.
Funnel plots representing samples sizes across studies against Rousset's approximation of Fst/Φst for records in (A) the full dataset and (B) the strict dataset. Open squares correspond to records of allogenic species and black circles are records of autogenic species.

DISCUSSION
Given that trematodes have extremely limited direct dispersal, the nature of their final host should determine their indirect potential for large-scale movements. In our meta-analysis, the type of life cycle (allogenic vs autogenic) was the best predictor of population genetic structure, having a significant effect in all models that included it, and in both the full and the more conservative dataset. Trematodes with autogenic life cycles had greater population genetic structure, consistent with a previous study on few species (Criscione and Blouin, Reference Criscione and Blouin2004). The observed difference between the two types of life cycle is likely due to the fact that autogenic parasites are constrained to aquatic ecosystems. Organisms with movements confined to hydrological connections (e.g. fish) or that can only travel short distances on land (e.g. amphibians) face strong dispersal limitations at small spatial scales (De Bie et al. Reference De Bie, De Meester, Brendonck, Martens, Goddeeris, Ercken, Hampel, Denys, Vanhecke, Van Der Gucht, Van Wichelen, Vyverman and Declerck2012) that can influence not just their population structure but also that of their parasites.
We acknowledge that marine autogenic trematodes were only represented by one species in our dataset that appeared to be a complex of cryptic species (Vilas et al. Reference Vilas, Sanmartin and Paniagua2004; Criscione et al. Reference Criscione, Vilas, Paniagua and Blouin2011). Whether the same pattern would apply to marine trematodes in general remains unanswered. Unlike freshwater organisms, the migration ability of marine fish and mammals may well allow as much dispersal within the marine realm as that of birds or terrestrial mammals on land. Also, marine parasites typically have greater numbers of intermediate or paratenic hosts that promote transmission in the ‘diluted’ marine environment (Marcogliese, Reference Marcogliese1995), hence enhancing the dispersal potential of autogenic parasites and limiting their genetic structure (Nadler, Reference Nadler1995). Thus, greater variation in the genetic make-up of marine autogenic parasites is likely, although this requires further research.
The most vagile host in a parasite life cycle is responsible for the parasite's migration (Prugnolle et al. Reference Prugnolle, Liu, De Meeûs and Balloux2005a; Louhi et al. Reference Louhi, Karvonen, Rellstab and Jokela2010), and varying degrees of mobility of definitive hosts can translate into differences in parasite dispersal and population genetic structure (Criscione and Blouin, Reference Criscione and Blouin2004; Blasco-Costa et al. Reference Blasco-Costa, Waters and Poulin2012). Unfortunately, we could not test whether definitive host vagility (e.g. flight vs cursorial, or migratory vs sedentary) was a good predictor of genetic structure due to a lack of sufficient replication in our dataset. The specific mode of active dispersal (flight, cursorial, swimming) has complex and variable effects in structuring metacommunities of free-living organisms, but dispersal limitation remains the driving force behind spatial structure (De Bie et al. Reference De Bie, De Meester, Brendonck, Martens, Goddeeris, Ercken, Hampel, Denys, Vanhecke, Van Der Gucht, Van Wichelen, Vyverman and Declerck2012).
Often, because gene flow is a function of host movement, greater geographical distance among populations is associated with increased population genetic differentiation resulting in a spatial pattern of isolation by distance. We found that the geographical scale of a study was significant, but not a strong predictor of population genetic structure compared with the effect of the life cycle. A comprehensive study on range size patterns of European trematodes showed that the dispersal capacity of the definitive host may be superseded by other factors on large scales (Thieltges et al. Reference Thieltges, Hof, Borregaard, Matthias Dehling, Brändle, Brandl and Poulin2011). The use of multiple hosts by a parasite species (low host specificity, i.e. generalist parasites) could be relevant here too. All studies included in our survey focused on a single definitive host, despite some parasites being known to infect several definitive host species. Thus, in cases where the focal host was not very mobile, the overlap of the geographical ranges of all the definitive hosts that a parasite infects may provide enough dispersal opportunities for the parasite to overcome geographic differentiation. Alternatively, if multiple definitive hosts represent different environments, diversifying selection may enhance polymorphisms over a large geographical range (see Théron and Combes (Reference Théron and Combes1995) for an example on sympatric populations).
The results of our meta-analysis are likely to apply broadly to other parasites, whether helminths or other types, whose dispersal is intimately tied to that of the host, making host traits the most important determinant of parasite genetic structuring.
ACKNOWLEDGEMENTS
We are grateful to an anonymous referee for constructive suggestions and to Dr R. Paterson for assistance with implementation of some analyses.
FINANCIAL SUPPORT
Financial support was provided by a Marie Curie Outgoing International Fellowship for Career Development (PIOF-GA-2009-252124) to IBC within the 7th Framework Programme of the EU.