1. Introduction
The aim of this paper is to outline the inorganic geochemistry (and some petrology) of the type section of the British Caradoc Series. Curiously, for such an important section, despite abundant published stratigraphical, palaeontological and palaeoecological studies, there are no published petrological or geochemical studies on it. Since type sections are the basis for stratigraphic correlations, and the Upper Ordovician marks important worldwide climatic, tectonic and biological changes, the Onny valley Caradoc type section deserves a comprehensive study.
The Caradoc is the lower of the two British Series of the Upper Ordovician. The term Caradoc was first used by Murchison (Reference Murchison1834) for rocks around Caer Caradoc in east Shropshire, UK (Fig. 1a). During the Late Ordovician, east Shropshire and adjacent areas in North Wales lay on the eastern side of the Iapetus Ocean on the microcontinent of Avalonia, in temperate southern latitudes between about 40 and 45°S (Trench et al. Reference Trench, Torsvik, Smethurst, Woodcock and Metcalfe1991; Pharaoh et al. Reference Pharaoh, Winchester, Verniers, Lassen and Seghedi2006) (Fig. 1b), though later transcurrent faulting has juxtaposed areas which were once much further away from each other (Woodcock, Reference Woodcock1984a ) (Fig. 1c). The absence of all but one bentonite horizon in the Shropshire Caradoc rocks confirms this, as the sections are now less than 100 km from the contemporary explosive volcanoes of the Snowdon area (Orton, Reference Orton1991).
(a) Caer Caradoc, type area of Murchison's Caradoc Sandstone. (b) Palaeogeography of the Caradocian with positions of North Wales in Avalonia marked (map courtesy Ron Blakey). (c) Location map of exposures. BF – Bala fault; PF – Prees fault; PLF – Pontesford-Linley fault; CSF – Church Stretton fault (modified from Bettley, Fortey & Siveter, Reference Bettley, Fortey and Siveter2001 and Kokelaar, Reference Kokelaar1988).

In the early to mid-twentieth century, the Caradoc Series in Shropshire was divided into stages based on shelly fossils (Bancroft, Reference Bancroft1933; Dean, Reference Dean1958) and many published studies done on fossil taxonomy, ecology and community structure, stratigraphy and, to a lesser extent, tectonics (see Rushton et al. Reference Rushton, Owen, Owens and Prigmore1999, Brenchley et al. Reference Brenchley, Rushton, Howells, Cave, Brenchley and Rawson2006 and Schofield, Reference Schofield2009 for summaries). These Caradoc stages are now grouped into more inclusive stages, the originals relegated to substages, and these local British Caradoc stages replaced internationally by the Sandbian (460.9 ± 1.6 to 455 ± 1.6 Ma) and Katian stages (455 ± 1.6 to 445 ± 1.5 Ma) (Bergstrom et al. Reference Bergström, Chen, Gutiérrez-Marco and Dronov2006; Ogg, Ogg & Gradstein, Reference Ogg, Ogg and Gradstein2008) (Fig. 2). The Caradoc Series, as now defined, ranges from the basal Sandbian to the middle Katian, from the base of the gracilis to the middle of the linearis British graptolite zones and from the anserinus to the basal ordovicicus Baltoscandian condont zones (Fortey et al. Reference Fortey, Harper, Ingham, Owen and Rushton1995).
Onny valley geological map and section (with sample locations) and local stratigraphy (based on Dean, Reference Dean1958 and Savage & Bassett, Reference Savage and Bassett1985). International stages from Webby et al. (Reference Webby, Cooper, Bergström, Paris, Webby, Paris, Droser and Percival2004) and Chen et al. (Reference Chen, Rong, Fan, Zhan, Mitchell, Harper, Melchin, Peng, Finney and Wang2006). A recent analysis puts the Silurian/Hirnantian boundary at 443.41 Ma and the basal Hirnantian at 444.68 Ma (Sadler, Cooper & Melchin, Reference Sadler, Cooper and Melchin2009), a precision warranted neither by stratigraphic nor radiometric dating methods. These, however, are not much different from the international one used here.

2. Local geology
The defined type section of the Caradoc Series is in the Onny river valley (Fig. 1c), and is now a scientific park (Toghill, Reference Toghill1992a ). It is within the southernmost outcrops of the Caradoc area, which lay on the western edge of the Midland shelf (Rushton et al. Reference Rushton, Owen, Owens and Prigmore1999), and at about 45°S in the preceding Llanvirn (Trench et al. Reference Trench, Torsvik, Smethurst, Woodcock and Metcalfe1991). To the present northwest, deeper water facies (in the Shelve inlier and Berwyn Hills) change into sporadic arc volcanism around the Harlech dome (Whittard, Reference Whittard1979; Thorpe et al. Reference Thorpe, Leat, Mann, Howells, Reedman and Campbell1993) (Fig. 1c). Both on the Midland shelf and in areas to the northwest, the volcanism was confined to the lower Burelian stage (Soudleyan–Longvillian) (Cave et al. Reference Cave, Dean and Hains1988; Howells, Reedman & Campbell, Reference Howells, Reedman and Campbell1991; Orton, Reference Orton1991) (Fig. 2). In these areas, both sedimentation and arc volcanism had ended by the middle Caradocian (Longvillian) around 448 Ma (Brenchley, Reference Brenchley and Wood1969a ; Compston & Williams, Reference Compston, Williams, Webby and Laurie1992; Fortey et al. Reference Fortey, Harper, Ingham, Owen, Parkes, Rushton and Woodcock2000) when replacement of the arc volcanism by mixed ocean island basalts/magmatic arc basalts of the Snowdon massif indicates the end of ocean floor subduction (Leat & Thorpe, Reference Leat and Thorpe1989; Gibbons & Young, Reference Gibbons and Young1999). This, together with post-Longvillian/pre-Llandoverian folding, strike-slip faulting and basaltic dyke intrusion in the Shelve inlier (Whittard, Reference Whittard1979), and Neptunian dyke intrusion in the Caradoc area (Strachan, Temple & Williams, Reference Strachan, Temple and Williams1948) possibly marks the closure of the Tornquist ocean with a change from SE-directed subduction to strike-slip faulting (Toghill, Reference Toghill1992b ; Thorpe et al. Reference Thorpe, Leat, Mann, Howells, Reedman and Campbell1993). Ninety kilometres east of Caer Caradoc, in the Nuneaton inlier, dioritic intrusions with a U–Pb age of 449 ± 18 Ma and geochemical characteristics of within-plate basalts suggest widespread basic magmatism on the Midland shelf, associated with the onset of the strike-slip (probably transtensional) faulting (Bridge et al. Reference Bridge, Carney, Lawley and Rushton1998).
Only recently has the possibility of large lateral displacements of juxtaposed units caused by plate movements been considered. It is now known that even within the Shropshire Lower Palaeozoic shelf, major displacements have occurred on a network of braided dextral strike-slip faults (Woodcock, Reference Woodcock1984b ) (Fig. 1c). For example, the Pontesford–Linley fault juxtaposes Ordovician and Precambrian rocks and had a large displacement: conservative estimates range from 20 to 40 km (Woodcock, Reference Woodcock1984a ). In the Shelve inlier to the northwest of the Onny valley, a whole network of dextral braided strike-slip faults pre-date Silurian (upper Llandovery) sedimentation (Lynas, Reference Lynas1988; Whittard, Reference Whittard1979). Ordovician stratigraphy is often incompatible across these faults and changes too abrupt in fine-grained sediments to be the result of facies changes. As already noted, there is almost no volcanic material in the Onny Caradoc section, even though they are now less than 100 km from the contemporary explosive volcanoes of the Snowdon area (Orton, Reference Orton1991). Comparison with modern explosive volcanoes suggests that the Onny Caradoc rocks were at least hundreds of kilometres from North Wales (Heiken & Wohletz, Reference Heiken and Wohletz1985). Ordovician stratigraphy was thus affected by syn- and post-depositional oblique-slip fault zones across which both litho- and biofacies changes are complex and unpredictable (Bettley, Fortey & Siveter, Reference Bettley, Fortey and Siveter2001; Hoppie & Garrison, Reference Hoppie and Garrison2002; Dewey & Rosenbaum, Reference Dewey and Rosenbaum2008). There is thus no possibility that local successions can be traced for any distance across strike; this accounts for the overly rapid apparent facies changes in the belt of Ordovician inliers stretching northwest from the South Shropshire shelf into the Caradocian arc volcanics of North Wales, and for the complex stratigraphic terminology. Even contemporary graptolite faunas among the inliers are different (Hughes, Reference Hughes1989). Another important consequence is that geochemical and other studies from adjacent rocks in Wales and the Welsh borders (and further away) cannot be extrapolated from one tectonic block to another.
Poor exposure bedevils study of the Lower Palaeozoic in the Welsh borders. Exposures are particularly poor in the type Caradoc section of the Onny valley. Until the widening of the A489 in the late 1970s, with resulting better road-cuts (Brenchley & Newall, Reference Brenchley and Newall1982), now becoming overgrown (Fig. 3a), the stratigraphy had to be reconstructed from scattered and relatively short sections exposed in small quarries (now mostly all obscured), roadsides and streams (Fig. 3b); there are no nearby boreholes that contain Caradoc strata.
Exposures in Onny valley: (a) Road-cuts in the Cheney Longville Formation; (b) Onny stream section in the Acton Scott Formation.

The type section is incomplete, beginning in the second Costonian substage of the Aurelician (the lowermost Velfreyan is absent) and ending in the Streffordian (Onnian) with a slight angular unconformity overlain by Lower Silurian (Llandoverian) shales (Fig. 2). There are no graptolites and condonts are rare, with the conodonts having no diagnostic biozone species (Savage & Bassett, Reference Savage and Bassett1985). Though three chitinozoan biozones can be recognized, the first biozone ranges almost through the section (from the Coston Formation into the Acton Scott Formation) and is thus useless for detailed biostratigraphic subdivision (Vandenbroucke et al. Reference Vandenbroucke, Anciletta, Fortey and Verniers2009). A largely brachiopod-based stadial scheme erected by Bancroft (Reference Bancroft1945), later supplemented by trilobites (Dean, Reference Dean1964), is now reduced to substages in the current four-stage scheme (Fig. 2). All the shelly fossils used to subdivide the type Caradoc are, however, environmentally controlled facies fossils that appear wherever the palaeoenvironment suited them, and thus biostratigraphic correlations based on them are useless (Hurst, Reference Hurst1979a ). For example, it is not very encouraging to find that Heterothis alternata (J. de C. Sowerby), the brachiopod dominating the Alternata Limestone Formation, also occurs sporadically in lenses throughout the overlying strata, from basal Cheneyan to topmost Streffordian stages (Harper, Reference Harper1978); nor that modern taxonomic studies have shown that the important cryptolithinid trilobites, widely used for Caradocian zonation, consist of very variable populations with environmentally constrained morphotypes and species (Owen & Ingham, Reference Owen and Ingham1988; Bowdler-Hicks, Ingham & Owen, Reference Bowdler-Hicks, Ingham and Owen2002).
3. Stratigraphy and sedimentology
The sections were logged with a Jacob's staff and the freshest samples taken by excavating into the finest grained lithologies (varying in grain size from fine clayey sandstones to mudstones) every 5 m stratigraphically where possible (petrography data is available in the online Supplementary Material at http://www.journals.cambridge.org/geo). It should, however, be pointed out that even careful repeated section measurements have a 10% variation at the 95% confidence level (Dennison, Reference Dennison1972).
The basal Coston Formation (around 35 m thick) consists of up to 15 m of cross-bedded conglomeratic quartzites and pebbly quartzites passing up into at least 8 m of interbedded conglomeratic quartz arenites and subarkose (Parnell, Reference Parnell and Marshall1987) with lenticular shell beds near the top, then into over 10 m of massive coarse- to medium-grained calcareous and shelly quartz arenites with rare quartz pebbles (Dean, Reference Dean1964). The pebbles are dominantly quartzite with rarer pink acid volcanics from the underlying and adjacent Precambrian. In the type section, the Coston Formation is faulted against Precambrian quartzites and the basal conglomeratic units are missing (Whittard, Reference Whittard1953; Dean, Reference Dean1964). The Coston Formation shows a change from nearshore ‘beach’ conglomerates up through shallow marine ‘bar’ sandstones into deeper shelf sandstones with an abundant shelly fauna. Though the sandstones at the type section show little in the way of structure, except cross-bedding, the Coston Formation closely resembles other transgressive shelf conglomerate–sandstone successions (Hobday & Reading, Reference Hobday and Reading1972; Johnson, Reference Johnson1977; Clifton, Reference Clifton2003). Eleven kilometres northeast of the Onny valley, the Coston Formation has more calcareous sandy limestones with at least one shale horizon with graptolites of the Nemagraptus gracilis Zone (Dean, Reference Dean1964).
The Smeathen Wood Formation (up to 70 m thick) consists of very poorly exposed calcareous mudstones with some grey-green shales with a diverse marine fauna of trilobites, brachiopods, gastropods, ostracods and conularids (Dean, Reference Dean1964). Two kilometres southwest of the Onny valley, at least two interbedded trachybasalt lava flows occur in the formation (Whittard, Reference Whittard1953, p. 162), which are the same age as the final middle Caradocian magmatism in the Snowdonia area to the northwest (Gibbons & Young, Reference Gibbons and Young1999). The unit represents deeper marine shelf conditions than the Coston Formation below.
The Glenburrell Formation (up to 30 m thick) consists of very poorly exposed dark green mudstones and shales with occasional clayey limestones, becoming sandier upwards (Dean, Reference Dean1964), with a fauna dominated by trilobites, including cryptolithids and brachiopods (Dean, Reference Dean1958). It marks further deepening of the deep shelf environment of the Smeathen Wood Formation.
The Horderley Sandstone Formation (60–300 m thick) consists of green-brown quartz arenites passing upwards into green, brown and purple quartz arenites and subarkoses, which appear to pass gradually up into the Alternata Limestone Formation, and contains a normal marine brachiopod-dominated fauna (Dean, Reference Dean1960, Reference Dean1964). It shows a rapid upward increase in the number and thickness of sandstones interbedded with mudstones until dominated by sandstone. The lower part has variably orientated low-angle hummocky cross-stratified sandstones, interpreted as storm deposits, while the upper part also has tabular- and trough-cross-bedded units, sometimes in broad channels, interpreted as deposits of shallower sand bars (Brenchley & Newall, Reference Brenchley and Newall1982). This formation is the only one that has heavy mineral data. The heavy minerals form only a small percentage of the sandstones, but are dominated by zircon, rutile, magnetite, ilmenite, garnet, tourmaline, apatite and anatase (Fleet, Reference Fleet1925), which suggest ultimate derivation from continental basement.
The Alternata Limestone Formation (about 30 m thick) is really shelly sandstones and consists of alternating layers of calcareous fine-grained sandstones (quartz wackes) and sandy/silty shales. There may be a break between it and the underlying Horderley Sandstone Formation, as the Alternata Limestone Formation contains phosphatic nodules and fossils in its lower parts and is very variable in thickness (Hurst, Reference Hurst1979a ). It grades gradually up into the overlying Cheney Longville Formation. In the Onny valley, a generally fining upward section consists of (1) large-scale variably orientated cross-bedded medium-grained quartz arenites with a relatively diverse normal marine brachiopod–trilobite–bryozoan–molluscan fauna but without H. alternata, passing up into (2) parallel laminated to low-angle cross-bedded medium-grained quartz arenites with hummocky cross-bedding and basal intraformational pebble and shell lags, passing up into (3) fine-grained quartz arenites interbedded with bioturbated sandy and silty shales, passing up into (4) finely laminated and graded quartz arenites with basal shell lags, and coquinas dominated by H. alternata with sandy silty matrices. The units vary greatly in character and contain distinctive brachiopod-dominated biofacies with a mixture of faunas in spatially heterogeneous environments (Hurst, Reference Hurst1979 a,b). The section shows an upward change from shallow marine sand bars through storm-deposited deeper sands to deeper water storm-deposited sands, shell beds and fair-weather silts and shales deposited near storm wave base (Hurst, Reference Hurst1979a ).
The Coston to Horderley formations form a genetic sequence (Christie-Blick & Driscoll, Reference Christie-Blick and Driscoll1995) in which the Coston Formation conglomerates and shelly sandstones overlain by the Smeathen Wood mudstones form the basal transgressive systems tract, with the maximum flooding surface in the Glenburrell Formation. The coarser Horderley Sandstones form the prograding wedge of the highstand and falling stage systems tracts. The Alternata sandstones and coquinas may form the top of this sequence, though the phosphatic pebbles and shells which indicate condensation, and the deepening upwards in the Alternata Sandstone Formation, probably mark the start of the succeeding sequence.
The Cheney Longville Formation (about 120 m thick) consists of dark green clayey micaceous sandstones and subsidiary sandy and silty mudstones with normal marine brachiopod-dominated faunas (Dean, Reference Dean1964), and contains two shallowing upwards units in which coarser and thicker sandstones increase in number upwards (Brenchley & Newall, Reference Brenchley and Newall1982). In the lower parts of the units thin ripple-drift cross-laminated sandstones with rippled or bioturbated tops form 20–40% of the mudstone and siltstone-dominated sections, while thicker, coarser, channelized, shelly hummocky cross-bedded sandstones form up to 90% of the upper parts of the unit. These coarsening and shallowing upwards units are interpreted as being deposited in a shallow storm-influenced inner shelf environment (Brenchley & Newall, Reference Brenchley and Newall1982). The top 10 m consists of highly bioturbated mudstone with a relatively diverse brachiopod-dominated (Oniella–Sowerbyella) fauna deposited in a deeper shelf environment transitional to the overlying beds (Hurst, Reference Hurst1979a ).
The Alternata Limestone and Cheney Longville formations form a genetic sequence, with passage from a transgressive system tract dominated by shelly sandstones with condensed beds and shales into highstand and falling stage system tracts dominated by sandstones (Catuneanu, Reference Catuneanu2006).
The Acton Scott Formation (up to 160 m thick) consists of micaceous mudstones and bioturbated siltstones with nodular limestone bands passing up into calcareous bioturbated siltstones with relatively low-diversity brachiopod-dominated (Onniella) marine faunas (Hurst, Reference Hurst1979b ), deposited in a mid-shelf environment below storm wave base. A bentonite in the lowest part of the formation gave imprecise minimum fission track zircon ages of 468 ± 12 Ma and 464 ± 21 Ma (1σ error) (Ross et al. Reference Ross, Naeser, Izett, Obradovich, Bassett, Hughes, Cocks, Dean, Ingham, Jenkins, Rickards, Sheldon, Toghill, Whittington and Zalasiewicz1982) (we could not find this bentonite during our field work). These ages are compatible with more precise U–Pb ages of 456.1 ± 1.8 Ma for the Costonian Llanwrtyd Volcanics of central Wales (Tucker & McKerrow, Reference Tucker and McKerrow1995) and the preferred 454.4 ± 0.4 Ma age for the Longvillian Pont-y-ceunant Ash from the Berwyn Hills (Compston, Reference Compston2000).
The Onny Shale Formation (up to 20 m thick) consists of grey bioturbated mudstones with a sparse low-diversity fauna dominated by small brachiopods, and laminated shales in the middle of the formation with an extremely low-diversity and density benthic fauna (Hurst, Reference Hurst1979b ). It is unconformably overlain by Lower Silurian (upper Llandoverian) grey shales. The bulk of the formation was deposited in a deep shelf environment below storm wave base. The laminated shales probably reflect low oxygen levels (Wignall, Reference Wignall1994) and may represent the worldwide late Katian oceanic anoxic event preceding the Hirnantian glaciation (Challands et al. Reference Challands, Armstrong, Maloney, Davies, Wilson and Owen2009; LaPorte et al. Reference LaPorte, Holmden, Patterson, Loxton, Melchin, Mitchell, Finney and Sheets2009).
The Acton Scott and Onny Shale formations form the transgressive system tract and maximum flooding surface of an incomplete sequence truncated by the unconformity below the Silurian shales.
The succession resembles that of the Berwyn Hills to the northwest (Brenchley & Pickerill, Reference Brenchley and Pickerill1980; Pickerill & Brenchley, Reference Pickerill and Brenchley1979), being deposited in shallow to deep shelf environments, interrupted by several shallowing upwards cycles, for example in the Cheney Longville Formation. The Onny sediments, however, show somewhat different petrography indicating a different source (Brenchley & Pickerill, Reference Brenchley and Pickerill1980).
4. Petrology
Samples of at least 300 g were obtained from the A489 road-cuts (where possible) and from the stream sides and bed of the Onny river (Fig. 3). Because, however, the Onny Caradoc sediments are mostly so fine grained, only limited petrology can be done on them. They do tend to get finer grained upwards and show an increase in untwinned (probably alkali) feldspar beginning near the base of the Cheney Longville Formation (see online Supplementary Material at http://journals.cambridge.org/geo), which presumably causes the drop in N/K ratio and increase in K/(Fe + Mg) at the same level (see Section 6.b). The clay minerals are dominantly illite (Merriman, Reference Merriman2006), which is only to be expected since most Palaeozoic shales have been changed to this stable state (Bevins & Robinson, Reference Bevins and Robinson1988).
The minimum sample size taken took into account how grain size affects the size required for a representative sample: in Onny sampling we took samples sizes far above the minimum required for both petrology and geochemistry. For example, since many trace elements are concentrated in scarce individual grains, then the size of a representative sample increases with grain size. Except for the basal Coston quartzites, only 3 g of the maximum very fine sand size of the Onny samples is required for analytical consistency (Wickman, Reference Wickman1962).
Percentage estimates of constituents in thin-sections were done with the percentage charts of Flügel (Reference Flügel1982). Using such charts has been proved to be as accurate as point counting in estimating sand-sized and greater constituents, and they allow large numbers of samples to be rapidly studied petrographically (Flügel, Reference Flügel1982, Ch. 4.3).
All the coarser (mostly fine sandstone) lithologies above the basal Coston quartzites and conglomerates are greywackes in which the apparent muddy matrix is the result of breakdown of unstable minerals and particles (Brenchley, Reference Brenchley1969b ). Strained (metamorphic) quartz dominates the sand fraction, with up to 15% of untwinned feldspar and 5% of multiple-twinned plagioclase, up to 30% of sand-sized amorphous organic/clay lumps (glaebules in soil terminology) and scarce glauconite grains (see online Supplementary Material at http://journals.cambridge.org/geo). The matrix of the finer beds is speckled organic ferruginous clay with uniform fabric (see Bullock et al. Reference Bullock, Fedoroff, Jongerius, Stoops, Tursina and Bable1985). This petrography, unlike the contemporary clastic sediments around the Caradoc magmatic arcs to the northwest, suggests a source from exposed basement to the east and south (Dean, Reference Dean1964).
The few samples coarse enough for sand grains to be identified plot in the transitional continental field of Dickinson (Reference Dickinson and Zuffa1985) except for the basal Coston sandstone sample, which plots in the craton interior field (Fig. 4). The samples plot in the ‘trailing edge’ QFL division of Maynard, Valloni & Yu (Reference Maynard, Valloni, Yu and Leggett1982), which is defined on modern sands from arc-related basins, but plot in their ‘strike-slip’ field if original unstable lithic fragments were present. All would move into the recycled orogen field if the pseudomatrix partly derived from unstable volcanic grains (see below). All but the basal Coston sandstone are also in the plutonic humid field of Suttner, Basu & Mack (Reference Suttner, Basu and Mack1981), which exists because plagioclase is much less stable then K-feldspar in humid climates (Dickinson, Reference Dickinson and Zuffa1985). The basal Coston coarse pebbly feldspathic sandstones (arenites and arkoses) outside the type area are dominated by quartz pebbles but with minor fine-grained volcanic pebbles from exposed late Proterozoic Uriconian rocks (Dean, Reference Dean1964; Greig et al. Reference Greig, Wright, Hains and Mitchell1968). The Uriconian is a bimodal volcanic and pyroclastic unit possibly erupted on a post-subduction, faulted continental block (Pharaoh et al. Reference Pharaoh, Webb, Thorpe, Beckinsale, Pharaoh, Beckinsale and Rickard1987). The grain sizes are too small to evaluate the proportion of monocrystalline to polycrystalline quartz.
QFL provenance diagram (from Dickinson, Reference Dickinson and Zuffa1985) and plutonic (humid) and metamorphic (humid) field of Suttner, Basu & Mack (Reference Suttner, Basu and Mack1981) with Onny samples plotted.

Ingersoll, Kretchemer & Valles (Reference Ingersoll, Kretchemer and Valles1993) have shown that sampling at third-order scale (large river and marine environments), as here, gives excellent predictions of plate tectonic settings. The Onny petrology is consistent with a marginal basin passive margin draining continental basement, a long distance from any island arc. Since, however, many of the sandstones seem to have a fine matrix derived from alteration of unstable clasts (possibly volcanics based on the pebbles in the Coston conglomerates), there are many exceptions to the relationship between plate tectonic environments and sandstone composition (Mack, Reference Mack1984), and there are many overlaps in tectonic fields for modern sandstones (Valloni, Reference Valloni and Zuffa1985), then the current petrography may be misleading as to provenance (Cox & Lowe, Reference Cox and Lowe1996). When the pseudomatrix exceeds 10%, then standard petrographic analysis can indicate the wrong provenance (Cox & Lowe, Reference Cox and Lowe1996). In that case a combined chemical–petrological provenance analysis is needed, which is what we attempt here.
Before doing that, however, we need to evaluate post-depositional changes.
5. Diagenesis
The Onny sediments have not been metamorphosed as conodont colour alteration indices are 1–2 suggesting low geothermal temperatures (Savage & Bassett, Reference Savage and Bassett1985); but they have been subject to severe diagenetic changes. First, almost all modern sandstones are basically arenites with the sand grains forming a framework, even those deposited by turbidity currents (Tucker, Reference Tucker2001). Matrix-supported (floating) textures in greywackes are the result of (a) bioturbation mixing coarser and finer grain sizes; and (b) breakdown of unstable grains to form a pseudomatrix (Tucker, Reference Tucker2001). Many of the Onny sediments were bioturbated on both a large and small scale. Hurst (Reference Hurst1979b ) identified completely heavily bioturbated mudstone and siltstone facies in the upper three formations, and bioturbation is found throughout the finer-grained sediments of the underlying formations (Brenchley & Newall, Reference Brenchley and Newall1982). The graded fine sandstones, however, are usually not obviously bioturbated except sometimes at their tops. The abundance of organic/clay glaebules in the clay matrices suggests transport of at least some of the fine sediment as sand-sized clay particles, many of which may have collapsed into matrix (Coelho & Vidal-Torrado, Reference Coelho and Vidal-Torrado2003). Some of the glaebules may be altered volcanic ash grains (Pain, Reference Pain1971). In equivalent sandstones in the Berwyn Hills, 50 km to the northwest (Fig. 2), those (arenites) that were cemented early have ~ 20% quartz sand, ~ 30% feldspar and ~ 45% volcanic lithic grains, while those sandstones without early calcite cement show greywacke textures with some ghost volcanic grains preserved as clay minerals (Brenchley, Reference Brenchley1969b ).
The precipitation of illite in the pore space of shales and mudstones greatly reduces their hydraulic conductivity, or permeability, by several orders of magnitude and produces closed system diagenesis for burial environments, particularly those > 60°C (Nadeau, Reference Nadeau2010). Trace elements are, however, redistributed on at least the hand specimen scale in Upper Ordovician black shales (Lev, McClennan & Hanson, Reference Lev, McLennan and Hanson1999). The trace elements migrate from the shales into the pore waters during or subsequent to illitization and related decomposition of organic matter (Hannigan & Basu, Reference Hannigan, Basu, Schieber and Sethi1998); but in fine-grained impermeable sediments they do not move far (Mathieu et al. Reference Mathieu, Pagel, Clauer, De Windt, Cabrera and Boisson2000).
We consider, therefore, that Onny sediments underwent only localized redistribution of elements.
6. Geochemistry
6.a. Methods
Chemical analyses were done on powdered samples after weathered surfaces were removed mechanically. Major elements were quantified by energy dispersive X-ray fluorescence (ED-XRF, SPECTRO XEPOS) (Williams et al. Reference Williams, Basu, Bhargava, Ahluwalia and Hannigan2012). Three to 5 g (dry weight) powdered samples (< 60 mesh) were measured under He purge. Samples were analysed in triplicate using the factory-installed Turboquant global calibration method. SDO-1 was used as a calibration standard providing reference values for correction (MC). Relative standard deviations represent the propagated error of repeat/replicate measures and the MC ratio for each element. USGS SGR-1 (Green River Shale) was analyzed as an unknown to monitor accuracy. Measured values for SGR-1 were better than 5% of known values. The ED-XRF instrument used cannot measure Na. Therefore, we quantified Na on acid digest splits as described below.
For trace element and Na measurement, powdered samples (16 mg) were acid digested using ultrapure HNO3 and HF (Murray & Leinen, Reference Murray and Leinen1993). Samples were digested using a 7 ml Savillex Teflon digestion bomb and a hot plate (200–260°C) for silicate digestion (Algeo et al. Reference Algeo, Hannigan, Rowe, Brookfield, Baud, Krystyn and Ellwood2007), organic removal (Bayon et al. Reference Bayon, German, Boella, Milton, Taylor and Nesbitt2002) and removal of HF residual (Algeo et al. Reference Algeo, Hannigan, Rowe, Brookfield, Baud, Krystyn and Ellwood2007). Samples were digested for 24 hours and dried down repeatedly after each digestion. After the final dry down following removal of concentrated HF, samples were acidified with 0.5 ml of concentrated ultrapure HNO3 and diluted with 50 ml of Milli-Q water (18.3 mega-ohm). USGS shale standards, SDO-1 and SGR-1, were also digested. Internal standard containing 20 ppb of indium was added to each blank, standard and sample; the internal standard was used to correct for instrument drift (Abanda & Hannigan, Reference Abanda and Hannigan2006). Linear dilutions of SDO-1 were used as a matrix standard for calibration. SGR-1 was run as an unknown to monitor precision. Trace and rare earth elements (REEs) were quantified by dynamic reaction cell inductively coupled plasma mass spectrometry (ICP-MS, PerkinElmer DRCII). Samples were measured in triplicate. Measured values for SGR-1 were better than 5% of the known values.
Splits of diluted acid digests (10 ml; prior to In spike) were measured for Na by ICP-optical emission spectroscopy (ICP-OES, PerkinElmer Optima 3000XL). Samples were measured in triplicate. Na was quantified using a linear dilution of SDO-1 (3-point calibration). SGR-1 was measured as an unknown to monitor accuracy. Measured values for SGR-1 were better than 5% of the known values.
Platinum group elements (PGEs, Pd, Os and Pt) and Re were quantified by isotope dilution ICP-MS after NiS fire assay preconcentration (Ravizza & Pyle, Reference Ravizza and Pyle1997; Hassler, Peucker-Ehrenbrink & Ravizza, Reference Hassler, Peucker-Ehrenbrink and Ravizza2000) (our standard shales have no value for Ru & Ir). Five grams of sample was weighed into a Coors porcelain crucible to which a known weight of mixed spike solution of enriched isotopes in ultrapure 6.2 N HCl (185Re,190Os, 191Ir, 105Pd, 198Pt) was added. After drying, the sample-spike mixture was homogenized. A flux mixture of anhydrous sodium tetraborate, high purity Ni and sublimed elemental sulphur was mixed into the sample-spike powder at a ratio of 2:1 flux to sample. Crucibles were covered and placed in a muffle furnace at 800°C and ramped to 1000°C. Samples were fused for 2 hours. After cooling, the crucible was broken and the NiS bead was separated from the glass matrix. Each NiS bead was places in a separate Erlenmeyer flask and dissolved at 200°C on a hot plate in 125 ml ultrapure 6.2 M HCl. Flasks were covered with a Teflon watch glass to prevent drying. Beads were left to dissolve overnight to ensure H2S evolution is complete. Dissolved samples were filtered through 0.45 μm cellulose filters and the filter holder and filter paper rinsed with ultrapure 18.3 mega-ohm water before removing the filter from the apparatus. The filtrate was discarded and the filter paper was retained and digested as above for trace elements. The results of total procedural blanks and reference materials, SDO-1 (Devonian oil shale) and SGR-1 (Green River shale) were within 10% of accepted values (Potts, Tindle & Webb, Reference Potts, Tindle and Webb1992).
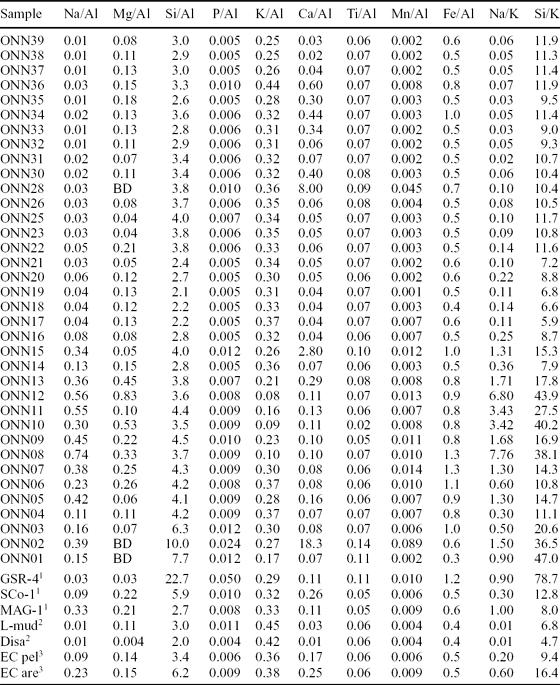
The proportion of coarse-grained sediment does not affect the distribution of elements in the fine fraction if the fine fraction is greater than 5% (Cauwet, Reference Cauwet1987), which is the case here, apart from the basal Coston quartz arenites (Table 1).
Major element oxide analyses, carbonate content and Chemical Index of Alteration (CIA) for Onny samples

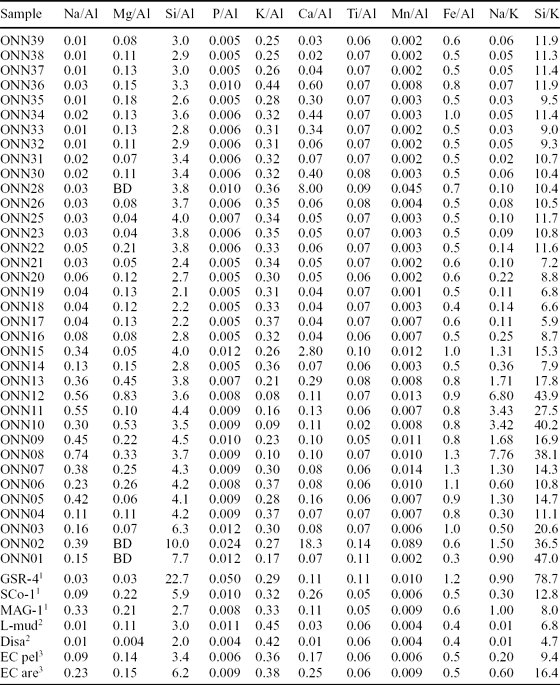
With comparative analyses: 1 from GeoRem (http://georem.mpch-mainz.gwdg.de) and Govindaraju (Reference Govindaraju1994) Silurian marine sandstone (GSR-4), Cretaceous marine silty shale (SCo-1), modern marine mud (MAG-1); 2 L-mud – mudstone below diamictite, Disa – mudstone above diamictite, Upper Ordovician, South Africa from Young, Minter & Theron (Reference Young, Minter and Theron2004); 3 pelitic (EC pel) and arenaceous (EC are) averages for East China sedimentary rocks from Gao et al. (Reference Gao, Luo, Zhang, Zhang, Han, Zhao and Hu1998). SCo-1 and MAG-1 are used as standards here as they compare favourably to average post-Archaean shales and for that reason are considered excellent reference standards (Smith, 1965, USGS Certificate of Analysis, 1995; McLennan & Taylor, 2003).
Major and minor elements are reported as wt% of oxides and elements, and trace elements as μg g−1, and both are normalized against Al (Tables 1–4). Normalizing to Al is a quick and easy way to obtain information about environmental and climate processes, since Al does not show fractionation and moves little during diagenesis (Calvert & Pedersen, Reference Calvert and Pedersen1993, Reference Calvert and Pedersen2007; Piper & Perkins, Reference Piper and Perkins2004); though there are some problems, particularly where detrital fractions are lower than 3–5% (discussed in Riquier et al. Reference Riquier, Tribovillard, Averbuch, Devleeschouwer and Riboulleau2006), and it alone cannot identify and quantify contributions by components other than the detrital fraction (Van der Weijden, Reference Van der Weijden2002). Enrichment factors significantly higher than 10 unambiguously show enrichment in that element, provided the coefficient of variation in Al is not too large, which is usually found with studies involving high-resolution sampling (Riquier et al. Reference Riquier, Tribovillard, Averbuch, Devleeschouwer and Riboulleau2006); this is the case here.
Minor element analyses with acceptable RSD mostly less than 5

Select minor element ratios, to Al and each other

The relative standard deviation (RSD) was used to determine the precision of the trace element results (where RSD = si × 100/mean; and si = standard deviation = ((sum of all values − mean) × 2/number of values)0.5. Only those values of RSD of less than 5 were accepted, though some between 5 and 15 are plotted to infill incomplete plots, with different symbols to show greater uncertainty. Many minor element sample analyses had entirely high RSD values, which unfortunately limited the stratigraphic coverage to just over one-third of analysed samples, though there is coverage of all the stratigraphic units, except the Smeathen Wood Formation (Table 3). Elements in sample nos 2, 15 and 28 were recalculated to a carbonate-free basis, since these samples contain more than 8% CaCO3, below which corrections are less than 5% (Table 1). Those elements that, for the total sample, are below the trends before the carbonate correction are associated with the clastic fraction; those elements that plot above the trend after correction are either associated, at least in part, with the carbonate fraction or are enriched in the clastic part of that sample.
Major, minor and trace element analyses and ratios are compared with the sandstone standard GSR-4, a light and dark arkosic Silurian quartz-sandstone (arenite) from Tongling, Anhui Province, China; and the mudstone standards SCo-1, a silty shale from the Upper Cretaceous Cody Shale of Wyoming, USA, and MAG-1, a Recent marine mud from 125 km east of Boston, USA, at a depth of 280 m. These standards give a good range from shallow sands through to shallow and deep shelf clays. They are supplemented with average post-Archaean arenaceous and pelitic Chinese sedimentary rock averages and with pre- and post-glacial Upper Ordovician – Lower Silurian shales from South Africa (Tables 1–4).
6.b. Major and minor elements
All the major and minor element oxides show lower values in carbonate-rich sediments, and the carbonate-free correction brings them back onto the overall trend; they are thus mostly associated with the detrital fraction, except for Mn and P, which correlate with high CaO and are thus associated with the carbonate fraction (Table 1; Fig. 5). The major oxides, Na2O, MgO and Fe2O3, reach a maximum in the Horderley Sandstone Formation and then decrease markedly above this, accompanied by an increase in K2O, caused by the decrease in plagioclase and increase in alkali feldspar shown by the petrography, and related to the cessation of arc volcanism already noted in Section 4, and with the start of deposition of sequence 2 (Fig. 2). High K2O is a characteristic of Lower Palaeozoic shales and has been attributed to higher detrital alkali feldspar (Maynard, Valloni & Yu, Reference Maynard, Valloni, Yu and Leggett1982). Onny SiO2 values are within the range of the reference materials. TiO2 values vary little around 1% and are lower in sequence 1 (< 0.9) than in sequence 2 and 3 (generally > 1.0), which is rather curious considering that quartz sand peaks in the Horderley Sandstones and that titanium is hosted in discrete heavy minerals that are transported with the silt and fine sand fraction accompanying slightly coarser quartz grains. The upper TiO2 values are close to Post-Archaean Average Shales (PAAS, ~ 1 wt%) (Taylor & McLennan, Reference Taylor and McLennan1985), but higher than most of our reference materials except the Ordovician ones (Table 1). Onny MnO values are comparable with the reference materials.
Major element oxide and CaCO3 distribution in section. Open circles are carbonate-corrected values.

Harker diagrams, with each major and minor oxide plotted against SiO2, show clusters but no trends, except that P2O5 increases with increasing SiO2 and MnO tends to decrease with increasing SiO2.
Normalization of major elements to Al is shown in Table 2. Onny Na/Al ratios are relatively high up to the Alternata Limestone Formation, but then drop to low values typical of most shales, with the highest values tracking the Na/K ratios. Onny Si/Al ratios tend to decrease slightly upwards above the basal Coston Formation, owing to a decrease in quartz sand and silt. Even, however, with this lithological control, the actual values of the Si/Al ratios are sensitive to sediment recycling and weathering and can be used as a measure of sediment maturity (Roser et al. Reference Roser, Cooper, Nathan and Tulloch1996). Immature Si/Al sediment ratios (< 4.5) are found in all but the basal Onny sediments (> 7) with the least mature (< 2.5) concentrated in lower sequence 2, the Cheney Longville Formation (Table 2). K/Al ratios are comparable to reference shales, but K2O values tend to be higher (> 3) in sequences 2 and 3, in the Alternata Limestone Formation and above (Table 1). Lower K/Al ratios, as in the Horderley Sandstone Formation, have been attributed to lower sea levels during glacial phases, resulting in relative basin isolation and increase in the relative proportion of kaolinite derived from local rivers (Yarincik, Murray & Peterson, Reference Yarincik, Murray and Peterson2000). The Ti/Al ratios change little up section (< 0.1) but tend to be slightly higher than the reference materials, except for higher values in the lowest two samples, from the Coston Formation, and in sample no. 15 within the Alternata Limestone Formation. This probably reflects the concentration of heavier minerals in the coarser sediments of sequences 1 and 2 (Fig. 6; Table 2). In Recent southern Atlantic sediments, in comparable latitudes to the Onny palaeolatitude, TiO2 values (0.27–0.54) and Ti/Al ratios (0.05–0.1) compare well with the Onny ones (Govin et al. Reference Govin, Holzwarth, Heslop, Keeling, Zabel, Mulitza, Collins and Chiessi2012). The lower latitude Ti (~ 0.7) and Ti/Al ratios (~ 0.6) for the Recent South China Sea sediments tend to be slightly higher (Wei et al. Reference Wei, Liu, Li, Shao and Liang2003). These are both areas with significant wind input from deserts. Ti is concentrated in heavy minerals such as rutile, ilmenite and titanomagnetite, and Ti/Al ratios are used to indicate wind strength and energy (Shimmield, Mowbray & Weedon, Reference Shimmield, Mowbray and Weedon1990). Ilmenite is softer, and can break down faster, than zircon to provide Ti-rich dust (Anand & Gilkes, Reference Anand and Gilkes1984). Nevertheless, the high Ti and Ti/Al ratios create a problem when compared with the other high-field-strength elements (HFSEs) (see Section 6.c). Mn/Al ratios are comparable to the reference materials in sequences 1 and 2, but are lower in sequence 3 of the Acton Scott and Onny Shale formations (Table 2). Low Mn contents can indicate suboxic bottom waters given that, under reducing conditions at the sediment/water interface, soluble Mn2+ diffuses from the sediments into the oxygen-depleted bottom waters (Landing & Bruland, Reference Landing and Bruland1987). The low Mn/Al ratios, except for sample no. 28, in sequences 2 and 3 suggest anoxic conditions, as these indicate reduction of Mn oxides to Mn2+, which remains in solution (Calvert & Pederson, Reference Calvert and Pederson1996). Onny Fe/Al ratios range from 0.3 to 1.3 and are higher in the Horderley Sandstone Formation (Table 2); the rest lie around the Fe/Al 0.5 mark, which approximates the boundary between oxic and anoxic sediments in the Recent Cariacou Basin, Venezuela (Lyons et al. Reference Lyons, Werne, Hollander and Murray2003) (Fig. 6). Na/K and Fe/Al ratios reach a maximum, and the K/(Fe + Mg) reaches a minimum, in the Horderley Sandstone Formation (Fig. 6). Since there is a marked inverse correlation of Na/K ratios and smectite in modern sediments (Shankar, Subbarao & Kolla, Reference Shankar, Subbarao and Kolla1987), then the very low ratios in the Acton Scott Formation and above may be due to an originally higher smectite clay mineralogy, though the change can as easily be due to loss of plagioclase. It is interesting to note that the only bentonites in the section occur at the base of the Acton Scott Formation (Fig. 2).
Select major element ratio distribution and CIA values.

The Chemical Index of Alteration (CIA) summarizes chemical alteration during weathering, transportation and deposition and gives geochemical estimations of provenance (Nesbitt & Young, Reference Nesbitt and Young1982).
 \begin{equation*}
{\rm CIA} = {\rm Al}_{\rm 2} {\rm O}_{\rm 3}/({\rm Al}_{\rm 2} {\rm O}_{\rm 3} + {\rm CaO} + {\rm Na}_{\rm 2} {\rm O} + {\rm K}_{\rm 2} {\rm O})
\end{equation*}
6.c. Trace elements
The highest Onny trace element values (carbonate-corrected) generally occur in the shales of the basal Cheney Longville and Acton Scott formations at the bases of sequences 2 and 3, though some like Sc, Y, Zr and Mo show little change (Table 3).
Average shale trace element composition is almost identical to average upper crust except for Sr, which is depleted and accumulates separately, like Ca and Na in carbonate, evaporates and seawater, and C, N, S, Se, Te, Br, As, B, Bi, Cd, Hg, In and Sb, which are enriched by hydrothermal and volcanic vapour input, as shown by the composition of Kilauea volcanic vent emissions (Li, Reference Li2000, p. 273).
Sr is low throughout the Onny samples, except in the basal Coston (sample 2) and in the upper Acton Scott and Onny Shale beds (beds 28, 33, 35) independent of carbonate content (Table 3). This may be owing to fossil shell mineralogy, as the basal and upper beds contain molluscs and tentaculites (Dean, Reference Dean1958) that have Sr-bearing aragonitic shells (Dodd, Reference Dodd1967).
Of the analysed hydrothermal and volcanic vapour trace elements above, Onny As, Cd and Sb are very high, while Te and B are low to average, but all vary the same stratigraphically (Table 3); Hg is average and very high in the only two acceptable results (Table 3, sample nos 17 and 33). Like most trace elements, these reach their maximum in the Acton Scott beds, with its bentonite. Hydrothermal or volcanic vapour input in the source of Onny sediments is compatible with the inferred palaeotectonic setting.
The REEs in all samples show depletion in the lighter REEs (La–Nd), while the lowest three samples from the first sequence show significant REE depletion compared to the overlying sequences, especially in the heavier REEs (Sm–Lu) (Fig. 7). Stratigraphic trends in light to heavy REEs (chondrite-normalized La/Yb), light to middle REEs (chondrite-normalized La/Sm) and total REEs as well as Ce- and Eu-anomaly follow, in general, facies changes. Because only a few samples had sufficient CaO we did not correct concentrations for carbonate dilution. As expected, REE concentrations are lowest in more quartz-rich sediments, but there are changes above the basal Coston Formation to light REE enrichment followed by heavy REE enrichment within the Horderley Sandstone Formation (between no. 7 and no. 14), which is unrelated to lithology (Fig. 7). Onny Ce/Ce* ratios vary little around 0.8, which is in the suboxic field (Wilde, Quinby-Hunt & Erdtmann, Reference Wilde, Quinby-Hunt and Erdtmann1996). The Eu/Eu* varies little and hovers around zero and likely reflects the provenance of the sediments (Fig. 8). Overall enrichments in the middle REEs (upper continental crust (UCC)-normalized) can be attributed to phosphate enrichment associated with facies changes and depositional hiatus events (e.g. Williams et al. Reference Williams, Basu, Bhargava, Ahluwalia and Hannigan2012; Hannigan & Sholkovitz, Reference Hannigan and Sholkovitz2001; Hannigan & Basu, Reference Hannigan, Basu, Schieber and Sethi1998). Chondrite-normalized REE patterns also reveal a decrease in heavy REEs (Dy to Lu), which can be attributed to heavy mineral sorting, particularly within the Horderley Sandstone and silt–sand layers within the Cheney Longville Formation.
Rare earth element distributions.

Stratigraphic distribution of Ce/Ce* and Eu/Eu* ratios.

6.d. Palaeoenvironments from geochemical proxies
Proxies are things that can be measured in the rock record and that have responded systematically to changes in variables, such as turbulence, temperature and salinity that are otherwise unrecorded (Henderson, Reference Henderson2002). Selected trace elements and element ratios are useful as environmental proxies and can be used as geochemical proxies for some environmental variables, such as temperature (Mg/Ca, Sr/Ca), salinity (B/Be), productivity (Ba/Al, Be/Th, Cd/Ca) and redox conditions (V, Cr, Mo, U, Re, Cd, Re/Mo, etc.) both today and in the past (Morford & Emerson, Reference Morford and Emerson1999; Wilde, Lyons & Quinby-Hunt, Reference Wilde, Lyons and Quinby-Hunt2004; Tribovillard et al. Reference Tribovillard, Algeo, Lyons and Riboulleau2006; Calvert & Pederson, Reference Calvert and Pedersen2007; Gallego-Torres et al. Reference Gallego-Torres, Martinez-Ruis, De Lange, Jiminez-Espejo and Ortega-Huertas2010). The underlying chemistry and biology of most proxies, however, is poorly understood, and they have rarely been applied in pre-Quaternary times (Henderson, Reference Henderson2002).
Boron was formerly used to estimate palaeosalinity, but water temperature and food supply influence concentrations (Furst, Reference Furst1981) and diagenesis changes them (Perry, Reference Perry1972). The B/Be ratios can, however, give an estimate of salinity (Dominik & Stanley, Reference Dominik and Stanley1993). The Onny B/Be ratios vary from 0.4 to 0.9, with the highest values in beds 2, 7 and 23 (Table 4). These values are an order of magnitude lower than reported from the Nile delta (Dominik & Stanley, Reference Dominik and Stanley1993) and from East China sedimentary and most igneous rocks; in fact, the highest Onny values occur only in the granitic rocks of East China (Gao et al. Reference Gao, Luo, Zhang, Zhang, Han, Zhao and Hu1998).
Onny Ba values are an order of magnitude lower than the reference sediments (Table 3) and the Ba/Al ratios, proxies for productivity, are also very low (Calvert & Pedersen, Reference Calvert and Pedersen2007) (Table 4). The values and ratios vary irregularly up the section and do not seem lithologically controlled (Ba is usually lower in sandstones). Barium in marine sediments is mostly in detrital plagioclase and in authigenic barite, which is produced biogenically by micro-organisms (Carrano et al. Reference Carrano, Schellenberg, Amin, Green and Küpper2009). So, the Ba/Al ratio gives an estimate of palaeoproductivity if compared with the detrital Ba/Al ratio (Reitz et al. Reference Reitz, Pfeifer, Lange and Klump2004). The Onny Ba/Al ratios are bimodal with values of 5 ± 2 and 11.8 ± 1.4 (Table 4), which are higher than the current marine detrital Ba/Al ratio (3.7) (Reitz et al. Reference Reitz, Pfeifer, Lange and Klump2004), but much lower than the Ba/Al ratios of the reference sediments (~ 29 to 55) (Table 4). Since we do not know the Onny detrital Ba/Al values, we can not infer actual palaeoproductivity (Dymond, Suess & Lyle, Reference Dymond, Suess and Lyle1992). But, it is interesting that there are sharp zigzags in the ratio up the section. If related to productivity, then these might reflect glacial/interglacial differences in productivity such as those determined by Quaternary δ18O isotope stratigraphy (Shimmield & Mowbray, Reference Shimmield, Mowbray, Prell and Niitsuma1991). The reasons for the very low Onny Ba/Al ratios compared with other sediments need to be investigated further.
Be/Th ratios are used to infer high particle flux, since Be is more soluble than Th and can be advected by ocean currents to be removed in areas of high particle flux (Kumar et al. Reference Kumar, Anderson, Mortlock, Froehlich, Kubik, Dittrich-Hannen and Suter1995), leading to a positive correlation between Be/Th ratios and productivity (Henderson, Reference Henderson2002). Onny Be/Th ratios are two orders of magnitude higher than the reference sediments, entirely owing to the very high Be content of the Onny sediments, so the actual values are of little significance (Table 4). The overall trend is, however, comparable to the Ba/Al trend and they may show relative productivity up the section (Fig. 9).
Selected trace element ratios.

Productivity can also be estimated from phosphorous content directly, but it is easily dissolved unless fixed in phosphate early. Onny P values and P/Al ratios are low, though comparable to the deep shelf marine clay of MAG-1 (Table 2).
Cd has very similar oceanic behaviour to phosphate and substitutes readily in calcite: the Cd/Ca in benthonic foraminifera is used to reconstruct the phosphate content of deep water, which is not well preserved in the sediment (Henderson, Reference Henderson2002). Cd/Ca ratios, however, need to be calculated by analysis of individual fossils, which we have not done. Onny Cd values are very high (Table 3).
Redox-sensitive trace elements, like Mo, U, V and, to a lesser extent, Cr and Co, tend to be more soluble under oxidizing conditions and less soluble under reducing conditions, resulting in authigenic enrichment in oxygen-depleted sediments (Wignall, Reference Wignall1994). Some, like Ni, Cu, Zn and Cd, are mainly associated with organic matter and may be retained in the sediment after the decay of organic matter in reducing conditions. All these elements, with slight variations, tend to co-vary up the Onny section with the highest values in the finer-grained sediments near the bases of sequences 2 and 3 (Table 3)
For redox conditions, we use the terms oxic (free O2 available), suboxic (concentrations of both O2 and H2S are very low), anoxic (no free O2, H2S limited to sediment pore waters) and euxinic (no O2, free H2S in water column) (Tribovillard et al. Reference Tribovillard, Algeo, Lyons and Riboulleau2006).
Sedimentary molybdenum data is commonly used as a palaeoredox proxy, with higher concentrations interpreted to show lower redox potentials (Tribovillard et al. Reference Tribovillard, Algeo, Lyons and Riboulleau2006), but is valid only in unrestricted basins, such as continental margins (Algeo & Lyons, Reference Algeo and Lyons2006). Onny Mo values are high (3 to 14 μg g−1) compared to all the reference sediments used, as are the Mo/Al ratios (Tables 3, 4). Higher Mo concentrations (up to above 30 μg g−1) are found in the shales immediately above the Upper Ordovician glacial diamictites in South Africa. In South Africa, the high Mo is attributed to suboxic and/or anoxic conditions during slow sedimentation with the Mo sequestered in Fe- and organic-rich materials caused by high HS− concentrations (Young, Minter & Theron, Reference Young, Minter and Theron2004). The Onny Mo values have, however, no consistent relationship with the Fe values (Tables 2, 3). In the first sequence (nos 2–7), the Fe increases without any Mo increase; in the second sequence (nos 14–23) Mo varies with little change in Fe; while the third sequence (nos 28–37) is similar to the second except for the lowest sample (no. 28) (Fig. 10). The Onny Mo/Al ratios (0.6 to 2.6) are all higher than the reference sediments, but show no consistent trends, and are in the oxic sediment field (Table 4). They are an order of magnitude less than those of the anoxic Cariacou basin sediments and comparable to that basin's oxygenated sediments (Lyons et al. Reference Lyons, Werne, Hollander and Murray2003).
Fe2O3/Mo plot.

Onny U and V values are low compared with reference sediments, which suggest low total organic carbon (TOC). U is pathogenically enriched in anoxic sediments with large amounts of organic matter, and authigenic U content was proposed as an index of bottom water anoxia by Wignall & Myers (Reference Wignall and Myers1988) (authigenic U = (total U) – Th/3). Onny authigenic U values vary from −0.1 to 1.1 μg g−1, which are well within the < 5 μg g−1 indicative of oxic environments (Jones & Manning, Reference Jones and Manning1994). Onny Th/U ratios are somewhat low compared with reference materials (Table 4; Fig. 9) and indicate suboxic conditions. The low Th/U ratios (1–3.2) could, however, not only be caused by anoxic depositional conditions, but also by diagenetic mobilization (Lev, McClennan & Hanson, Reference Lev, McLennan and Hanson1999). Low Th/U ratios also occur in sediments from active margin settings, which incorporate young crust from mantle-depleted sources (McLennan et al. Reference McLennan, Hemmings, McDaniel and Hanson1993). These sources, like the Onny sediments, have low U abundances associated with the low Th/U ratios.
Onny V/Sc, V/Cr and V/(V + Ni) ratios and are all low (Table 4), vary little and are typical of oxic conditions (Jones & Manning, Reference Jones and Manning1994; Rimmer, Reference Rimmer2004).
Onny Cr and Co values are average (Table 3). Both are supplied in the detrital fraction and indicate sources rather than palaeoenvironmental factors (Trobovillard et al. Reference Tribovillard, Algeo, Lyons and Riboulleau2006). Onny Cr/Al ratios are very low compared with reference materials (Table 4).
Onny Ni, Zn and Cd values are average to high, while Cu is low to average (Table 3). These elements are associated with organic matter, which suggests significant organic contributions to the Onny sediments. If Ni and Cu are not scavenged by organic matter then they are not enriched in sediments. High Ni and Cu indicate both that high organic matter flux brought these elements to the sediment and that reducing conditions allowed then to be fixed within the sediment; high Ni and Cu persist even if the organic matter is later oxidized (Tribovillard et al. Reference Tribovillard, Algeo, Lyons and Riboulleau2006). Onny Ni/Co ratios vary little (1.9–4.1), are lowest in beds 16 and 18 of sequence 2 and are higher than the reference material (Table 4; Fig. 9). They are wholly in the oxic field (Rimmer, Reference Rimmer2004). Ni/Co also indicates the ratio of organic to detrital matter, and the relatively high Ni/Co compared with reference materials is consistent with the higher productivity tentatively inferred from the high Be values and Be/Th ratios (Tribovillard et al. Reference Tribovillard, Algeo, Lyons and Riboulleau2006).
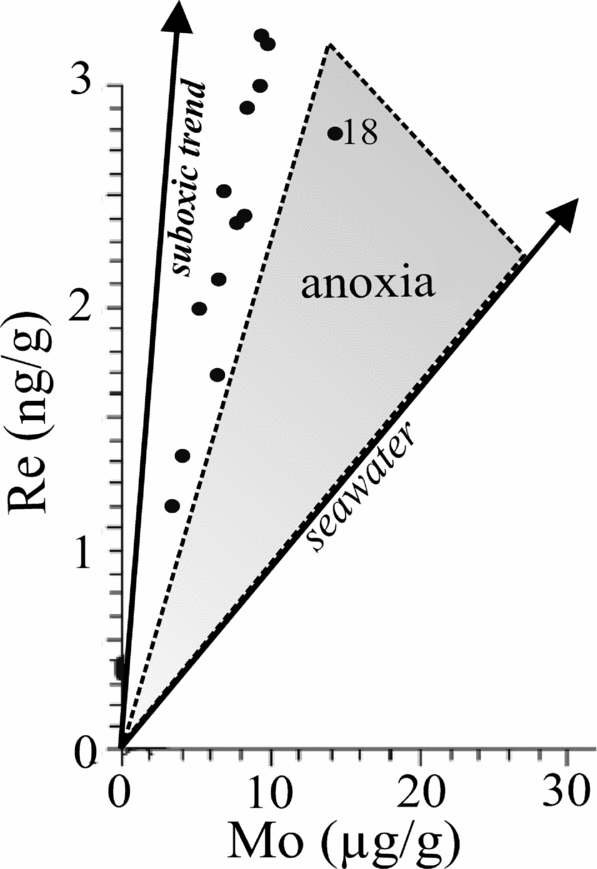
Onny rhenium (and all PGEs analyzed) values are average; but the Re/Mo ratio is very constant at 0.00033 to 0.00037, comparable to modern seawater (0.0004), except for sample no. 18 (0.0002), which also has the lowest Re/Os ratio (Table 4). These values indicate the boundary between suboxic and anoxic conditions in the sediment, except for sample no. 18, which is much lower (0.0002) and indicates anoxic conditions (Crusius et al. Reference Crusius, Calvert, Pedersen and Sages1996). For both Re and Mo, their ratios of seawater to crustal concentrations are higher than for any other redox-sensitive metal, in some cases by several orders of magnitude. Re is enriched in suboxic sediments while Mo is enriched in anoxic sediments (Crusius et al. Reference Crusius, Calvert, Pedersen and Sages1996). A Re/Mo ratio well above that of seawater (0.0004) indicates suboxic environments, while a Re/Mo ratio close to or below seawater indicates anoxic environments (Crusius et al. Reference Crusius, Calvert, Pedersen and Sages1996). Onny Re/Mo ratios are all along the suboxic trend (Fig. 11).
Re/Mo plot (basic diagram from Turgeon & Bromsack, Reference Turgeon and Brumsack2006, fig. 6)
The trace elements and ratios, therefore, suggest that the Onny sediments were deposited under oxic to suboxic conditions. In view, however, of the ‘glaebules’ detected from petrography, some of the trace elements may be enriched by the settling of faecal pellets. Zooplankton faecal pellets in the Sea of Japan, for example, are enriched in Ag, Cd, Ce and Cu, and depleted in Cr, Mn, Ni, Sc and Zn compared to average shale, though the degree of enrichment decreases drastically with depth as the organic pellets get preferentially oxidized (Fowler, Reference Fowler1977; Masuzawa et al. Reference Masuzawa, Noriki, Kurosaki, Tsunagai and Koyama1989).
6.e. Tectonic environment and provenance
The chemical composition of clastic sediments can be divided into a variety of geochemical groups attributed to different tectonic settings (e.g. Bhatia, Reference Bhatia1983), though there are many exceptions owing to local effects (Savage & Potter, Reference Savage and Potter1991; Floyd et al. Reference Floyd, Shail, Leveridge, Franke, Morton, Todd and Haughton1991). There is also a systematic change in bulk composition with grain size even within the same basin. From sandstones to siltstone to mudstones, there is a systematic increase in Rb, Cs, V, Cr, Co, Ni, Nb, Ta, Th, U and REEs, and a decrease in Si, K, Na and Ba (Cai et al. Reference Cai, Guo, Liu, Sui, Li and Zhao2008). Clay minerals are major hosts for most elements, and the contribution of accessory heavy minerals to bulk REE composition is minor (< 20%), though not necessarily negligible (Totten, Hanan & Weaver, Reference Totten, Hanan and Weaver2000). The Onny trace element values, with the possible exception of Th and U, confirm this as the higher element values are in the shales irrespective of stratigraphic position, though future studies need to analyse the detailed mineralogy of the Onny section. Nevertheless, trace element analysis seems the most accurate in assigning a sample to its source area (Eynatten, Barceló-Vidal & Pawlowsky-Glahn, Reference Eynatten, Barceló-Vidal and Pawlowsky-Glahn2003).
REEs, Th, Sc and, to a lesser extent, Cr and Co, are the most useful for provenance evaluation since these are the least soluble trace elements, are relatively immobile, are transported almost exclusively with the clastic fraction, and therefore reflect their source chemistry (McLennan & Taylor, Reference McLennan and Taylor1980). The ratios Ni/Al, Cr/Al and Mg/Al are not affected by grain size variations and can be used independently of the texture of the sample (Dinelli, Tateo & Summa, Reference Dinelli, Tateo and Summa2007).
For the Onny samples, the low Th/Sc ratios (< 0.7) indicate active margin derivation, and low La/Th ratios (< 3.8) and low V/Cr (< 1.4) indicate derivation from felsic sources, though relatively high Ni/Th (5–8.3) and Cr/Th (3.5–6.9) indicate sources containing ultramafic rocks (Table 4; Fig. 9) (Veizer & Mackenzie, Reference Veizer, Mackenzie and Mackenzie2004).
The restricted PGEs we could analyse limit useful ratios to Pd/Pt and Re/Os. Pd/Pt are all around 1.0, while Re/Os is around 0.34, except for sample no. 23 (0.2) (Table 4). The Pd/Pt ratios are the same as average continental crust as well as continental flood and oceanic plateau basalts and unlike meteorites (Brookfield et al. Reference Brookfield, Shellnutt, Qi, Hannigan, Bhat and Wignall2010). The Re/Os ratios are an order of magnitude higher than those of Recent anoxic Japan Sea sediments (0.01 to 0.02), but an order of magnitude less than MAG-1, the recent deep shelf clay (Table 4). They indicate suboxic environments within the Onny sediments; whether the overlying waters were oxic or suboxic can not be determined simply from the Re/Os ratio (Crusius et al. Reference Crusius, Calvert, Pedersen and Sages1996).
The palaeotectonic situation of the Onny section, from petrology and geochemistry, is a passive margin next to a marginal basin behind a continental arc like Japan, or a successor basin margin behind a basement uplift like the Cretaceous of the eastern Rocky mountains of North America. In these situations, much of the clastic sediment comes from continental basement and cover. Of the five modern geochemical subenvironments of the SW Japan Sea (a marginal basin passive margin), the Onny sediments resemble the inner shelf (type IV) and coastal and upper slope (type III) clusters, though the sediments are very variable, in their relatively low Mg, Ti, Fe, relatively high Cr, variable Zn and Co, and low Fe/Al ratios (Cha et al. Reference Cha, Choi, Lee and Shin2007). They also resemble, with the exception of lower Mn, the deep sea sediments of the Nankai trough, southeast of southern Japan, which mostly derive from northeasterly transport by the Kuoshiro current from the southern Japanese islands (Minai, Matsumoto & Tominaga, Reference Minai, Matsumoto, Tominaga, Kagami, Karig and Colbourn1977).
The Onny sediment trace elements all plot in the continental island arc fields of Bhatia & Crook (Reference Bhatia and Crook1986), exclusively so on the ternary Th–Sc–Zr and Th–Co–Zr plots, which are most diagnostic as to the tectonic setting (Figs 12, 13), and mostly in the same field on the La/Y versus Sc/Cr plot (Fig. 14). The continental island arc category encompasses dissected magmatic arcs and recycled orogens, with modern examples of Japan, the western United States and Puerto Rico, and approximates to the basement uplift and dissected arc categories of Dickinson & Suczek (Reference Dickinson and Suczek1979), though it is particularly difficult to assign provenances in complex tectonic areas, as Dickinson (Reference Dickinson and Zuffa1985) realized. Also, the lack of an integrated land biome in the Ordovician means that weathering processes were unlike modern environments, and trace elements could not be supplied from continental vegetation (Knoll & James, Reference Knoll and James1987). Temporal fluctuations in organic compounds (and their associated trace elements) in Caradoc sediments have elsewhere been attributed to fluctuations in abundance and type of marine plants, including the enigmatic Gloeocapsomorpha prisca (Pancost et al. Reference Pancost, Freeman, Patzkowsky, Wavrek and Collister1998; Zhao et al. Reference Zhao, Zhang, Bian, Xiao, Li, Peng and Qing2000).
Onny samples plotted on Th–Sc–Zr diagram showing tectonic fields (from Bhatia, Reference Bhatia1983).

Th–Co–Zr diagram as 12 (from Bhatia, Reference Bhatia1983)

La/Y versus Sc/Cr plot showing tectonic fields and Onny samples plotted (from Bhatia, Reference Bhatia1983).

Zirconium (Zr), like titanium, occurs in minerals that are both chemically and physically resistant in weathering and transport (Milne & Fitzpatrick, Reference Milne, Fitzpatrick, Dixon and Weed1977), occur in the fine sand and silt fractions, and are transported with the fine and medium sand quartz grains. Onny zirconium values are incredibly low, as are the Zr/Al and Zr/Th ratios, which are problematic (Tables 3, 4). Of the HFSEs analysed, the major element titanium (and Ti/Al ratios) is at normal shale values while the other HFSEs analysed, zirconium, niobium, tantalum, uranium and thorium, are low or incredibly low compared with most other shales and sandstones (Tables 3, 4). The Nb values and Nb/Ta ratios are an order of magnitude lower than any other recorded ones except MAG-1 (Tables 3, 4). We originally thought that there must be an error in the Nb analyses, but the RSD values suggest not (Table 3). Ta values are near normal, or even slightly enriched for the reference materials (Table 3). Either HFSEs (except Ti) were somehow removed prior to sedimentation or depleted in the source rocks.
One possibility is that the fine sand and silt fraction of the Onny sediments was supplied by the wind rather than by streams. The common titanium-bearing minerals, titanmagnetite and ilmenite, are softer than zircon and can be degraded by wind action so that aeolian dust may have higher concentrations of Ti than Zr. In desert basins, fine sediment composition (dust) is influenced by a long history of transport, with physical winnowing removing Zr, Hf and Th, and chemical leaching removing Na, K and Rb (Moreno et al. Reference Moreno, Querol, Castillo, Alastuey, Cuevas, Herrmann, Mounkaila, Elvira and Gibbons2006). This, however, does not apply to the other HFSEs (Castillo et al. Reference Castillo, Moreno, Querol, Alastuey, Cuevas, Herrmann, Mounkaila and Gibbons2008).
Another possibility is depletion in HFSEs at source. HSFE depletion occurs in both arc and ridge magmas (Haase et al. Reference Haase, Stroncik, Hékinian and Stoffers2005). Fractional crystallization processes operating in the Lesser Antilles tend to retain relatively constant Nb/La ratios despite increasing Zr/Sm and decreasing Ti/Eu ratios (Thirlwall et al. Reference Thirlwall, Smith, Graham, Theodorou, Hollings, Davidson and Arculus1994). These observations also apply to the Onny sediments, so it may be possible to reconstruct the igneous sources of the Onny sediments. Relatively high Gd/Yb ratios (1.4–2.9) distinguish within-plate volcanics from island arc tholeiites and high Zr/Y (3–12), Ta/Yb (0.3–0.7) and low Zr/Nb (< 12) ratios strongly support a continental affinity (Yuan et al. Reference Yuan, Sun, Yang, Zhou, Zhou, Malpas, Fletcher, Ali and Aitchison2004). Apart from somewhat low Zr/Y ratios, these ratios are close to Onny ratios (Table 4).
7. Conclusions and future work
The petrology and inorganic geochemistry of the sedimentary rocks of the Onny type section of the Caradoc Series indicate that they were deposited on a passive margin of a marginal basin similar to the present Sea of Japan or adjacent to basement uplifts like the Late Cretaceous successor basin of the eastern Rocky mountains. Like other successions, the Onny section shows a close relationship between the inorganic geochemistry and the inferred sequence stratigraphy (Jarvis, Murphy & Gale, Reference Jarvis, Murphy and Gale2001). The lower beds up to the Alternata Limestone Formation form a transgressive–regressive unit in which the rocks become less mature upwards. Na2O, MgO and Fe2O3 reach a maximum in the Horderley Sandstone Formation and decrease markedly above this, accompanied by an increase in K2O, in the Alternata Limestone Formation. All the coarser sediments above the basal Coston quartzites and conglomerates are greywackes in which the apparent muddy and ferrous matrix is the result of breakdown of unstable minerals and particles; an oxygenating depositional environment is shown by the trace element ratios. The low HFSE (Zr, Nb, REE, Th, U, Ta) values and ratios to other elements indicate that the resistant minerals containing these elements were somehow removed prior to deposition. CIA values suggest that the Horderley Sandstone Formation underwent greater physical weathering than the beds above and below, which fits the petrography and corresponds with a cooler episode flanked by warmer periods prior to the Hirnantian glaciation. The lack of an integrated land biome in the Ordovician means, however, that, unlike modern environments, trace elements could not be supplied by transported continental vegetation, but mostly from marine organisms, including some peculiar plants (Knoll & James, Reference Knoll and James1987; Pancost et al. Reference Pancost, Freeman, Patzkowsky, Wavrek and Collister1998). In modern oceans, plankton enriched in metals make a significant contribution to the total sediment composition, especially Cd, U and Mo (Nameroff, Balistrieri & Murray, Reference Nameroff, Balistrieri and Murray2002). For example, giant bacterial mats the size of Uruguay float in the oxygen minimum zone off the west coast of South America (Deutsch et al. Reference Deutsch, Sarmiento, Sigman, Gruber and Dunne2007). Such oxygen minimum zones may have existed in the Caradoc sea, but require organic, as well as inorganic, geochemical studies to detect them. The lack of vegetation may help explain evidence for supply by wind, rather than by streams, from arid sources. Though the Onny palaeolatitude may be somewhat south of the current desert trade wind belt, the winds would still be offshore in the southern hemisphere summer (Armstrong et al. Reference Armstrong, Baldini, Challands, Gröcke and Owen2009).
Firmer conclusions require mineralogical and organic geochemical analysis of these Onny sediments.
Acknowledgements
MB thanks his cousins Brian and David Brookfield in Whittington, Shropshire for accommodation and support during the study. RH thanks J. Williams for assistance with XRF analyses. Funding for this research was provided, in part, by a grant (RH, UMass S&T) and by the University of Massachusetts Boston Environmental Analytical Facility. We thank Nigel Woodcock (especially) and two unknown referees for their careful and constructive evaluation of the manuscript.