What happened to the occupational structure of Britain between the start of the sixteenth and the end of the eighteenth centuries? Few other questions have so much impact upon our understanding of the timing and speed of changes in the British economy before the Industrial Revolution. Occupational structure is a key indicator of industrial development, specialisation, and economic growth. For an era for which we possess few direct indicators of economic trends, a serial source for occupational structure offers significant opportunities to deepen our understanding of economic change in Britain.
Our current knowledge of Britain’s occupational structure consists of two estimates for the 1520s (drawn from the same source), one estimate for the 1570s, one for the 1650s, several for 1688 (all from the same source), and one for the 1710s. This may appear as an excess of riches compared to the dearth of information in some countries, and it is a large step from the view taken by Phyllis Deane and W.A. Cole that any attempt to identify sectoral shares in this period was likely impossible due to the lack of evidence (Deane and Cole Reference Deane and Cole1962, pp. 3, 137). But several of these estimates are sufficiently different from each other that they suggest mutually irreconcilable accounts of economic change.
Unsurprisingly, the differences between these estimates are related to the varied sources each author has relied upon. Gregory Clark, Joseph Cummins, and Brock Smith’s (Reference Clark, Cummins and Smith2012) analysis for the 1570s and 1650s uses evidence drawn from probate records—wills and related documents—to show a stable share of the workforce employed in agriculture in the sixteenth and seventeenth centuries. Their two samples both show that the share in agriculture in England hovered around 60 percent (Clark, Cummins, and Smith Reference Clark, Cummins and Smith2012, pp. 378, 381). Clark, Cummins, and Smith also highlight that England already had a high share of its workforce outside agriculture from an early period, reflecting a relatively wealthy economy in premodern terms. Indeed, their probate evidence supports Clark’s (Reference Clark2007a) view that there is “little sign” of economic growth between 1400 and 1800 (Clark, Cummins, and Smith Reference Clark, Cummins and Smith2012, p. 387).
Quite different conclusions emerge from the other sources that have been explored to date. Leigh Shaw-Taylor et al. (Reference Shaw-Taylor, Wrigley and Kitson2010, p. 10) use information from baptism registers to estimate that 43 percent of males were employed in agriculture circa 1710, well below Clark, Cummins, and Smith’s estimate for the 1650s and indicating a much earlier shift out of agriculture and into services and industry. Stephen Broadberry, Bruce Campbell, and Bas van Leeuwen (Reference Broadberry, Campbell and Klein2015, pp. 350–56; see also Broadberry, Campbell, and van Leeuwen Reference Broadberry and Campbell2013) generate an alternative set of labor force shares for 1522 (using Muster Rolls) and circa 1700 (using Gregory King’s 1688 social table). Like Shaw-Taylor et al., they identify a fall in the share of the male labor force in agriculture from 68 percent in 1522 to 46 percent circa 1700. This figure for 1700 is somewhat lower than the 55.6 percent in agriculture that Nicholas Crafts (Reference Crafts1985, pp. 13–15) had estimated using Peter Lindert and Jeffrey Williamson’s (Reference Lindert and Williamson1982) revisions to the same source, largely because of a different, and probably more accurate, distribution of laborers across the sectors. Broadberry et al.’s estimates for 1759 and 1801 suggest that this decline continued across the eighteenth century. Their conclusion is, predictably, the opposite of Clark, Cummins, and Smith’s. Instead of stability, they conclude that “the critical occupational migration from agriculture to industry commenced some time after 1522 and had already made significant progress by 1700.” This was “consistent with considerable dynamism and growth from the sixteenth century to the point in the nineteenth century when modern economic growth began” (Broadberry, Campbell, and van Leeuwen Reference Broadberry and Campbell2013, p. 26).
In this article, we show that the apparent conflict between these estimates is in fact illusory. Using a new, larger and more representative sample of probate records, we find a pattern of structural change that is consistent with all existing estimates—once they are appropriately adjusted. We introduce a second new and large source on occupational structure, the occupations of London apprentices’ fathers, to benchmark our probate dataset, and show that both sources are broadly consistent with each other. However, while the point estimates produced by earlier authors can be reconciled, the conclusions that have been drawn from them cannot. We show that the English economy saw rapid and significant structural change during the seventeenth century in line with Broadberry et al.’s account. Our data allow us to be more precise on the timing of this development. Movement out of agriculture became visible from c. 1600 when the sector employed around 68 percent of the male labor force, much as it had done a century before. Structural change accelerated from before the middle of the seventeenth century and by the early eighteenth century only around 48 percent of the male labor force were still in agriculture, a remarkably low share compared to other countries in that period. With structural change, productivity rapidly rose across all three sectors, and grew especially fast in industry. England had inherited particularly productive agriculture and developed proto-industry from the Middle Ages and the seventeenth century saw an intensification of these characteristics, with high levels of non-agricultural employment in the countryside. By contrast, the early modern Welsh economy was largely unchanging.
Sectoral Shares, 1550–1800: Probate and Apprenticeship Data
The main estimates of occupational structure that we present here are drawn from a large sample of adult males’ occupations reported in English and Welsh wills and related records registered with one of the many church courts that supervised the probate process. To this, we add a second large sample of the occupations of fathers of apprentices whose indentures were recorded by a range of London guilds.
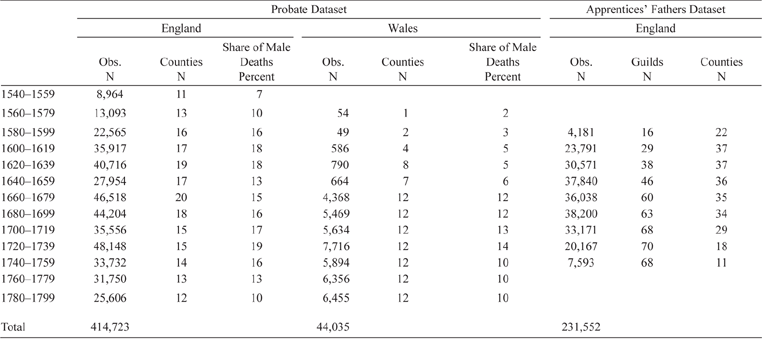
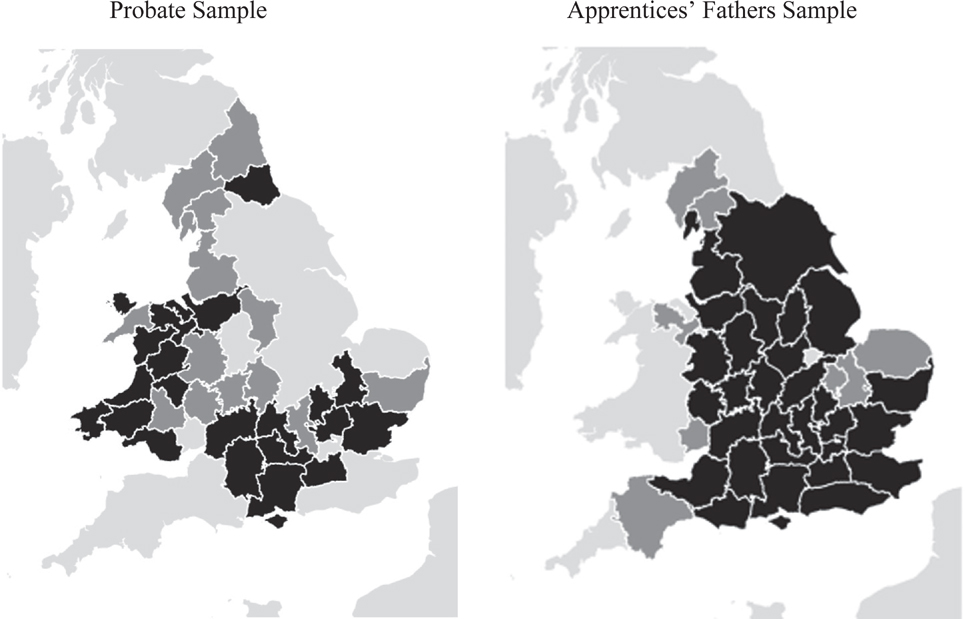
Table 1 summarizes the size and extent of our samples. For our probate sample, we surveyed all extant printed registers of wills and available digital records, and included data if it met several conditions for completeness (detailed in Appendix 1).Footnote 1 Our final sample of male wills with a reported occupation (rather than a status such as “gentleman”) that can be identified with agriculture, industry, or services contains nearly 415,000 observations from 23 of 42 English counties and 44,000 from 12 of 13 Welsh counties. Figure 1 shows the geographical extent of our sample. To mitigate the risk that changes over time in the sample of counties we can include affect the observed trends, we also analyse a balanced sample of 12 counties with records for at least 10 of the 11 20-year periods between 1580–1599 and 1780–1799.
Datasets

Note: Columns 2 to 7 report the number of probate records with an occupation successfully linked to agriculture, industry or services (see Appendix 1), the number of comities with probate records that meet our criteria, and the share of male deaths with a linkable occupation or status (including gentry, etc.) captured in our sample. Columns 8-10 reports a count of apprentice records where we have information on the place and occupation of the apprentice’s father, and the number of guilds and comities in our analysis for each decade.
Source: See text and Appendix 1.
Geographical Coverage of Probate and Apprentices’ Fathers Samples

Our sample of apprentices’ fathers’ occupations is rather different.Footnote 2 Large numbers of teenage boys—perhaps one in ten of all English youths by the 1690s—migrated to London to learn a trade (Minns and Wallis Reference Minns and Wallis2012, p. 559). Among the details recorded by the city’s guilds when their indentures were registered was their father’s occupation or status and location. Mothers were rarely recorded, and almost never with an occupation. Once we exclude counties for which the sample size is low (the rules applied are detailed in Appendix 1), our final sample includes the fathers of 231,552 youths—roughly 4 to 5 percent of English teenage males in the seventeenth century—drawn from 37 counties across England. The balanced sample of 20 counties for which coverage in this dataset is complete across the seventeenth century includes just over 70 percent of the English population.
Probate records are a complicated source with serious biases in coverage (Lindert Reference Lindert1981; Goose and Evans Reference Goose and Evans2000; Keibek and Shaw-Taylor Reference Keibek and Shaw-Taylor2013; Keibek Reference Keibek2016a, Reference Keibek2016b). As wills concerned the transfer of property after death, women, dependent males (especially the young), and people with limited wealth and, in particular, few capital goods are under-represented. Moreover, the volume of probate records was also shaped by institutional factors, such as differences in record keeping and activity between courts (which took fees for their services), which intensify regional variations in their coverage and survival. The size and impact of these biases on our results are discussed later. For the present, we focus on trends in sectoral shares, treating our results as an index of structural change rather than a direct estimate of the level of employment in agriculture, industry, and services.
The apprentices’ fathers’ sample is also affected by bias. It too oversamples the wealthy and the old: we are observing adults who established families and who could afford to invest in their children’s human capital. However, in some important respects the biases are different. There is no reason to expect a capital bias (as distinct from wealth) in the apprentice dataset. Even though laborers are rare among parents, the sample’s social reach may be deeper: many youths were entering prosaic manual trades such as blacksmithing and shoemaking that might require little or no fee (Minns and Wallis Reference Minns and Wallis2013). We do expect the apprentices’ fathers’ sample to underrepresent agriculture to a particularly high degree. These fathers had no direct experience of the trades learned through apprenticeship. Their sons may also have a farm to inherit. The central problem of the apprentices’ fathers’ sample is the impact of the narrowing migration field over the seventeenth century, evident in the falling number of counties meeting our sampling criteria (Table 1): for this reason, we regard it as a less reliable indicator of trends than the probate sample.
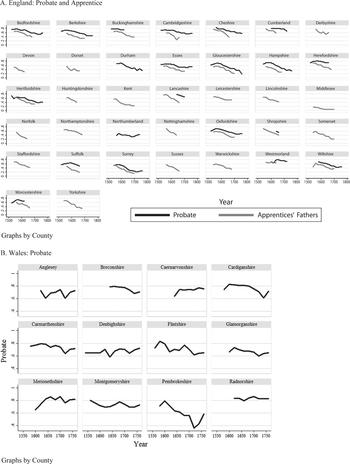
A good introduction to our main results is given in Figure 2, which reports the average of the share of males in agriculture in 37 English counties at 20-year intervals between 1540 and 1799. The figure reports series for which our data covers more than a decade or two. Here we are primarily interested in the trend, not the absolute level, given the problems with bias in these sources. As expected, the probate sample reports a higher share in agriculture than the apprentice sample. Yet, the shares in agriculture observed in both the probate and the apprentice samples are similar for most counties and move in the same direction; the correlation coefficient is 0.82.
Share of Males Working in Agriculture by County

Most of England saw a shift out of agricultural employment after c.1600. Three counties in the northernmost parts of England—Cumberland, Northumberland, and Westmorland—had more stable shares in agriculture. In Wales, similarly, the agriculture share was high and stable. Only Pembrokeshire, always considered to be culturally set apart from the rest of Wales, appears to have experienced a marked shift out of farming. The initial impression from Figure 2 is that Clark, Cummins, and Smith’s suggestion that the share of the workforce involved in farming and fishing in England was stable is mistaken.
To address the development of the national economy more fully, we need to convert our county series into national ones. Three adjustments are necessary to do this. We first weight our county sectoral data using county population estimates extrapolated with national population trends for England and linearly interpolated for Wales (Wrigley Reference Wrigley2007, Reference Wrigley2009; Owen Reference Owen1959).Footnote 3 Second, because our probate dataset omits London, we calculate a population-weighted average of the non-London (from the previous step) and London sectoral shares; our sectoral estimates for London rely on the surviving probate data for Middlesex, which show that around one-third of the city’s population was employed in industry and two-thirds in services.Footnote 4 Finally, because wills were mainly generated near death (on average at age 53), occupational estimates from probate records lag the population as a whole (in which the average worker was aged 39 (Clark, Cummins, and Smith Reference Clark, Cummins and Smith2012, p. 384)). We therefore adjust for the age structure of our data.Footnote 5 We do this simply by advancing our series by two decades, so that, for example, our data for 1620 is taken as representing 1600. We apply the same general approach to the apprentices’ fathers’ dataset, weighting it by population and adjusting for age structure: apprentices’ fathers were on average 52 years old when their son was bound.Footnote 6 However, as Middlesex forms a very large part of the apprentice data, we do not need to adjust for London.
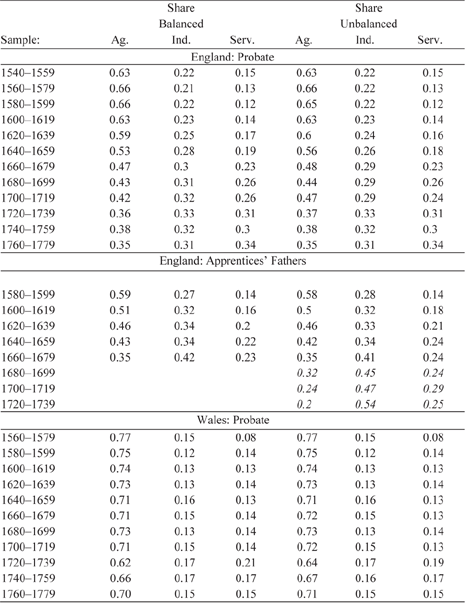
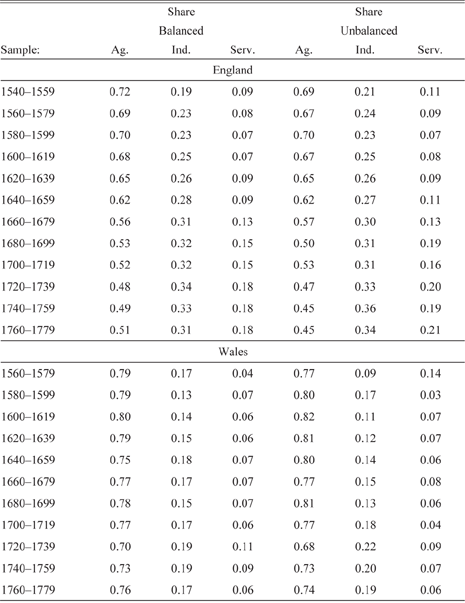
In Table 2, we report our estimates of sectoral shares for England and Wales from the probate and apprentice samples.
Sectoral Distribution of the Labor Force from Probate and Guild Records

Note: The probate balanced sample contains 12 counties with records for at least 10 of the 11 20-year periods between 1580–1599 and 1780–1799: Bedfordshire, Berkshire, Cambridgeshire, Cheshire, Durham, Essex, Gloucestershire, Hampshire, Hertfordshire, Oxfordshire, Surrey. The two counties with missing observations are Durham (1640–1659) and Wiltshire (1600–1619). In the apprentices’ fathers’ dataset the balanced sample contains 29 counties, the unbalanced sample includes data from 36 counties. For 1680–1699 onwards, the apprentice sample unbalanced index is based on a small number of counties, with only 11 in the final period (in italic).
Source: See text and Appendix 1.
For England, the probate dataset shows that a broadly stable share of the workforce who made wills were engaged in farming and fishing in the sixteenth century, followed by a clear and persistent movement out of agriculture from the start of the seventeenth century onwards. The impact of this movement on the overall share in agriculture in the early seventeenth century was initially modest. The farming share around 1650, 53 percent, was only around 10 to 15 percent lower than at the close of the sixteenth century (66 percent). By the end of the seventeenth century, however, the share of the workforce in agriculture had fallen by around one-third to 43 percent. Over the same period, the share of the workforce in industry had grown from 22 percent to 31 percent, while the share in services had more than doubled from 12 percent to 26 percent. The trends are little changed whether we focus on the balanced or unbalanced samples.
The apprentice dataset, which is richest and most reliable from 1580 to 1680, tells much the same story for the seventeenth century. As we expected, the underlying shares of apprentices’ parents in industry and services are higher than in the probate dataset, but the trends move in parallel. Agriculture declines consistently over this period. Industry and services both grow substantially, with services outstripping industry. Compared to the probate data, the share of the workforce in agriculture declines more quickly, while the rate of expansion in industry is somewhat slower in the first half of the seventeenth century, although it reaches a similar level by 1660–1679. The growth in services is similar to the probate dataset. This coherence between the results from two independent sources offers a first test of the validity of our findings.
In Wales, we see much less evidence of structural change. The share of those appearing in the probate record who worked in agriculture in the mid eighteenth century, 66 percent, was only about 10 percent below the 75 percent seen in the late sixteenth century. The share in services had risen by the same amount. Industry was as small at the end of the period as it was at the beginning, at about 15 percent. These estimates are based on smaller numbers and so are more volatile and less precise than those for England, particularly for the late sixteenth century. Still, they give an impression of a relatively unchanging Welsh economy, and they fit well with the historical consensus that, despite growing prosperity among some farmers, secondary or even mining activity was slow to develop in Wales (Jenkins Reference Jenkins1987, pp. 270–75; Powell Reference Powell2007). Glanmor Williams (Reference Williams1993, pp. 56, 395) suggests that as late as 1700, mining and industry were “far more like they had been in 1400 than what they would be in 1850.”
We need to ask why our results are so different to those that Clark, Cummins, and Smith (Reference Clark, Cummins and Smith2012) derive from their analysis of probate data. It is not because our sample captures different wills. Our data includes all of Clark, Cummins, and Smith’s data for the 1650s and most of it for the 1560s. Nor is it because of how we treat the records: our raw statistics on the share of the workforce in agriculture in the counties in which our datasets overlap are basically the same.
The difference between our final results and Clark, Cummins, and Smith’s estimates has three main causes. The first is methodological: the adjustments we make for London and for age. Clark, Cummins, and Smith’s second data point (for the 1650s) is effectively a sample of the occupational structure circa 1638–1645, a time when the change in the agricultural share is only just becoming visible. Their failure to take London into account also leads them to understate structural change. London exploded from around 80,000 inhabitants in 1550 to around 400,000 by 1650, growing from 2.6 percent to 7.5 percent of England’s population. People in London were highly unlikely to be working in farming or fishing. Even if the share of the workforce in agriculture in rural England had remained constant, the growth of London means that the national share in agriculture declined.
The second reason for the difference between our results and Clark’s is the dating of our samples. Clark, Cummins, and Smith’s first dataset for the 1560s covers a period when the share of workers in agriculture in the probate record was rising in a number of counties (visible in Figure 2). This is likely to be a mechanical result of improvements to record keeping by church courts following Henry VIII’s probate reforms.Footnote 7 We also exclude some of the counties Clark, Cummins, and Smith use, as we consider the share of surviving probate records with data to be too low to be reliable.Footnote 8 By 1600, the quality of the probate record has improved markedly, and from then onwards it remains good, even as the share of the workforce in agriculture that it reveals begins to decline in most of England. The third reason is that our sample covers a wider and more balanced geographical area. Clark et. al.’s evidence for the 1560s is primarily from the south of England. Only one county in their sample is located in the north, Cheshire, which supplied just 92 wills in that decade, equivalent to around 2 percent of male deaths in the county. The more agricultural north of England is thus poorly represented in their dataset for this period.
The probate and apprentice datasets do not provide direct estimates of the shares of workers in agriculture, industry, and services, but rather indices derived from particular sub-populations. The most obvious test of the value of these indices, and the account of structural change they offer, is the coherence of the series we obtain when they are linked to the various estimates of occupational structure that exist in the literature. This also allows us to confirm which of the estimates in the literature are accurate.
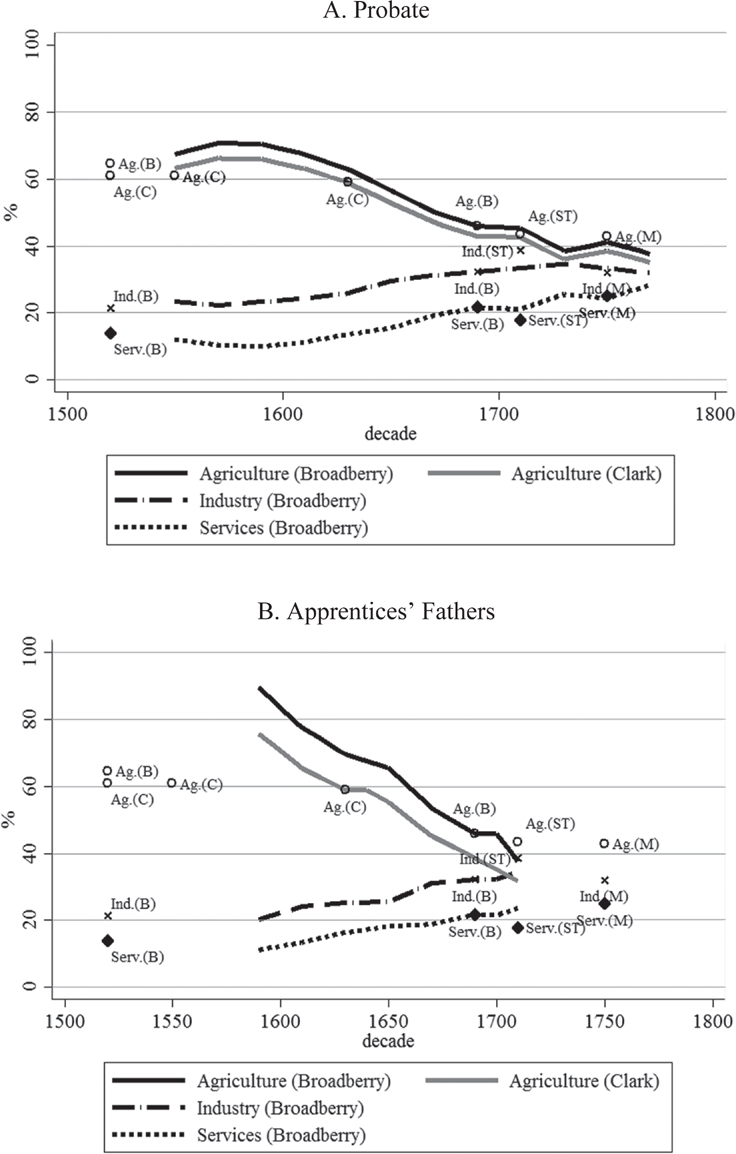
The existing estimates for the period before the mid-eighteenth century apply only to England so we omit Wales from our discussion. In Figure 3, we explore what happens if we tie our probate and apprentice indices to two of the three main published estimates for the seventeenth and early eighteenth centuries. The time series in Figure 3 have been constructed by linking to Broadberry et al.’s benchmark for 1688/1700 and Clark, Cummins, and Smith’s benchmark for 1630 (for clarity, we do not show a separate series tied to Shaw-Taylor et al.’s figures here, as the results are very close to those tied to Broadberry et al.’s estimates). For example, the 1650 estimate for the agricultural share in the Broadberry estimates have been calculated by multiplying Broadberry et al.’s benchmark for 1690 by the ratio of the 1650 probate estimate in Table 2 to the 1690 probate estimate. Other dates and series are constructed in an analogous manner. Put simply, we show how the sectoral shares would look if the estimates by other scholars correctly measured the levels and our series rightly identified the trends. For comparison, we also show Broadberry et al.’s estimates from the Muster Rolls for 1522 and for 1759 from Massie, and Shaw-Taylor et al.’s estimates for the 1710s. We treat Clark, Cummins, and Smith’s estimate for 1653–1660 as reflecting the 1620–1639 occupational structure, because of the age profile of the probate sample it contains.
Sectoral Distribution Over Time, Indices Tied to Existing Estimates

The result of linking our probate indices to the existing estimates is striking. On this measure, in panel A there is essentially no historically meaningful conflict between Clark, Cummins, and Smith’s, Broadberry et al.’s, or Shaw-Taylor et al.’s estimates of the agricultural share. All fit on what is essentially the same trend line. The differences between the series we construct here are in the order of 1 or 2 percentage points in any one decade, surely within any reasonable margin of error. The lines also fit well with estimates for the early sixteenth century that have been calculated from the Muster Rolls, and they also match tidily with Broadberry et al.’s reinterpretation of Massie’s figures for agriculture.
By comparison, the index we construct from the apprentices’ fathers data, given in Figure 3, panel B, shows too steep a decline in the share of workers in agriculture to be plausible. In part, the weakness of the series reflects the necessary projection to bridge the gap between the end of the series and Broadberry et al.’s estimates; the linear decline that we find in the apprenticeship series is innately unsustainable when extended too far. But equally important is the failure to capture the stability of the share in agriculture in the late sixteenth century.
It seems reasonable to conclude that the probate series is likely to give a more accurate reflection of the distribution of occupations in the male population as a whole. The apprenticeship series provides an independent confirmation that the trends in the probate series are moving in a plausible way, but it is not as good a guide to sectoral change in its own right.
An initial examination of our datasets suggest two main results. Firstly, we find strong evidence of substantial structural change in England between 1550 and 1700. Secondly, we date the start of this movement out of agriculture to the early seventeenth century, rather than the late seventeenth to early eighteenth centuries, as suggested by Crafts (Reference Crafts1985, pp. 11–15).
Problems of Bias in Probate Data
How robust is our account of structural change? To address this question, we now discuss the four main potential sources of error that affect our probate and apprentice datasets: geographical gaps, lifecycle bias, different death rates, and, most important of all, wealth and capital bias. Other concerns with probate evidence, notably the impact of by-employment, have been extensively discussed—and largely laid to rest—in recent works by Sebastian Keibek (Reference Keibek2016c), Keibek and Shaw-Taylor (Reference Keibek and Shaw-Taylor2013), and Clark, Cummins, and Smith (Reference Clark, Cummins and Smith2012).
The first issue is geography. Although our probate dataset covers a broader geographical sample than Clark, Cummins, and Smith’s, it misses some important parts of the country, notably in the Midlands and Yorkshire (see Figure 1). There is no easy way to be sure about how well our sample represents the sectoral distribution of the whole country, but Anthony Wrigley’s (Reference Wrigley2007, Reference Wrigley2009) county population estimates for 1600 onwards suggest one test. Economic growth is expected to cause population growth, which is thus often used as a proxy for it. Therefore, we would expect that estimates based upon our sample will underestimate sectoral change at a national level if the population of the sampled counties grew more slowly than the population of counties left out, or vice versa. From 1600 to 1700, the average increase in the population of counties in our probate sample was 23 percent, compared to 22 percent for counties outside our sample. Between 1700 and 1750, the populations of the counties in our sample grew substantially faster than those outside the sample (18 percent vs. 11 percent), while after 1750 the populations of the counties in our sample lagged those outside (34 percent vs. 46 percent). If we apply the same test to the stable sample in the apprentice dataset, we find that their populations grew slightly more quickly than counties outside (22 percent vs. 21 percent). On this basis, we feel relatively confident about the validity of both samples for the seventeenth century, the period we are most concerned with, because the counties in our samples grew at close to the same speed as the country as a whole. We are less confident about the representativeness of the probate series after 1700.
The second issue is lifecycle bias. Because death and being a father of teenage boys are more common among older adults, our datasets will under-represent young workers, such as domestic servants, servants in husbandry, and apprentices. They will also tend to under-record groups who are highly mobile, and those who may at times die overseas, such as soldiers and sailors. However, there is no reason to believe that the sectoral distribution of workers’ early years of employment changed sufficiently to affect trends during this period. Agriculture and industry both consistently employed large numbers of young workers (Kussmaul Reference Kussmaul1981; Minns and Wallis Reference Minns and Wallis2012, p. 559; Field Reference Field2013). Before the arrival of factories in the late eighteenth century, neither group experienced an institutional or technological shock that substantially shifted the age-structure of the workforce.
Soldiers and sailors are relatively rare in probate data, only exceeding 1 percent of the sample for a few periods in the later seventeenth and eighteenth centuries. By contrast, estimates of mustered naval manpower alone equal roughly 3–5 percent of the English adult male population in the first half of the eighteenth century (Rodgers Reference Rodgers2004, p. 636–37).Footnote 9 Mariners outside the navy were common in the probate record, though, peaking at 6 percent of males in 1740–1759, and may encompass some men serving in the navy (the occupational terminology is sometimes vague). Aside from short periods of intense conflict, notably in the civil wars and Napoleonic wars, the impact of these omissions is likely to be modest, and they are unlikely to change the implications of our findings. Servants, soldiers, and sailors are all part of the service sector. Hence, because our results indicate that England had a high and growing share of males working in services, if we are under-estimating military employment then a correction to account for this would probably only further strengthen the case for identifying structural change in this period.
The third issue is that if death rates significantly differed across sectors then the probate record would under-represent sectors with relatively low death rates, as compared to society at large. How big was this bias in early modern Britain? Existing estimates of urban and rural adult life expectancy suggest that correcting for the effect of the urban mortality penalty would require an upward adjustment to the agricultural share of an average of less than 2 percentage points (see Figure S2.1). It is therefore safe to neglect the urban mortality penalty for the purpose of this analysis.
Finally, the biggest issue with using probate records (and to some extent the occupations of apprentices’ fathers) is the bias towards those with wealth and capital: wills were devices to transfer property after death, and so were much more frequently written by the wealthy and asset-rich than the poor.Footnote 10 The potential impact of this type of selection bias is most obvious in estimates of occupational shares, where better-rewarded occupations, such as merchants or millers, will be over-represented compared to bricklayers and shepherds. But trends can potentially be biased too. The share of individuals leaving a will varied over time. Economic growth might push up this share, if growth translated into greater individual wealth. Moreover, if productivity grew more rapidly in one sector than others, then workers in the expanding sector might leave more wills and produce a higher share of probates than previously, even if the number actually employed was unchanged. On the other hand, if inequality increased in a sector, as we would expect with proletarianization or enclosure, then the share of workers leaving wills could decline.
It is difficult to tell a priori whether the representation of industry or agriculture will be distorted more as a result of this selection bias, and there are some reasons to think that selection had broadly stationary effects, mainly affecting levels rather than trends. Clark, Cummins, and Smith (Reference Clark, Cummins and Smith2012, p. 374) find that probates were generated roughly in proportion to the population in rural and urban areas, and only “modestly oversample” rural areas because farming was capital intensive. The capital intensity of agriculture and hence its effect on the probability of making a will did not change greatly between 1550 and 1750. Animals made up a large share of the agricultural capital stock and livestock intensity in farming remained roughly stable in early modern England (Allen Reference Allen2005, p. 8; Broadberry Reference Broadberry2013, p. 11). Implements, the other main capital component of pre-modern farming, appear to have increased significantly in importance only after 1750 (Allen Reference Allen2004, p. 109, Reference Allen2005, p. 8). As for industry, it continued to be labor-intensive for most of the period under analysis. Until the Industrial Revolution, manufacturing mainly relied on hand tools and human energy (Broadberry et al. Reference Broadberry, Campbell and Klein2015, p. 366). The kinds of increase in the concentration of capital and income inequality that might bedevil our estimates were rare before the later eighteenth century, so far as we can tell.
That said, there are some signs of changes in the relative productivity of sectors that might undermine this assumption. In Clark’s (Reference Clark2005, Reference Clark2007b) wage data, building workers’ incomes start to pull away from the 1620s, and from the 1680s masons consistently earn around one-fifth more than agricultural laborers. In Robert Allen’s (Reference Allen2001) wage data, the early seventeenth century is a period of relative prosperity for agricultural workers, and it is not until the 1680s that their earnings fall below those of building laborers. Higher earnings in construction might signal a wider rise in urban incomes that could lift the chance that industrial and service workers appear in the probate record. However, it is hard to imagine that a 20 percent shift in day wages, even if this mapped over onto the workforce more generally, would have a very large effect on the relative distributions of wealth and capital at death. Moreover, the extent to which these wages mirror incomes in other occupations within each sector is an open question. According to Broadberry et al.’s (Reference Broadberry, Campbell and Klein2015, pp. 365–67) estimates, between 1522 and 1801 productivity growth in industry was about the same as in services and lower than in agriculture. It is only in the nineteenth century that differences in the rates of growth across sectors grew large. We therefore view the weight of evidence as suggesting that wealth and capital bias had a relatively stationary effect over this period.
Adjustments for Biases in Probate Coverage
We now examine how we can use the limited share of deaths generating wills to address the wealth and capital bias of the probate record. This serves as a test of the validity of our indices and produces independent estimates of sectoral shares from the probate record.
For both institutional and economic reasons, the share of deaths that generated a probate record varied over time and between counties (see Figure S1). Partial coverage in the probate records implies that changes in the shares of the deaths that generated wills could significantly affect trends in sectoral shares. If the wealth distribution of testators differed between sectors, then the share we calculate from our sample would vary depending on the share of deaths that generated a probate record. For example, if the probate record contained 5 percent of deaths we would capture many of England’s merchants, who were among the wealthiest individuals outside the aristocracy, but few of its far more numerous farmers, many of whom had relatively modest levels of wealth. However, if 50 percent of deaths appeared in the probate record, we would add a few additional merchants, but very many more farmers.Footnote 11 Our estimates of the size of the agricultural share would be much larger in the second scenario, purely because of the change in the share of deaths that generated a will.
We therefore estimate the effect of changes in these shares econometrically and use the results to examine how the series might look like if all deaths were recorded in probate. This is a strong robustness check for the indices just presented, as it estimates them keeping constant the share of deaths recorded across space and time. However, as with all out of sample predictions, it should be taken as a best guess for the levels.
To estimate how occupational shares respond to changes in coverage we employ the generalised linear model developed by Leslie Papke and Jeffrey Wooldridge (Reference Papke and Wooldridge1996), which is designed to fit proportional data, such as sectoral shares: the predicted values are bounded between 0 and 1 and the effect of a change in the share of deaths with a will decreases as a sectoral share approaches the boundaries. A positive coefficient on the coverage variable indicates that an increase in coverage is expected to increase the sectoral share in question. In other words, a positive coefficient signals that the sector is under-represented in the probate record and a negative one that it is over-represented.
Differences in levels are expected across counties depending on their specialisation. As we saw, Figure 2 revealed differences and non-linearity in the county trends. We therefore include county/sector dummies and county/sector-specific quadratic trends as independent variables, together with the share of deaths recorded. As the marginal effects, by definition, cancel themselves out across sectors, they are constrained to sum to zero, both for the share of the wills and time. These constraints hold exactly at the sample mean of the dependent variable, which by definition is one-third, and approximately for other values (details are in Appendix 2). They ensure that the sum of the fitted values across the three sectors is approximately equal to one for all counties and time. Formally:
 ${\theta _{sit}} = exp (\alpha + {d_{si}} + {\beta _{1si}}t + {\beta _{2si}}{t^2} + {\beta _{3s}}{\delta _{it}})/[1 - exp (\alpha + {d_{si}} + {\beta _{1si}}t + {\beta _{2si}}{t^2} + {\beta _{3s}}{\delta _{it}})] + {u_{sit}},$
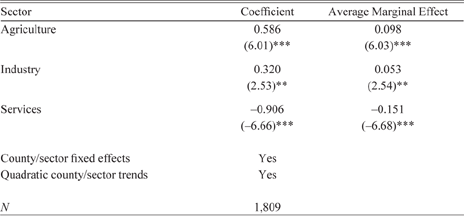
where θsit is the sectoral share from the probate record in sector s (agriculture, industry, and services, respectively), county i and time t, α is a constant, dsi is a county/sector dummy, β1si and β2si are the coefficients of the county/sector quadratic trends, β3s is the main coefficient of interest, and δit is the share of deaths covered by the probate record. We present the results in Table 3.
Shares of Deaths Covered and Sectoral Shares in the Probate Record: Generalised Linear Regression Analysis for Fractional Response Variables

* = Significant at the 1 percent level.
** = Significant at the 5 percent level.
*** = Significant at the 1 percent level.
Note: N=sample size. Clustered standard errors allow for arbitrary correlation within sectors; the z-statistics are in parentheses.
Sources: See Appendix 2 and the text.
The relevant coefficients have the expected signs—agriculture and industry are positive, while services is negative—and are statistically significant at conventional levels.Footnote 12 An increase in the shares of deaths producing a will increases the shares of agricultural workers more than that of industrial workers, at the expense of the share in services. On average, an increase by 1 percentage point in the share of deaths covered within the probate process increases the shares of agriculture and industry by 0.098 percentage points and 0.053 percentage points, respectively, and decreases the share of services by 0.151 percentage points. For example, the results imply that the sectoral estimates for Herefordshire in the 1650s, when just over 10 percent of deaths appear in probate, should be increased by 8.66 percentage points for agriculture if we are seeking to predict the share across the entire male working age population (assuming we knew the occupations of all males). Likewise, the agricultural share for Cambridgeshire in the 1590s where 56 percent of the population is in the probate record would be increased by 4.56 percentage points to be comparable to full coverage.
The baseline specification for the effect of coverage upon occupational shares assumes that the coefficients are stationary. However, as we discussed earlier, if the distribution of wealth and capital significantly changed between (or even within) sectors, the assumption of stationarity is violated, because the probability of an individual appearing in the probate record for each sector and any given level of coverage changes over time. This is a key concern for us. For instance, during the Industrial Revolution one might expect that the likelihood of being probated changed for people working in industry, reflecting growing productivity, increased capital intensity, and rising income inequality in this sector. In consequence, even the adjusted estimates may identify spurious trends. Thus, if wealth was distributed away from agriculture to industry and services, or if agriculture became less capital intensive relative to industry, the probate record would show a fall in the agricultural labor share even if there were none in society at large.
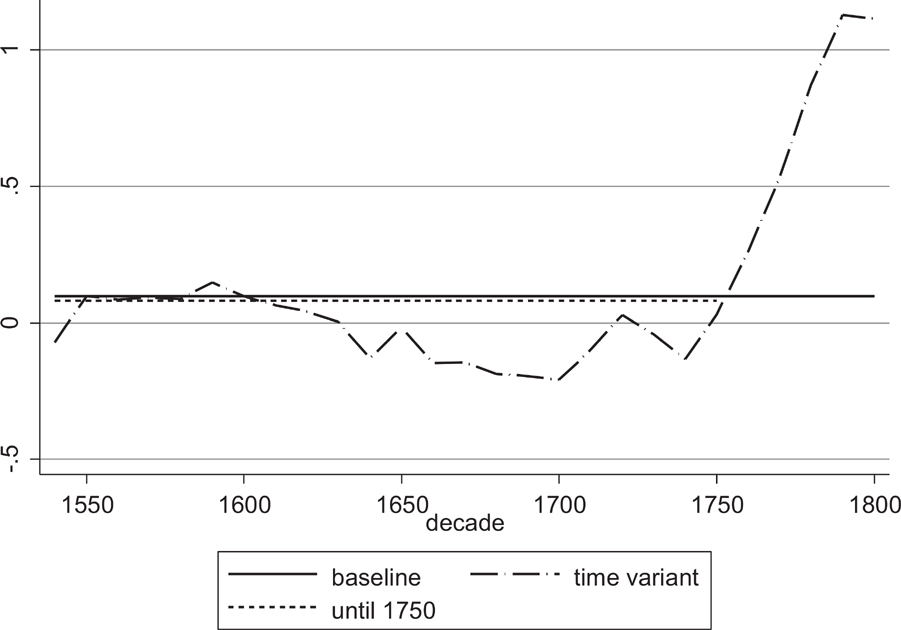
To address this issue we run two alternative specifications. The first specification allows the effect of changes in probate coverage to vary across decades. While this approach directly addresses potential violations of the assumption of stationarity, it has the downside that each coefficient is estimated on the basis of relatively few data points, those forming each cross-section. We therefore also run a regression including only data from records from before the Industrial Revolution (stopping our analysis in 1750) to evaluate the effect of excluding the period where violations of the stationarity assumption may become a larger problem. Figure 4 compares the average marginal effects of the share of deaths covered for each of the three specifications.
Average Marginal Effect of the Share of Deaths Covered on The Agricultural Share (In Percentage Points)

The specification with time-variant coefficients detects an overall stable and low level of responsiveness of the agricultural labor share to changes in coverage until the mid-eighteenth century, confirming our earlier contention that selection in the probate record was broadly stationary before the Industrial Revolution. From the 1760s onwards, we see an upward turn in the time-variant series shown in Figure 4. This rise in the marginal effect of an increase in the share of deaths on the share of the workforce in agriculture indicates that farming became significantly under-represented, to an extent that was increasing at a very rapid pace. The coefficients for the other sectors imply that while the representation of both industry and services increased as a result, the gains were concentrated in services.Footnote 13 This suggests that either it was mainly financial and commercial wealth, rather than industrial capitalists’ that increased in the early decades of the Industrial Revolution, or that factory and other industrial equipment owners were recorded under occupations classified as services rather than industry. The third “until 1750” specification finds that excluding data from the 1760s onwards has no effect on the sign and a very minor effect on the size of the marginal effects compared to the “baseline” specification. We therefore rely on the baseline coefficients to compute the adjusted estimates, understanding that a negative bias in the agricultural labor share is expected from the mid-eighteenth century.Footnote 14
The adjusted sectoral shares are computed with the predicted values under the assumption of universal male coverage for the wills plus the errors. In other words, we let δit be equal to 100 percent in the regression equation for all counties and time periods (cf. equation (1)).Footnote 15 The aggregation across counties follows the same method used for the observed sectoral shares.Footnote 16 Table 4 shows the results. Figure 5 compares them to previous estimates for England. County-level results are reported in Table S3.1.
Sectoral Distribution of the Labor Force, Adjusted Probate Estimates

Note: The figure reports adjusted sectoral trends for England estimated assuming that all male deaths were included in the probate records of the counties in our sample. The unbalanced sample uses all available data. The balanced sample uses a constant sample of counties for which we have data in all decades.
Sources: See Appendix 1 and 2 and the text.
Sectoral Distribution Over Time

As with our baseline results, the unbalanced and the balanced sample agree, both on trends and levels. Clearly the adjusted estimates strongly corroborate the results from the un-adjusted series: the agricultural share went down, while both industry and services went up; the decline of agriculture was slow between the later sixteenth and the early seventeenth centuries and became more rapid from then until the early eighteenth century.
Caution is in order, not least because after 1700, as we said before, it is likely that both our counties and the probate record become less representative of England. Yet, reassuringly, there is a very close match with both the previous point estimates in the literature and our indexed series linked to those estimates. The trend apparent in Figure 5a is in all essential respects the same as that in Figure 3a: our correction for sample bias thus supports our initial description of English structural change. If we look at the estimates of shares employed, we can see that across the three sectors, there is a strikingly close match with Broadberry’s et al.’s estimates. Our estimates of agricultural share in the eighteenth century are only a little above that of Shaw-Taylor et al. Clark, Cummins, and Smith’s agricultural shares are significantly different from ours only at the beginning of the period. In the 1530s, our estimate is closer to Broadberry et al.’s revised estimate from the Muster list. Clark, Cummins, and Smith’s figure for 1560–1579, which is based on un-adjusted probate records at a time when the quality of record-keeping was low, seems to under-estimate the agricultural share. Our estimates for services in the eighteenth century are in line with, albeit somewhat lower than, those of Broadberry et al., and are very close to those of Shaw-Taylor et al.
There is very little difference between the unbalanced and balanced samples in Wales (Figure 5b). As with the unadjusted series, we find much less evidence of structural change there: we detect only a slight fall in the agricultural share between the late seventeenth and early eighteenth centuries. That correcting our estimates for bias leaves the trajectory of Wales unchanged offers further reassurance about the robustness of both national series.
Consistency with Urbanization and Economic Growth
As an additional test of the validity of our results, we compare them with urbanization rates, estimates of demand elasticity, and GDP per capita. Urbanization figures provide a natural benchmark as they are widely used to gauge the size of industry and services in premodern societies, in that they reflect overall agricultural productivity and give some indication of non-farming employment.
The level of urbanization in England grew fairly steadily from 1550 to 1750, increasing from around 5 percent of the population to between 20 to 30 percent, depending on the threshold used to define a city (see Figure S2, comparing urbanization rates with our share of non-agricultural employment).Footnote 17 The trend of continuous growth in urbanization was thus quite similar to the trend we identify in the share of the male labor force in industry and services, and is consistent with the idea that this period witnessed structural transformation. However, the difference in levels is striking: urbanization rates were 20 to 30 percentage points lower than the employment rates we find in services and industry. If we assume that urban residents were not employed in farming, then the gap between the levels implies that in the 1530s about a quarter of the males in the country-side were employed in industry and services; by the 1720s, this had risen to more than 40 percent.Footnote 18 If we take into account female labor shares, then this implies that already in the 1530s more than 35 percent of the rural labor-force was employed outside agriculture.Footnote 19
As noticed by Giovanni Federico (Reference Federico2016, p. 127), England differed sharply from Holland, where in 1514, even after a precocious structural transformation had lifted the share in industry and services to 60 percent, more than 85 percent of labor in the countryside was in agriculture. Elsewhere in Europe, in 1800 between three and four-fifths of rural labor was in farming (Allen Reference Allen2000, p. 7). Rural proto-industry and commercial agriculture appears to have played a peculiarly important role in the development of the pre-modern English economy.
When we consider GDP and demand elasticity, Engel’s law predicts that the primary labor share declines with income per capita. If our figures are correct, then the English agricultural labor share was exceptionally low—just over half the size one would expect given its income.Footnote 20 However, Crafts (Reference Crafts1984) finds that in the nineteenth century, England too was an outlier on this measure: its proportion of primary workers was lower than expected by a similarly large margin, a situation he explains by farming’s high productivity. In fact, even after adjusting for food imports the gap remains large.Footnote 21 The English peculiarity that we observe is thus consistent with an early lead in agricultural productivity. Our figures are also consistent with a progressive increase in the per capita yearly expenditure on primary products, from £ 3.78 in the early sixteenth century to £ 5.37 in the mid-eighteenth century and £ 6.52 in the mid-nineteenth century (at 1700 constant prices). During the same intervals there was a decline in the share of income spent on primary products, from 43 percent to 37 and 25 percent, respectively.Footnote 22 Notably, the shares of income spent on primary products were well below those spent on food. For instance, we estimate that the share of income spent on food in 1850, when the data are comparatively reliable, was 58 percent and we expect the figure to be higher in earlier times.Footnote 23 This suggests that food was often processed (e.g., baked or converted from milk into cheese) and traded over substantial distances in England. This sits well with the idea that early modern England is better described as a proto-industrial and commercialised society, rather than a Malthusian society strongly constrained by an inelastic agricultural production system.
The implied income elasticities of demand are very much in line with other estimates. Clark, Michael Huberman, and Lindert (Reference Clark, Huberman and Lindert1995, p. 216) assume that the income elasticity of demand for food in England during the Industrial Revolution was 0.6; Roderick Floud et al. (Reference Floud, Fogel and Harris2012, p. 105) recommend a downward revision and argue for an income elasticity of demand for calories of 0.26. We find that income elasticity at the mid-point between 1750 and 1850 was 0.34. We also confirm a sharp decline in food demand elasticity with income (Clark, Huberman, and Lindert Reference Clark, Huberman and Lindert1995): between the 1530s and the 1750s, when income was lower, the demand for primary products was still inelastic, but the value of the mid-point elasticity, 0.70, was substantially higher.
As a final cross-check, we utilize Christian Groth and Karl Gunnar Persson’s (Reference Groth and Persson2016) model, which exploits Engel’s law to produce microfounded estimates of macroeconomic series, on the basis of sectoral shares in self-sufficient economies, to construct a GDP per capita indexed series until the 1750s.Footnote 24 We use their baseline assumptions with our adjusted sectoral shares.
Overall, there is a close match between the two series. The correlation coefficient is 91 percent. Both series detect sustained economic growth, particularly marked in the decades around 1650. (Figure S3 compares the results with Broadberry et al.’s (Reference Broadberry, Campbell and Klein2015) output-based GDP per capita series.) This is essentially the same time period over which structural transformation became rapid. It is also the time when Nuno Palma (Reference Palma2016) argues that the economy was becoming increasingly monetized. In line with the available evidence, Groth and Persson’s (Reference Groth and Persson2016) model assumes that there was an increase in the number of days worked in a year from 210 to 293, thanks to an “industrious revolution” (de Vries Reference De Vries2008).Footnote 25 This assumption also underlies Broadberry et al.’s (Reference Broadberry, Campbell and Klein2015) interpretation of what drove English economic growth at the time. However, this growth in days worked is not sufficient to reconcile the figures on growth with those on stagnating real wages. The model endogenously estimates wage trends across sectors thus implicitly relaxing one of the most counter-intuitive aspects of Broadberry et al.’s (Reference Broadberry, Campbell and Klein2015) preferred interpretation: that productivity and income per capita but not wage rates were growing in early modern England. Relaxing this assumption implies casting doubt on the extent to which building and agricultural laborers’ wages were representative of their sectors’ incomes as a whole (Stephenson Reference Stephenson2018). It also implies that economic growth was accompanied by increasing inequality—a claim that is consistent with Broadberry et al.’s position (Reference Broadberry, Campbell and Klein2015, p. 329), as well as Branko Milanovic, Lindert, and Williamson’s (Reference Milanovic, Lindert and Williamson2011) analysis of social tables.
Implications for Productivity
By definition, sectoral labor productivity is equal to the total output in each sector divided by the number of people employed in that sector. It follows that our estimates of sectoral occupational shares can be used to construct new series of sectoral labor productivity when combined with consumption or production data. In relatively closed economies, the simplest measure of agricultural productivity is the number of households each farming household is supporting. On this measure, in the 1530s each agricultural household in England was supporting 1.7 households, rising to 2.3 households by 1700; the figure was 2.4 in the Netherlands, 1.7 in Italy, and 1.6 in France in 1700.Footnote 26 This comparison suggests that the levels of productivity of English agriculture were high but by no means extraordinary.
The number of households supported is, however, a rough measure of agricultural productivity, as it neglects variations in consumption per capita and the important role played by international trade in food in early modern countries such as Poland and the Netherlands. Taking into account the effects of trade and of income differences on the size of demand, agricultural productivity in England was more than one-fifth above the average level in other European countries in the 1530s, rising to more than three-fourths above the European average by the 1750s (illustrated in Figure S4).
In other words, our figures imply that English agricultural productivity took a lead in Europe at an earlier date than detected by Allen (Reference Allen2000). Comparatively high productivity in agriculture from an early stage is consistent with the medieval commercialization and improvement in this sector (Britnell Reference Britnell1997; Campbell Reference Campbell2006), as well as the precocious integration of the English wheat market (Chilosi et al. Reference Chilosi, Murphy and Studer2013; Clark Reference Clark2015).
Perhaps the most significant implication of our estimates is that they show that industry was much more central to the economy’s take-off from the mid-seventeenth century than argued by Broadberry et al. (Reference Broadberry, Campbell and Klein2015, pp. 364–69). Combining Broadberry et al.’s data on population and sectoral output and our adjusted series of sectoral shares, Figure 6 maps out the development of productivity in agriculture, industry, and services at ten-year intervals.Footnote 27
Indexed Trends in Output per Worker in England (1700–09=100)
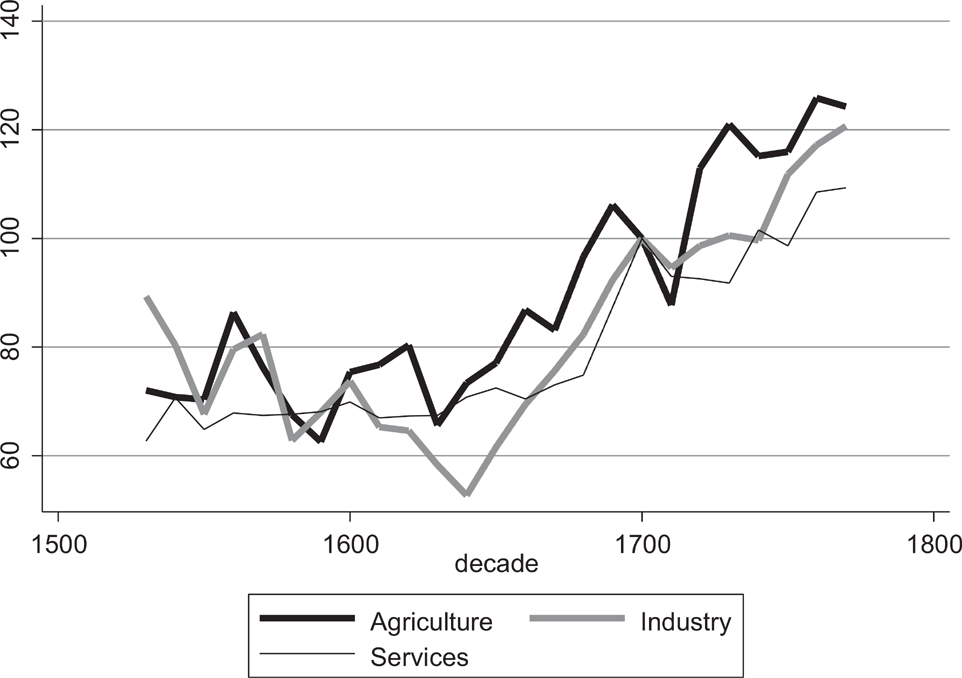
Figure 6 shows that all three sectors experienced rapid rises in labor productivity between the 1630s and the beginning of the eighteenth century. In other words, agriculture, industry, and services all contributed to bringing about sustained economic growth in England, for the first time since the aftermath of the Black Death (Broadberry et al. Reference Broadberry, Campbell and Klein2015, p. 208). By the early eighteenth century, however, diminishing returns set in and productivity growth slowed down across the three sectors. Not until the first half of the nineteenth century did the English economy again see rates of productivity growth as fast as those of the 1630s–1700s (Broadberry et al. Reference Broadberry, Campbell and Klein2015, p. 367).
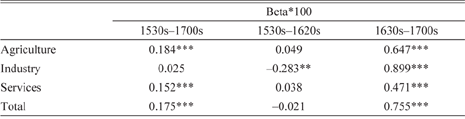
The shift in the pace and direction of change that occurred around 1630 mean that it makes sense to break the 1522–1700 period, that Broadberry et al. were forced to treat as a single unit because of the dearth of sectoral estimates, into two parts: one part covers the period before 1630, the other runs from then until the first decade of the eighteenth century. Table 5 reports the yearly rates of growth in labor productivity in these two periods.
Yearly Rates of Growth in Labor Productivity in England (In Percentages)

* = Significant at the 1 percent level.
** = Significant at the 5 percent level.
*** = Significant at the 1 percent level.
Note: Beta is the yearly rate of growth and is derived by regressing the natural logarithm of the productivity index against time.
Sources: See Appendices 1 and 2 and the text.
Our overall labor productivity estimates for 1530–1700 are essentially the same as those given by Broadberry et al., as they should be, given that we use their output estimates and largely agree on sectoral shares at the start and end of this period. Like them, we find that between the 1530s and the 1700s labor productivity growth was fastest in agriculture. However, when we look at the period after 1630, then we find that the rate of productivity growth in industry between the 1630s and the 1700s was significantly higher than in any other sector. Indeed, a rate of 0.90 was about as large as that seen during the Industrial Revolution: between 1759 and 1851 the corresponding figure was 0.93 (Broadberry et al. Reference Broadberry, Campbell and Klein2015, p. 367). This parallel is missed in Broadberry et al.’s longer periodization (1522–1700), which obscures a period of particularly poor performance for industry in the decades before the 1630s. These decades saw long bouts of depression for textile exports, as old trade routes in the North Sea closed and new ones in the Mediterranean Sea only slowly opened up, leading to waves of crises in industrial districts (Fisher Reference Fisher1940; Supple Reference Supple1959; Lowe Reference Lowe1972; Munro Reference Munro2007). While not denying the impressive gains made in agricultural productivity at the same time, our results suggest that so many Englishmen were willing to move into industry after 1630 because incomes in that sector were rising very rapidly.
Conclusion
In this article we have presented new estimates for the share of the male workforce in agriculture, industry, and services in England and Wales from the 1530s to the 1780s based on probate records and apprenticeships. Both series show substantial declines in the share of the workforce in agriculture in England during the seventeenth century. Our econometric estimates indicate that the changing share of the population captured in the probate series is not driving our results: the results are very close to those we generate with our baseline index linked to independent estimates. Moreover, our results are consistent with existing point estimates of sectoral distribution, trends in urbanization, and recent GDP estimates. They are internally consistent, mutually coherent, and can be successfully triangulated against other indicators. Broadberry et al. recently observed that “the critical occupational migration from agriculture to industry commenced sometime after 1522” (Broadberry et al. Reference Broadberry, Campbell and Klein2015, p. 369). Our estimates locate the start of this shift in the first half of the seventeenth century.
We argue that it is unlikely we are mistaken in identifying a substantial decline in the share in agriculture in the seventeenth century. Our data contains around 30 to 40 percent of deceased adult males in the seventeenth century. If the overall share of male workers in agriculture was to remain stable, as Clark, Cummins, and Smith (Reference Clark, Cummins and Smith2012) argued, then the share in agriculture among the poorer, less capital-rich section of society whom we do not observe in the probate or apprenticeship records would have to increase substantially. Assuming that the same share of the observed and the unobserved were in agriculture in 1600, then the share of the unobserved employed in agriculture would have to rise by 20 percent from 0.63 to 0.75 to keep the overall share in agriculture stable in 1700. At the same time, the “agricultural revolution” was transforming the rural economy of England, as capitalist relations of production and exchange asserted themselves. Moreover, the available evidence points to a gradual movement away from agriculture in continental Europe too, during the early modern era. A dramatic shift into agriculture on the part of the unobserved section of the English labor force is therefore implausible.
Nonetheless, given the underlying issues with our data, it is useful to discuss the main implications of the article in order of their reliability. First, given that we utilize a much expanded collection of the same data examined by Clark, Cummins, and Smith (Reference Clark, Cummins and Smith2012), we are confident that their argument that the share of England’s workforce employed in agriculture remained largely stable during the sixteenth and seventeenth centuries was mistaken. Second, both our series show that a major decline in the agricultural share of the male workforce began soon after 1600 and quickened around the middle of the century. Taken purely as proxies for occupational trends, they provide strong evidence for the timing of this inflection point in English structural change. Third, our adjusted probate estimates (Table 4) offer a new set of independent estimates for occupational shares that indicate a decline in the share of the male workforce in agriculture in England from around 68 percent in 1600, to around 48 percent in the early eighteenth century. People left farming in most parts of England, both in the North and South, but not all went to cities. The share of the workforce employed in industry and services increased substantially in both rural and urban areas. Most of England’s transition out of agriculture was complete by the end of the seventeenth century.
During the English economic take-off of the mid-seventeenth century, productivity was rising in all sectors, but industry was the sector with the fastest growth. Indeed, its pace of change was as high as during the Industrial Revolution. Our figures also suggest that growth in the seventeenth century was built upon earlier developments: England had inherited a particularly commercialized and productive agriculture, as well as a developed rural proto-industry, from the middle ages.
Needless to say, our results fit poorly with the argument that England was in some ways stuck in a stagnant, barely changing equilibrium. However, our account of Wales is perhaps not too far from that image. Certainly, there is little sign that Wales experienced a transformation of the kind apparent in England, implying that British economic development was accompanied by divergence across the island.
Appendix 1: The Probate and Apprenticeship Datasets
To construct our probate dataset, we utilized a range of published and digital data. We include data from a county if we can meet three criteria. First, we possess probate records for more than 75 percent of the county’s geographical area for each of the three levels of probate jurisdiction (archdeaconry or equivalent, consistory, and prerogative court) that could receive wills. Second, wills survive for more than 10 percent of male deaths; Figure S1 reports the share of deaths generating a probate record by county over time. Third, an occupation is reported for more than 10 percent of male probate records; we identify gender based on status indicators (e.g., widow) and forenames.Footnote 28 These criteria excluded many printed probate records where the authors of printed indexes omitted occupations. Finally, we excluded observations for records reporting titles not occupations (e.g., “gentleman”). We coded occupations using Wrigley’s (Reference Wrigley2004) Primary Secondary Tertiary (PST) system. We allocate individuals to agriculture if their occupation is coded as farming or fishing in PST; to industry if they were in secondary sector occupations (plus mining); and to services if they followed any of PST’s retailing, distribution, and service occupations. This distribution matches that of Broadberry et al. and Shaw-Taylor et al., but differs slightly (and unimportantly) from that used by Clark, Cummins, and Smith.Footnote 29 Like Broadberry et al. and Shaw-Taylor et al., we allocate laborers to agriculture if they are located outside towns, as defined by Langton’s (Reference Langton2000) list.Footnote 30 In our core sample, we are able to code 98.9 percent of occupational labels.
The apprentices’ fathers’ dataset is based on a large sample of London guild records. The majority of the dataset was originally extracted by Cliff Webb and is described in Leunig, Minns, and Wallis (Reference Leunig, Minns and Wallis2011). Additional material for the Merchant Taylors has been supplied by Michael Scott. Material for several other guilds is taken from the Records of London Livery Companies Online database (www.rollco.org), which has been kindly supplied by the Centre for Metropolitan History. We include data for counties in decades when they supplied an average of more than ten apprentices each year for whom we are able to code their father’s occupation as within agriculture, industry, or services, using the method noted previously, giving us a minimum of 100 observations per county per decade. Some counties, all those in Wales, Cornwall, and the far north, such as Durham, are usually excluded as a result. We exclude the period after 1759, as there are fewer than ten counties meeting this criteria after that point.
Probate Sources:

Appendix 2: The Regression
Under the baseline specification:
 ${\theta _{sit}} = exp (\alpha + {d_{si}} + {\beta _{1si}}t + {\beta _{2si}}{t^2} + {\beta _{3s}}{\delta _{it}})/[1 + exp (\alpha + {d_{si}} + {\beta _{1si}}t + {\beta _{2si}}{t^2} + {\beta _{3s}}{\delta _{it}})] + {u_{sit}},$
where θsit is the sectoral share from the probate record in sector s (agriculture, industry, and services, respectively), county i and time t, α is a constant, dsi is a county/sector dummy, β1si and β2si are the coefficients of the county/sector quadratic trends, β3s is the main coefficient of interest, and δit is the share of deaths covered by the probate record. The derivative with respect to each variable is equal to its coefficient times exp(z)/[1 + exp(z)]2, where exp(z)/[1 + exp(z)] is the fitted value. At the sample mean of the dependent variable, which by definition is equal to one-third, exp(z)/[1 + exp(z)]2 =0.222 for all sectors. Therefore at this value the condition that the marginal effects of time and share of deaths covered cancel themselves out across sectors simplify into:
 ${\beta _{13i}} = - {\beta _{11i}} - 2{\beta _{21i}}t - {\beta _{12i}} - 2{\beta _{22i}}t - 2{\beta _{23i}}t,$
and:
 ${\beta _{33}} = - {\beta _{31}} - {\beta _{32}}.$
Substituting these conditions into equation (A1) for s = 3 and re-arranging yields:
 ${\theta _{sit}} = exp [\alpha + {d_{3i}} + {\beta _{11i}}( - t) + {\beta _{12i}}( - t) + {\beta _{21i}}( - 2{t^2}) + {\beta _{22i}}( - 2{t^2}) - {\beta _{23i}}( - 2{t^2}) + {\beta _{3l}}( - {\delta _{it}}) + {\beta _{32}}( - {\delta _{it}})]/\{ 1 + exp [\alpha + {d_{3i}} + {\beta _{11i}}( - t) + {\beta _{12i}}( - t) + {\beta _{21i}}( - 2{t^2}) + {\beta _{22i}}( - 2{t^2}) - {\beta _{23i}}( - 2{t^2}) + {\beta _{3l}}( - {\delta _{it}}) + {\beta _{32}}( - {\delta _{it}})]\} + {u_{sit}}.$
The results are reported in Table S2.2 in Online Appendix 2.