Introduction
Many parts of the Mediterranean karst surfaces have been directly modified to enhance their agricultural potential. In the last two decades, more than 5000 ha of karst stony terraces and steep slopes have been remediated by stone crushing to create a larger and flatter area for cultivation and to make the land suitable for agricultural production, mostly for grapevine and olive production. The karst areas along the Croatian coast benefit from warm to hot, dry summers, and frequent winds of the Mediterranean climate conditions that favour organic vineyard management. Karst landscapes are highly fragile and vulnerable to anthropogenic as well as climatic stresses. In stony and gravelly soils rain water percolates rapidly downward through the soil layers. Moreover, excessively dry topsoils can cause water run-off and significant evaporative loss of water. Thus, the lack of moisture can be an important risk indicator in vine production within these areas. The rational use of water for irrigation plays an important role in managing vineyard within karst landscapes. Vine water status can be assessed through soil water measurements and the use of physiological indicators. However, water measurements in skeletal karst soils are especially challenging because: 1) the very coarse nature can pose soil contact problems for some of the available soil moisture monitoring devices (Al-Yahyai et al., Reference Al-Yahyai, Schaffer, Davies and Muñoz-Carpena2006); and 2) soils made by rock-ploughing show great within-field variability (e.g., the proportion of gravel can range from 40 to >70%) and a significantly larger number of more probes is required for accurate assessment of soil-water content. Under such conditions, irrigation scheduling should be mainly based on the crop water status. Current standard procedures include measurements of individual plants, leading to extensive and time consuming field work, which is subject to measurement and sampling errors (Rodríguez-Pérez et al., Reference Rodriguez-Perez, Riano, Carlisle, Ustin and Smart2007). Remote sensing applications allow for a reliable and quick non-destructive assessment of water status in plants (Li et al., Reference Li, Ustin and Lay2005) on different spatial scales (e.g., laboratory/greenhouse, field). However, remote sensing has limitations due to low resolutions for precision viticulture (Matese and Gennaro, 2015). Hyperspectral imaging combines the benefits of imaging and spectroscopy techniques (Mahesh et al., Reference Mahesh, Manickavasagan, Jayas, Paliwal and White2008). Such imaging collects both spatial and spectral data, and combines them in a 3D hypercube. The spectral signature obtained in this way is based on the physical and chemical properties of the material examined, and is therefore unique (Ravikanth et al., Reference Ravikanth, Singh, Jayas and White2015). It can provide significant improvements in assessing vineyard biophysical and quality parameters (Zarco-Tejada et al., Reference Zarco-Tejada, Berjon, Lopez-Lozano, Miller, Martın, Cachorro, Gonzalez and de Frutos2005; Diago et al., Reference Diago, Pou, Millan, Tardaguila, Fernandes and Melo-Pinto2014).
This research was carried out in a Babic (Croatian autochthonous cultivar) vineyard organically managed and grown on artificially created soils with at least 80% of gravel (>25 mm) and high variability in soil available water. Within this paper we evaluated applicability of hyperspectral imagery to detect water status under non-irrigated and irrigated conditions using reflectance measurements.
Materials and methods
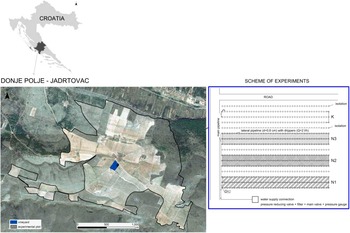
The study was conducted in the summer of 2016 in a seven-year-old organically managed vineyard located in Šibensko-kninska county in the wine producing region of Croatia with Mediterranean climate (Figure 1). Babic cv. (Vitis vinifera L.) vines were grafted on Richter 110 rootstock and trained to a vertically shoot-positioned trellis system. A meteorological station (Complete Weather Station – DACOM, Netherlands) was installed on the experimental plot to measure precipitation, temperature, relative air moisture, wind speed and direction, solar radiation and leaf moisture. The station had an additional application for evapotranspiration calculations.
Aerial photograph of the study area and maps of the vineyard plot with their respective treatments

Four irrigation treatments were established in the vineyard: 1) N0- no irrigation; 2) N50 – irrigation with 50% of ETc; 3) irrigation with 75% of ETc; and 4) N100 where the amount of added water was equal to total crop evapotranspiration losses. Each treatment contained 3 lines of grapevines. For spectral analyses we randomly selected 5 plants from each line. Thus, each treatment consisted of 15 plants for a total of 60 plants.
Hyperspectral images of grapevines were captured using two cameras, Hyspex SWIR-384 and VNIR-1600 (Norsk Elektro Optikk, Norway). The cameras were mounted on a tripod with a rotation stage, and moved around the vineyard with a tractor. The spectral range of the cameras was 409–988 nm (VNIR) and 950–2509 nm (SWIR), with spectral bandwidths of 3.6–5.4 nm, giving a total of 448 spectral bands. Images were acquired in the morning, within a time span of 2 hours, in order to minimize light-source temperature drift and stabilize spatial lighting uniformity (Piqueras et al., Reference Piqueras, Burger, Tauler and de Juan2012). A grey diffuse reflectance standard Zenith LiteTM of 20% reflectance was used as a reference. The hyperspectral images were calibrated to radiance units (W sr−1m−2). Spectral signatures of each plant were separated and extracted using ENVI 5.1 (Exelis Visual Information Solutions, Inc., USA). These plant-specific radiance values were further normalized and converted to net reflectance using the following equation:
 $$R_{i} {\equals}{{R_{{roi}} {\minus}R_{d} } \over {R_{{std}} {\minus}R_{d} }}{\asterisk}0.2$$
where Ri is normalized reflectance for i-th plant (%), Rroi is radiance value of i-th plant (W st−1m−2), Rstd is radiance value of grey reference, and Rd is dark current of the sensor. Median spectral signatures of each plant were obtained from these normalized values. These pre-processing steps were performed in R (R Core Team, 2014).
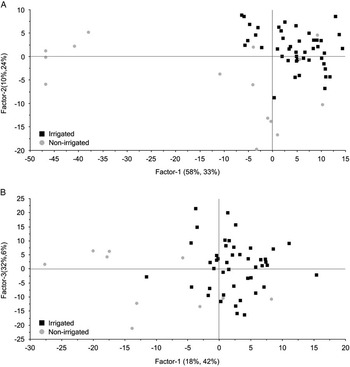
Reflectance data were transformed using a 2nd order Savitzky-Golay derivative with a 2nd order polynomial with a window width of 7 points. The data transformed in this way were then analyzed using Partial Least Squares Discriminant Analysis (PLS-DA) and SVM. Both PLS-DA and SVM models were validated using cross-validation, with a leave-one-out approach. These preprocessing steps, and PLS-DA and SVM, were performed in Unscrambler 10.3 (CAMO Software, Norway). A preliminary PLS-DA showed the presence of outliers belonging to Line 1 of the N0 treatment. Since all five plants were outliers, forming their own cluster, they were excluded from further analysis (Figure 2A).
PLS-DA score plot of watered (N50, N75 and N100) and drought (N0) treatments. A - All five boxes on the far left belong to Line 1 of treatment N0 and were identified as outliers. B – Final score plot of watered-drought treatments. The numbers in parentheses next to axis labels denote how much variability of the spectra (first number) and treatments (second number) is explained by the factor

Results and discussion
PLS-DA successfully distinguished between irrigated and drought treatments, with an accuracy of 0.77 and an RMSECV of 0.2 (Figure 2B). Correlation loadings showed ten hyperspectral bands in the visible range to be important for the PLS projection, ranging from 458 to 733 nm. Five more peaks in the SWIR region were also important, ranging from 1464 to 1678 nm.
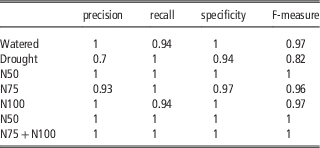
SVM classification was more successful than PLS-DA, with 87% classification accuracy. Identification of watered plants was most reliable, with an F-measure value of 0.97, while for drought plants it was 0.82 (Table 1). The three misclassified plants belong to the same line in the vineyard - treatment N0 Line 2. In gravel-rich soils, physical (texture) parameters and hydraulic characteristics that affect plant water status may be very variable even between closely spaced points. Therefore, considerable variability can occur in infiltration and evaporation rates, capillary movement and the amount of plant-available water in soil as well as in their impact on vine physiology.
Accuracy measures of SVM classifications

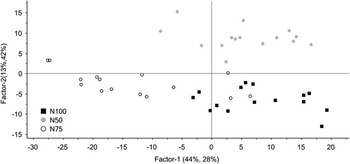
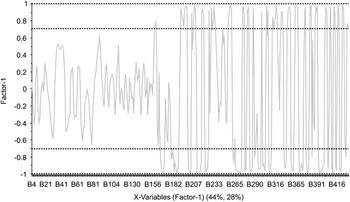
Among the watered treatments, PLS-DA achieved the highest success of 0.92 (RMSECV 0.13) with N50 treatment, while N75 and N100 treatments had acceptable success rates of 0.66 (RMSECV 0.28) and 0.69 (RMSECV 0.27), respectively. These results are showcased by the score plot in Figure 3, with overlapping groupings created by treatments N75 and N100. Wavelengths ranging from 990 to 2500 nm were identified as important for this classification (Figure 4).
PLS-DA score plot of watered treatments N50, N75, and N100

PLS-DA correlation loadings plot of Factor 1 for differentiating treatment groups N50, N57, and N100. The area between the dotted lines denotes upper and lower bounds of significance

Classification success with SVM was higher, at 93.3%. All samples from treatments N50 and N100 were classified correctly, and one from N75 was misclassified into N100. F-measure values were 1, 0.96, and 0.97 for treatments N50, N75, and N100, respectively (Table 1).
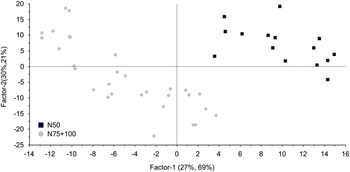
Combining treatment groups N75 and N100 into a new group and analyzing the differences relative to group N50 yielded near perfect success rates with both PLS-DA and SVM. Partial least squares achieved a success rate of 0.97 (RMSECV 0.08), and SVM had a 100% classification success (Figure 5, Table 1).
PLS-DA scores of treatments N50 and N75+N100

The results show the capability of hyperspectral imaging, combined with PLS-DA and SVM, to successfully discriminate between irrigated and drought stricken plants, and to determine the severity of drought stress. For discriminating between irrigated plants and those in drought the visible part of the spectrum was most important. A darker green colour is an apparent feature of water stress due to the difference in chlorophyll reflection, where greener (i.e., darker) leaves demonstrate a lower level of reflection (Kim et al., Reference Kim, Zhang, Zhou, Du, Wu, Mockler and Berezin2015). Genc et al. (Reference Genc, Inalpulat, Kizil, Mirik, Smith and Mendes2013) argue that the concentration of chloroplasts in stressed plants increases relative to unstressed plants. On the other hand, the chlorophyll content decreases in stressed plants (Govender et al., Reference Govender, Dye, Weiersbye, Witkowski and Ahmed2009). Further modifications include leaf pigment composition and concentration, cell structure by changing properties of connections between air spaces and cell walls, and cell size and shape (Elsayed et al., Reference Elsayed, Mistele and Schmidhalter2011).
On the other hand, when discriminating the severity of drought stress, the visible part of the spectrum had no significant influence on PLS factors. Water is strongly absorbed in the SWIR spectrum, and spectral signatures are therefore expected to correlate with drought stress (Hunt et al., Reference Hunt, Rock and Nobel1987). In our study, the SWIR region between 1460 and 1700 nm was significant with PLS factors for discriminating irrigated and drought plants. With drought severity a larger portion of the SWIR spectrum, ranging from 990 to 2500 nm was significant. These findings correspond to literature data, where water-related bands at 975, 1200, 1470, 1930, and 2500 nm were identified (Cao et al., Reference Cao, Zhegalova, Wang, Akers and Berezin2013; Clevers et al., Reference Clevers, Kooistra and Schaepman2010).
Conclusions
Within this initial research hyperspectral images were collected only once on the randomly selected vines, during the vine veraison which is not sufficiently for suitability evaluation of hyperspectral use in vine water status assessment during the growing season and the water status spatial variability within the vineyard. However, the wavelength ranges identified in this study showed significant difference between irrigated and non-irrigated vines and that represents cost efficient and fast determination of drought stress in grapevines grown on skeletal karst soils. Due to extremely heterogeneous artificially created karst soil, it will be probably needed to include, besides hyperspectral, some other sensors to monitor vine water status for the purpose of precise vineyard irrigation, what will be the following step in this research.
Acknowledgments
This work was supported by the Croatian Science Foundation (HrZZ) project ‘SENSIRRIKA’.