I. INTRODUCTION
Magnetic metal fibers have recently attracted wide attention because of their important application as materials for electromagnetic shielding, absorption, magnetic recording, and medical and biological engineering.Reference Tong, Guan, Xiao, Mou, Wang and Yan1 Polycrystalline Fe fibers are recognized as potential microwave-absorbing materials, owing to their low density, shape and magnetocrystalline anisotropy, and various losses. Such characteristics enable Fe fibers to achieve broad bandwidths and strong absorption, and avoid the high-density defects of metal powders and ferrites.Reference Tong, Wu, Hua, Qiao, Yuan and Qian2, Reference Tong, Yuan, Ma, Guan, Wu, Li and Qiao3
Electromagnetic parameters are key factors that determine the absorption properties of Fe fibers. To this end, some methods have been utilized to modulate Fe fibers, including changing their volume fractions,Reference Wu, He, Zhao and Yao4 controlling their diameters and aspect ratios,Reference Wu, Zhao, He and Yao5 modifying their surface characteristics,Reference Nie, He, Zhao, Gong and Yu6 alloying,Reference Li, Gong, Nie, Zhao and He7 and mixing techniques.Reference Tong, Guan, Fan, Wang and Li8, Reference Tong, Guan, Zhang, Zhang and Dong9
However, there remain practical difficulties in the large-scale enhancement of the electromagnetic parameters of microwave-absorbing materials, one of which is permeability. The diameters and aspect ratios of Fe fibers were theoretically confirmed to be crucial for modulating the electromagnetic parameters of Fe fibers,Reference Zhang and He10, Reference Chen, Zhao and Gao11 but the experimental analysis of such characteristics has focused chiefly on Fe microfibers, and only a few studies have described Fe nanofibers.Reference Tong, Guan, Fan, Wang and Li8, Reference Tong, Guan, Zhang, Zhang and Dong9
In this study, we report a solution-phase chemical reduction route for the one-step synthesis of Fe nanofibers with aspect ratios and diameters that may be adjusted by controlling the concentration of Fe2+. Compared with the electrodeposition,Reference Guo, Qin, Ding and Li12, Reference Pierce, Plummer and Shen13 chemical vapor depositionReference Raposo, Garcia, Gonzalez and Vazquez14–Reference Hofmeister, Huisken, Kohn, Alexandrescu, Cojocaru, Crunteanu, Morjan and Diamandescu19 and template methods,Reference Kida, Kajiyama, Heike, Hashizume and Koike20 the outstanding features of this work are its simplicity, convenience, and effectiveness. In particular, the solution-phase approach can provide a promising technique for mass production. Relations between structures (e.g., diameter and aspect ratio) and properties (e.g., static magnetic, electromagnetic, and microwave absorbing properties) were established, and the mechanism was elucidated in detail.
II. EXPERIMENTAL
A. Preparation of Fe nanofibers
Iron (II) sulfate heptahydrate (FeSO4·6H2O, AR grade) and sodium borohydride (NaBH4, AR grade) were obtained from Shanghai Chemical Reagents Company and were used without further purification. Deionized water (10 MΩ·cm) was used in the reactions and for cleaning the glassware.
In a typical procedure, 100 mL of 1.20 M NaBH4 solution was added drop by drop to a reaction flask with 200.0 mL of 0.010 M FeSO4 and magnetically stirred at room temperature and ~1200 rpm for 30 min. A black precipitate was magnetically collected and sequentially washed with distilled water and ethanol. The as-synthesized products were finally obtained upon drying the precipitates under vacuum at 40 °C for 24 h. The structure of the products was modulated by changing Fe2+ concentration (α) (e.g., 0.0020, 0.010, 0.050, and 0.20 M).
B. Characterization of samples
Transmission electron microscopy (TEM) images and the corresponding selected-area electron diffraction (SAED) pattern were obtained with a JEM-100CXΠ instrument at an acceleration voltage of 150 kV. The phase purity of the samples was examined by x-ray diffraction (XRD) using a D/MAX-RB diffractometer with Cu Kα radiation (λ = 1.5406 Å). The diameter, aspect ratio, and morphology of Fe nanofibers were determined under a field-emission scanning electron microscope (FE-SEM, S-4800; Hitachi, Tokyo, Japan) operated at an acceleration voltage of 5.0 kV. The Brunauer–Emmett–Teller (BET) specific surface area (S BET) was measured using an ASAP 2020 micromeritics analyzer. The nitrogen adsorption and desorption isotherms were measured at 77 K after the sample were outgassed in a vacuum at 150 °C for 5 h.
C. Measurement of properties
The static magnetic properties were measured at room temperature using a vibrating-sample magnetometer (4HF; ADE, Chicago, IL). The cylindrical toroidal samples with an inner diameter of 3.0 mm, outer diameter of 7.0 mm, and thickness of about 3.5 mm were fabricated by homogeneously mixing wax with samples in a mass ratio of 1:1 and then pressing the mixture into cylindrical compacts. The relative complex permeability and permittivity of the samples were measured with a vector network analyzer (N5230; Agilent, Santa Clara, CA).
III. RESULTS AND DISCUSSION
A. Microstructure characterizations
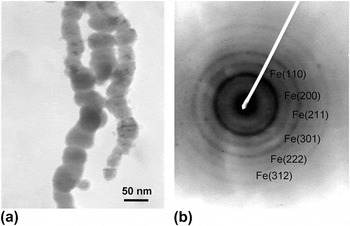
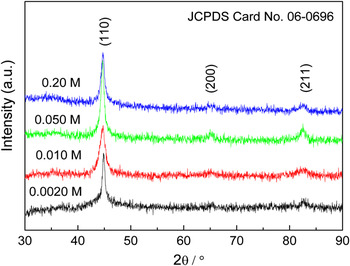
TEM image in Fig. 1(a) revealed that the products were typically ball-chain-structured Fe nanofibers with diameters of ~60 nm. Weak and diffuse rings in the SAED pattern [Fig. 1(b)] further suggest that the Fe nanofibers are polycrystalline. The resulting products were confirmed by XRD (Fig. 2) to be polycrystalline α-Fe nanofibers with ball-chain structures.
(a) Transmission electron microscopic image and (b) the corresponding selected-area electron diffraction pattern of the Fe nanofibers.

X-ray diffraction patterns of the products obtained at various Fe2+ concentrations (α).

B. Phase structure and BET analysis
Figure 2 presents the XRD patterns of the resultant materials obtained from various Fe2+ concentrations (α). Three diffraction peaks in the range of 30° < 2θ < 90° were assigned to the (110), (200), and (211) planes of body-centered cubic (bcc) α-Fe (JCPDS Card No. 06-0696). As the α increased, all peaks first displayed line broadening and then line sharpening. This implied the variation of the crystal size and internal strain with α. Detailed data of the mean crystallite size (δ) and internal strain (ε) of the Fe nanoparticles were calculated using the Hall–Williamson equation and are summarized in Table I.
The average crystal size (δ), internal strain (ε), specific surface area (S BET), saturation magnetization (M s), coercivity (H c), and absorbing bandwidth (W B) of Fe nanofibers produced at various Fe2+ concentrations (α).

The δ values showed a U-shaped variation trend and reached a minimum at α = 0.010 M, whereas the ε values varied in an upward concave shape. In fact, changing the α provided different driving forces for the nucleation and growth of Fe nuclei. At α ≤ 0.010 M, the increasing concentration was helpful in enhancing the nucleation rate, resulting in reduced crystal size and increased internal strain. In contrast, at α > 0.010 M, increasing concentrations of Fe2+ was actually conducive to the enhancement of the growth rate, causing increased crystal size and reduced internal strain. Thus, the structure of the prepared Fe products can be tailored by changing α.
Physical adsorption/desorption isotherms were constructed to determine the S BET of the prepared products. As shown in Table I, the Fe samples presented relatively high S BET values, which increased from 29.65 to 51.75 m2·g−1 as α was decreased from 0.20 to 0.0010 M.
C. Morphological observations
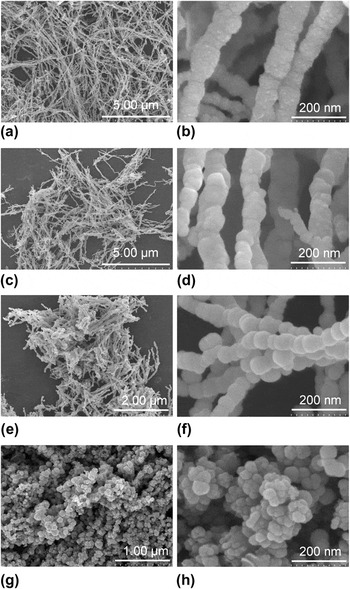
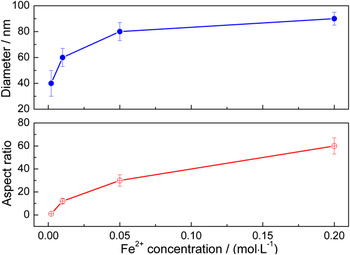
Figure 3 shows the influence of α on the diameter and the aspect ratio of the Fe samples. The samples produced at α = 0.010–0.20 mol·dm−3 were ball-chain-structured Fe nanofibers [Figs. 3(a)–3(f)]. Moreover, the increasing α caused the aspect ratio and diameter of the nanofibers to decrease from 10 to 65 nm and from 55 to 95 nm, respectively. Further decreases in α to 0.002 mol·dm−3 yielded only Fe nanoparticles with 30−55 nm diameters [Figs. 3(g) and 3(h)]. The detailed values of such parameters are plotted in Fig. 4, which shows that the diameter and the aspect ratio of the Fe samples first increased sharply and then increased slowly as α increased.
scanning electron microscopic images of ball-chain-structured Fe nanofibers with different aspect ratios after solution-phase reduction at 20 °C in various Fe2+ concentrations (α) of: (a, b) 0.2 mol·dm−3, (c, d) 0.050 mol·dm−3, (e, f) 0.010 mol·dm−3, and (g, h) 0.0020 mol·dm−3.

Diameter (D) and aspect ratio (λ) of the products obtained at various Fe2+ concentrations (α).

In general, the physical and chemical properties of one-dimensional (1D) nanostructures highly depend on their diameter and aspect ratio, and several methods have been used to modulate such structural parameters. For example, in Gudiksen’s experiment,Reference Gudiksen, Wang and Lieber21 the reaction time was used to control the diameter and length of nanofibers. Li et al.Reference Li, Gong, Nie, Zhao and He7 adjusted the aspect ratio of magnetic fibers by changing their magnetic field. JanaReference Jana, Gearheart and Murphy22 prepared silver nanorods using a seeding growth approach in the presence of an aqueous miceller template. The aspect ratio of the nanorods was tuned by varying the ratio of seed to metal salt. In this study, α was selected as the controlling factor. This is because α provides various driving forces for the nucleation and growth of Fe nanocrystals, which directly determine the density distribution of the crystal nucleus and/or nanoparticles in the solution. Higher nucleus and/or nanoparticle densities create stronger magnetic interactions. Hence, at high α, neighboring nuclei are apt to assemble into bigger Fe nanospheres, which subsequently join end-to-end via magnetic forces and form ball-chain structures with large aspect ratios. This demonstrates that Fe nanofibers with high aspect ratios and larger diameters are easier to obtain at high concentrations.
D. Static magnetic properties
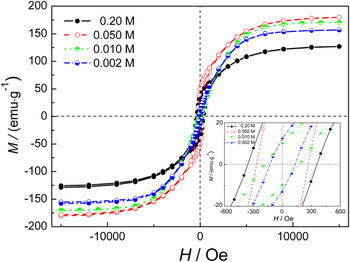
The magnetic properties of all the samples formed at different α were measured, as shown in Fig. 5 and Table I. All the samples were ferromagnetic and exhibited saturation below a magnetic field of 7.5 kOe. As shown in Table I, the U-shape of the saturation magnetization M s reached a maximum of 180.0 emu·g−1 at α = 0.050 M, whereas the coercivity (H c) gradually increased with increasing α.
Magnetic hysteresis loops of the samples obtained at different Fe2+ concentrations (α).

In general, the main factors that affect the magnetization of a 1D structure include shape anisotropy, magnetocrystalline anisotropy, and static magnetic coupling. Polycrystalline nanomaterials usually have no magnetocrystalline anisotropy, and their easy axis is determined by the competition between the shape anisotropy and dipole interactions. The direction of easy magnetization is parallel to the long axis of the nanofibers for shape anisotropy and perpendicular to their long axis for static magnetic coupling between nanofibers.Reference Wang, Pan, Zhou, Wang, Peng and Zhou23, Reference Aral, Kang, Ishiyama, Kamigaki, Tokunaga, Yanagita, Tonegawa and Hayasaka24 For small-sized nanowires, the decisive factor is shape anisotropy.
As seen from the following equation,Reference Tong25

where the intrinsic saturation magnetization 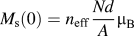 , a = 1 for a BCC crystal, T c is the Curie temperature, and T is the working temperature, the saturation magnetization (M s) depends on the number of magnetic atoms N, density d, relative atomic mass A, Bohr magneton μ B, the effective Bohr magneton number n eff (for Fe, it is 2.16 T), the atomic magnetic moment, and the temperature. The intrinsic saturation magnetization of bulk materials is usually considered to be a certain value.
In this study, the change in M s can be interpreted in two ways: The first involves nanoeffects, which give rise to variations of some physical parameters (e.g., decreased density, decrease in effective Bohr magneton number n eff, and decreased Curie temperature). For example, Fe nanoparticles and nanofibers possess lower M s than Fe microspheres due to the reduced atomic density of the former in the grain-boundary region.Reference Tong, Wu, Qiao, Yuan, Guan and Qian26 The second involves magnetic interactions between nanofibers, which are closely associated with the distance between the nanofibers, their aspect ratio, and their diameter. When the distance between the nanofibers is reduced, magnetic interactions are enhanced, and saturation magnetizations are improved. Similar behaviors have been observed in previous works.Reference Tong, Wu, Qiao, Yuan, Guan and Qian26–Reference Niu, Chen, Ning, Jia and Wang28
On the basis of these findings, the following conclusions can be made: at α ≤ 0.010 M, the contribution of magnetic interactions to the increase in M s is critical. However, if the α is increased to 0.050 M, the increasing M s is ascribed to the cooperative action of nanoeffects and magnetic interactions. Increasing the α further to 0.20 M results in a decline in the M s, which is related to a decrease in magnetic interactions.
H c usually has an approximately negative relationship with the square of the diameter.Reference Xiao, Chao, Xue and Li29 However, when the diameter is constant, H c increases with increasing nanofiber length and tends to reach a certain value. This is because exchange interactions cannot keep all the magnetic moments of reversal in one direction, and thus, coercivity decreases because of the formation of a multidomain structure.
In this study, the change in the H c of the Fe nanofibers is mainly attributed to aspect ratio variations. Compared with Fe microspheres,Reference Tong, Wang, Guan and Zhang30 Fe nanoparticles (~50-nm diameter) produced at α = 0.0020 M have a markedly increased H c. This is due to the large shape anisotropy of the agglomerated nanoparticles of the microspheres and the single domain structure from the reduced crystal size of the nanospheres.
E. Dielectric properties
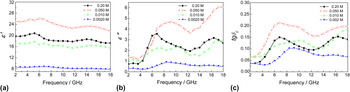
Figure 6 shows the real (ε′) and imaginary (ε″) parts of the complex permittivity, and the dielectric loss (tgδ E) of the wax composites with 50 wt% powders. The change in trends of ε′, ε″, and tgδ E are represented as an inverted U-shape.
The (a) real and (b) imaginary parts of the complex permittivity, and (c) dielectric loss of polycrystalline Fe samples obtained from various concentrations.

The values of ε′, ε″, and tgδ E reached maxima of ~24, ~4, and ~0.2 at α = 0.050 M, respectively. This means that an oversized aspect ratio is adverse to the improvement of dielectric properties of the Fe material. Moreover, the above values are obviously higher than those of Fe microspheres and microfibers with the same mass percentage. This indicates that Fe nanofibers possess high loss and storage capacities for electrical energy.
For asymmetric dielectric materials, the total polarization includes electronic polarization, ionic polarization, orientation polarization, and interfacial polarization. Among these, electronic and ionic polarizations possess high resonance frequencies and resonance spectra due to high restoring forces and low resistances. In this case, the real part of the permittivity takes on a constant, and the imaginary part is zero. In contrast, the orientation polarization and interfacial polarization have lower resonance peaks and relaxation spectra, resulting in a large-scale fluctuation of the permittivity.
The polarization of dielectric materials is determined by their shape and structure parameters. When the external field is perpendicular to the Fe nanofibers, the radial permittivity is much smaller than the axial dielectric due to strong depolarization effects. In this case, the axial depolarization effect should be carefully considered. In addition, the length of electromagnetic microwaves is much larger than the size of the Fe fibers, and inductance is not significant at 10−9 to 10−11 Hz. Thus, a single fiber is equivalent to a resistance-capacitance circuit.
In the equivalent circuit, the voltage is  , the axial resistance of Fe nanofibers is
 , and the capacitance is
 where σ is the electric conductivity of the Fe nanofibers, a is the Fe nanofiber radius, and the axial demagnetization factor of the Fe fibers is:

Thus, the complex permittivity of the Fe fibers is

As shown in Eqs. (2) and (3), the axial complex permittivity of Fe fibers is closely relative to the radius (a), the aspect ratio (λ = l/2a), and the electrical conductivity (σ), among other factors. According to the literature, the real part of the axial permittivity of Fe microfibers decreases with increasing diameter, whereas the variation trend of the imaginary part shows an upward concave shape. As the aspect ratio increases, the real part of the axial permittivity significantly increases, whereas the imaginary part does not change significantly. In addition, increasing conductivity causes an increase in the imaginary part of the axial permittivity.
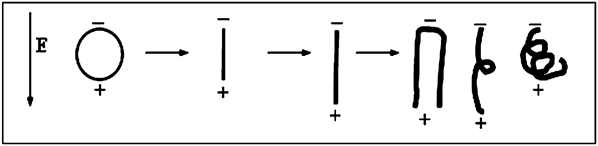
Except for the above conclusions inferred from the linear distribution of a single Fe microfiber in the matrix, there are several points worth considering: (i) Crystal size is an important factor that affects the dielectric constant. Defects and dangling bonds on the surface of nanomaterials increase as the crystal size decreases. Hence, strong space charge polarization is created in an alternating EM field and causes high permittivity. As well, the specific surface area is closely related to interfacial polarization, and increases with decreasing diameter, thus generating high permittivity. (ii) The different morphologies and structures between the spherical nanoparticles and nanofibers create different polarization modes. As shown in Fig. 7, the charges in the applied electric field were accumulated on the surface of the spherical particles and on the two ends of the 1D structure. The permittivity of the spherical nanoparticles depends on the interfacial polarization between particles, as well as between the particles and the matrix. In contrast, the permittivity of a 1D structure depends not only on the interfacial polarization but also on the orientation polarization from their shape anisotropies. (iii) Fe nanofibers are usually randomly distributed in the matrix. When the aspect ratio of Fe fibers is increased, Fe fibers may become crisp in the paraffin matrix. In this case, orientation polarization of Fe fibers would decrease, which reduces the permittivity. In the parallel distribution of fibers, radial polarization cannot be ignored. Although these factors are complex, they have to be considered. In addition, Fe nanofibers form a conductive network more easily than microfibers and spherical particles, owing to its 1D structure with high S BET, low density, and low threshold; these cause a higher dielectric constant and dielectric loss.
Schematic illustrations for the polarization of Fe nanoparticles and nanofibers with different aspect ratios exposed to an applied electric field.

Overall, at α ≤ 0.050 M, the increasing orientation polarization from the aspect ratio plays a key role in enhancing permittivity. In contrast, space charge polarization and interfacial polarization contribute significantly to the decreasing permittivity at α > 0.050 M.
F. Dynamic magnetic properties
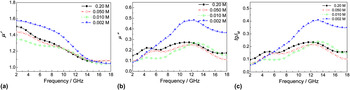
The influence of Fe2+ concentrations on the real μ′ and imaginary μ″ parts of the complex permeability and magnetic loss tgδ M of Fe nanomaterials was studied at 2−18 GHz (Fig. 8). At high frequency ranges, Fe nanofibers have slightly lower μ′, μ″, and tgδ M values than Fe nanoparticles due to the enhanced demagnetization of the latter induced by the increasing eddy current.Reference Wu, He, Zhao and Yao4, Reference Wu, Zhao, He and Yao5 As the λ and D increase, the μ′, μ″, and tgδ M values of the Fe nanofibers increase at low-frequency ranges and decrease at high frequency ranges.
The (a) real and (b) imaginary parts of the complex permeability, and (c) magnetic loss of the Fe samples obtained at various Fe2+ concentrations.

As for 1D ferromagnetic nanomaterials, when their λ reaches a certain value, the two radial demagnetization factors N a and N b are approximately ½, and the axial demagnetization factor N c is approximately zero. Thus, when the polarization direction of the external field is perpendicular to the Fe nanofibers, the radial permeability is much smaller than the axial permeability, owing to strong demagnetization effects. In this case, only the axial permeability would be analyzed.
In the microwave EM field, magnetic moment contributions include two aspects: The first is the orientation of the inherent magnetic moment, which involves the magnetization process of magnetic domain rotation and domain wall displacement. These depend on the intrinsic permeability of the fiber and the magnetic field. The second is the magnetic moment generated by the electronic vortex, which is closely related to the diameter, aspect ratio, electrical conductivity, and distribution of the magnetic materials.
As the diameter of Fe nanofibers is decreased, the real and imaginary parts of the axial permeability are increased due to the enhanced demagnetization field.Reference Li, Chen, Ong and Yang31 In contrast, the demagnetization effect is weakened with increasing aspect ratio of the Fe nanofibers.Reference Tong, Yuan, Ma, Guan, Wu, Li and Qiao3 This causes a significant increase in the imaginary part and an insignificant change in the real part of the axial permeability. When the electrical conductivity of Fe nanofibers is increased, the real part of the axial permeability decreases. The orientation and random distributions of the fibers also contribute to the electromagnetic characteristics of the microwave. To sum up the above arguments, when λ = 1 and D = ca. 40 nm, the values of μ′, μ″, and tgδ M reach a maximum.
G. Microwave absorbing properties
The reflection loss (R L) was utilized to represent the microwave absorption properties, and was calculated according to the theory of the transmission lineReference Tong, Wu, Guan, Qian, Yuan and Li32–Reference Tong, Wu, Hua, Miao, Guan and Qian34:

where Z 0 is the characteristic impedance of the free space and Z in is the input impedance between the free space and the material. The impedance matching conditions are determined by the combinations of ε′, ε″, μ′, and μ″ at a given frequency (f = 2–18 GHz) and coating thickness (d = 1.0 mm). The results are shown in Fig. 9 and Table I.
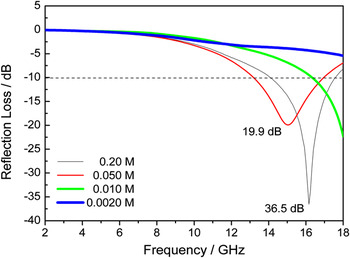
Reflection loss curves of single-layer absorption coatings using Fe samples produced at various concentrations as absorbents.

Figure 9 reveals the typical relationship between R L and f of Fe nanofibers produced under various concentrations. Spherical Fe nanoparticles display poor absorption properties, in which the effective bandwidth (W B) (R L ≤ −10 dB, corresponding to 90% attenuation of the incident wave) is zero (Fig. 9). In contrast, the Fe nanofibers exhibited better properties. The R L curves gradually shifted to low frequencies due to the enhanced permittivity as the α increased from 0.0020 to 0.050 M. The curves then returned to high frequencies at α = 0.20 M, owing to the reduced permittivity of the fibers. This indicates that the absorption properties of Fe nanofibers can be adjusted by changing their aspect ratios and diameters.
The R L values (≤−10 dB) for Fe nanofibers produced at α = 0.20 M are recorded in the 14.08−17.60 GHz range, and a minimum R L of −36.5 dB is observed at 16.16 GHz. In particular, the areal density of 1.8 kg·m−2 is significantly lower than those of microfibers and nanospheres.
In comparison with spherical Fe nanoparticles, the effective bandwidth (≤−10 dB) was significantly extended from 0 to 3.84 GHz, and the absorbing intensity was also enhanced. Some factors, such as interfacial polarization, multiple scattering, magnetic losses, and the resonance absorption from interactions between the magnetic dipoles of Fe nanofibers, could be responsible for the enhanced microwave absorption observed. In addition, a conductive network is easily formed from Fe nanofibers owing to their low threshold values, enhanced dielectric losses, and improved matching and absorption characteristics.
Meanwhile, the effective bandwidth (R L ≤ −10 dB) is 3.84 GHz, which is broader than those reported in the literature, i.e., 2.0-μm Fe microfibers,Reference Wu, He, Zhao and Yao4 microwires (8−12 μm),Reference Liu, Itoh, Terada, Horikawa and Machida35 Fe flakes,Reference Kim, Kim, Yoon and Lee36 Sn-filled multiwalled carbon nanotubes,Reference Zhu, Zhang, Zhang, Song, Huang and Zhang37 Fe nanorods,Reference Fan, Guan, Wang and Tong38 and Fe55Ni45 microfibers.Reference Li, Gong, Nie, Zhao and He7 This demonstrates that Fe nanofibers can be considered as a powerful absorbent in practical utilization.
To improve low-frequency absorption and broaden bandwidths, the current research mainly focuses on the adjustable preparation of uniform diameters and aspect ratios of Fe fibers, and the improvement of construction technologies of fiber orientation, delamination, and dispersion. Only in doing so can Fe nanofibers become excellent absorbers.
IV. CONCLUSIONS
A facile reduction method was developed to synthesize ball-chain polycrystalline Fe nanofibers. By varying the α from 0.010 to 0.20 mol·dm−3, the aspect ratio and diameter of Fe nanofibers can be adjusted over 1−65 and 30−95 nm, respectively. The influence of fiber structures on the properties was systematically investigated. Static magnetic and microwave electromagnetic properties of Fe nanofibers can be conveniently modulated by the variation of their diameters and aspect ratios. Compared with Fe nanoparticles, Fe nanofibers possess stronger absorption and broader bandwidths. This is ascribed to high dielectric losses from the large shape anisotropy of the 1D nanostructure. Thus, the prepared Fe nanofibers may have high potential in light-weight and broad bandwidth microwave absorbing applications.
ACKNOWLEDGMENTS
This work is financially supported by the Natural Scientific Foundation of China (Project No.51102215) and Zhejiang Province (Project No. Y4100022), the Special Grand Science-Technology Project in Zhejiang Province (No. 2010C11053), the Key Innovative Team of Magnetic Materials in Zhejiang Province (2011R09006-06), New Bud Talents Grant from Zhejiang Province (2011R404006), the Science and Technology Projects from Jinhua City (Nos. 2010A12066, 2011A11373, and 2011A33112), and Open Lab Project from Zhejiang Normal University.