INTRODUCTION
The continental shelf, as a crucial place for sediment “source to sink” (STS) processes and land–ocean interactions (McMillan, Reference McMillan2002; Gerber et al., Reference Gerber, Pratson, Kuehl, Walsh, Alexander and Palmer2010; Li et al., Reference Li, Li, Liu, Qiao, Ma, Xu and Yang2014a), archives a large amount of geologic information, such as glacio-eustatic sea-level fluctuations, regional tectonic activities, sediment supplies, and hydrodynamic environments (Pinter and Gardner, Reference Pinter and Gardner1989; Jordt et al., Reference Jordt, Faleide, Bjørlykke and Ibrahim1995; Gensous and Tesson, Reference Gensous and Tesson1996; Osterberg, Reference Osterberg2006; Catuneanu et al., Reference Catuneanu, Abreu, Bhattachary, Blum, Dalrymple, Eriksson and Fielding2009). Actually, the sediment STS process represents environmental signal propagation in sedimentary systems (Romans et al., Reference Romans, Castelltort, Covault, Fildani and Walsh2016; Sweet and Blum, Reference Sweet and Blum2016) and can be easily recognized in marginal seas. Sediment carried by the drainage system is mostly deposited on the shelf and slope of marginal seas, which are ideal places to study sediment STS processes. The sediment transport model from estuary to submarine canyon has been proposed by previous studies (Clift et al., Reference Clift, Giosan, Henstock and Tabrez2014; Sweet and Blum, Reference Sweet and Blum2016; Li et al., Reference Li, Clift, Böning, Blusztajn, Murray, Ireland, Pahnke, Helm and Giosan2018b) that also revealed the response of sedimentary records to sea-level and climate changes. Romans et al. (Reference Romans, Castelltort, Covault, Fildani and Walsh2016) evaluated the environmental signal propagation across sediment-routing systems and mainly focused on the sediment supply from source to sink. Liu et al. (Reference Liu, Zhao, Colin, Stattegger, Wiesner, Huh and Zhang2016b) investigated the sediment transport processes from the river mouth to the continental shelf of the South China Sea and then to the abyssal basin at two time scales: modern processes and late Quaternary glacial cycles. And many researchers have studied modern sedimentary dynamics in different environments, such as estuaries (Burchard et al., Reference Burchard, Schuttelaars and Ralson2018; Li et al., Reference Li, He, Xia and Dou2018a) and coastal marginal seas (Yang et al., Reference Yang, Jung, Lim and Li2003; O'Brien et al., Reference O'Brien, Macdonald, Melling and Iseki2006; Li et al., Reference Li, Li, Liu, Qiao, Ma, Xu and Yang2014a; Warrick et al., Reference Warrick2014), through in situ observation and simulation. Quaternary sea-level history is characterized by multistage and large-scale fluctuations (Chappell and Shackleton, Reference Chappell and Shackleton1986; Imbrie et al., Reference Imbrie, Boyle, Clemens, Duffy, Howard, Kukla and Mix1992; Rohling et al., Reference Rohling, Foster, Grant, Marino, Roberts, Tamisiea and Williams2014), resulting in dramatic changes in land–sea configuration and shelf strata (Jin et al., Reference Jin, Chough and Ryang2002; Miller et al., Reference Miller, Sugarman, Browning, Sheridan, Kulhanek, Monteverde, Wehmiller, Lombardi and Feigenson2013; Shi et al., Reference Shi, Yao, Liu, Larrasoaña, Bai, Liu and Liu2016; Liu et al., Reference Liu, Zhang, Mei, Zhao, Guo, Zhao, Liu, Satio, Wu and Li2018). Hence, research on the stratigraphic sequence and sediment STS processes of the neritic shelf can provide new understanding of how a coastal sedimentary environment has responded to climate changes and tectonic activities (Catuneanu et al., Reference Catuneanu, Abreu, Bhattachary, Blum, Dalrymple, Eriksson and Fielding2009; McCarthy et al., Reference McCarthy, Katz, Kotthoff, Browning, Miller, Zanatta, Williams, Drljepan, Hesselbo and Bjerrum2013; Shi et al., Reference Shi, Yao, Liu, Larrasoaña, Bai, Liu and Liu2016) and can serve as a guide for future exploration of marine geologic resources (Nicholas et al., Reference Nicholas, Christopher, Gary and Tom2015).
The South Yellow Sea (SYS) is a semiclosed epicontinental sea, covering an area of about 30.9 × 10⁴ km2, and its depositional environment is sensitive to sea-level changes as a result of its gently sloping topography (Lee and Chough, Reference Lee and Chough1989; Milliman et al., Reference Milliman, Qin and Park1989; Qin et al., Reference Qin, Zhao and Chen1989; Chough et al., Reference Chough, Lee, Chun and Shinn2004; Yoo et al., Reference Yoo, Lee, Kim, Kang, Yi, Kim and Kong2016). The recent continental shelf drilling in the SYS has revealed sedimentary strata since 3.5 Ma (e.g., Liu et al., Reference Liu, Liu, Zhang, Liu, Wu, Mei, Shi and Zhao2016a, Reference Liu, Zhang, Mei, Zhao, Guo, Zhao, Liu, Satio, Wu and Li2018), and previous studies have identified multiple transgressive formations (e.g., Yang, Reference Yang1994; Liu et al., Reference Liu, Shi, Liu, Ge, Liu, Yao and Liu2015, Reference Liu, Zhang, Mei, Zhao, Guo, Zhao, Liu, Satio, Wu and Li2018; Li et al., Reference Li, Zhao, Feng, Liu, Xie and Zhou2016; Mei et al., Reference Mei, Li, Zhang, Liu, Liu, Wang, Lan, Liu and Sun2016), especially the stratigraphic sequence since the last glacial maximum (LGM; Lee and Chough, Reference Lee and Chough1989; Park et al., Reference Park, Lee, Han, Lee, Kim and Yoo2000; Jin and Chough, Reference Jin and Chough2001; Jin et al., Reference Jin, Chough and Ryang2002; Chough et al., Reference Chough, Lee, Chun and Shinn2004; Lee et al., Reference Lee, Kim, Yoo and Yi2014; Yoo et al., Reference Yoo, Chang, Lee, Kim, Kim and Park2015, Reference Yoo, Lee, Kim, Kang, Yi, Kim and Kong2016). In accordance with previous work, most buried paleochannels were found to have formed during the LGM (Li et al., Reference Li, Yu, Jiang, Du and Song1991; Zheng, Reference Zheng1991; Korea Institute of Geoscience and Mineral Resources, 1992; Liu et al., Reference Liu, Saito, Kong, Wang, Wen, Yang and Nakashima2010). However, it is interesting to note that very few studies have explored the relationship between the shelf strata spatial distribution and sea-level changes during different geologic periods. Also, the spatial distribution of paleochannels on the SYS continental shelf during the period of subaerial exposure is unknown, except for the channels in the western SYS recognized by Liu et al. (Reference Liu, Saito, Kong, Wang, Wen, Yang and Nakashima2010). The extent of the ancient Yellow River and Yangtze River, specifically whether the ancient Yellow River reached the Yellow Sea Trough in geologic epochs, has not been identified in previous research. In general, the responses of marine sedimentary strata and buried paleochannels to the sea-level changes still require further study.
In addition, the SYS is located in the typical monsoon region (Yancheva et al., Reference Yancheva, Nowaczyk, Mingram, Dulski, Schettler, Negendank, Liu, Sigman, Peterson and Haug2007); hence the evolutionary history of the Asian summer monsoon is recorded in the sediments of the SYS shelf. The Asian summer monsoon is driven by temperature differences between the East Asian continent, the Pacific Ocean, and the Indian Ocean (Beck et al., Reference Beck, Zhou, Li, Wu, White, Xian, Kong and An2018), and it carries moist air to eastern China. In Quaternary paleoclimate studies, its variability can be understood by using monsoon proxies, which can generally be extracted from archives, such as loess and stalagmites (e.g., Fleitmann et al., Reference Fleitmann, Burns, Mudelsee, Neff, Kramers, Mangini and Matter2003; Cheng et al., Reference Cheng, Zhang, Spötl, Edwards, Cai, Zhang, Sang, Tan and An2012; Beck et al., Reference Beck, Zhou, Li, Wu, White, Xian, Kong and An2018; Lu et al., Reference Lu, Ma, Zhu, Lu, Zhang, Huang and Guo2018). Summer monsoon shows significant changes at decadal, centennial, and millennial time scales. High precipitation brought by the Asian summer monsoon not only increases river runoff, but also accelerates erosion in the source area that is generally characterized by large landslides (Bookhagen et al., Reference Bookhagen, Thiede and Strecker2005; Clift et al., Reference Clift, Giosan, Blusztajn, Campbell, Allen, Pringle and Tabrez2008; Romans et al., Reference Romans, Castelltort, Covault, Fildani and Walsh2016), and ultimately increases the sediment supply to the shelf. Dai et al. (Reference Dai, Yang, Gao, Liu, Li and Li2007) also found that the amount of sediment emptied by rivers into the sea depends on the amount of river discharge and precipitation over the past 50 years in China. Thus, a study of the development of paleochannels and sediment flux in the SYS can also provide a new proxy for exploring the evolutionary history of the Asian summer monsoon.
The central muddy area (CM) of the SYS has the biggest mud deposit in the shelf area of the eastern China Seas. Although the formation mechanism of the CM is contentious, based on numerical simulation, tidal current is found to be a crucial factor in the deposition of fine-grained sediment (Wang et al., Reference Wang, Li, Zhang and Dong2014; Zhou et al., Reference Zhou, Dong and Li2015). In addition, the Yellow Sea warm current, cold-water mass, and upwelling contribute greatly to the formation of the CM (Shi et al., Reference Shi, Shen, Yi, Chen and Meng2003; Wang et al., Reference Wang, Li, Zhang and Dong2014). Simulation results indicate that the range of the weak hydrodynamic environment in the CM expands gradually with sea-level rise (Zhou et al., Reference Zhou, Dong and Li2015). Mud deposits can be used to identify sea-level rise and high sea-level deposits (Saito et al., Reference Saito, Katayama, Ikehara, Kato, Matsumoto, Oguri and Yumoto1998; Kim and Kucera, Reference Kim and Kucera2000; Li et al., Reference Li, Li, Liu, Qiao, Ma, Xu and Yang2014a; Wang et al., Reference Wang, Li, Zhang and Dong2014; Zhou et al., Reference Zhou, Dong and Li2015), and the range and thickness of the CM can roughly reflect the duration of high sea levels. It is possible to indirectly use the characteristics of stratigraphic distribution in the study area to infer the scale of transgression history.
In the present study, the evolution of sequence stratigraphy in the SYS is investigated by synchronizing high-resolution seismic profiles acquired from the central SYS and sedimentary features extracted from the boreholes (YS01, EY02-2). This method has been widely used in stratigraphic studies (e.g., Trincardi et al., Reference Trincardi, Correggiari and Roveri1994; Tortora, Reference Tortora1996; Yoo and Park, Reference Yoo and Park2000; Li et al., Reference Li, Zhao, Feng, Liu, Xie and Zhou2016). Therefore, it is employed here to assess factors affecting the SYS strata during the Quaternary and to reconstruct the sedimentary environment evolution of the SYS basin in the late Quaternary. Transgressive strata distribution and paleochannel evolution in the SYS during the late Pleistocene are systematically analyzed, and the stratigraphic evolution model of marginal seas under sea-level changes at glacial–interglacial time scales is established. In addition, discussions on the controlling factors of the stratigraphic development of the continental shelf, including tectonic activity, sea-level change, and monsoon rainfall, provide new insights into the evolution of the sedimentary basin during the Quaternary. Two STS models are established, and regional sea-level changes are discussed from the perspective of sequence stratigraphy. This can serve as a reference for studying the development and evolution of other epicontinental seas. In short, this study both provides a possible description of epicontinental shelf response to sea-level changes and a high-resolution stratigraphic sequence correlation in Western Pacific marginal seas, especially during the late Quaternary and highlights the significance of sequence stratigraphy in Quaternary science research.
GEOLOGIC SETTING
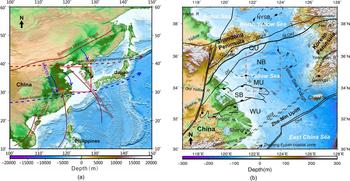
The SYS is a semiclosed epicontinental sea located between mainland China and the Korean Peninsula, with an average water depth of 44 m. Its submarine topography is characterized by the SYS floor being tilted from its two sides to the Yellow Sea Trough, with a steeper slope near the Korean Peninsula (Fig. 1b; Qin et al., Reference Qin, Zhao and Chen1989). The sediments deposited in the SYS are mainly derived from the circumjacent land and carried by rivers, including the Yellow River, the Yangtze River, the Huai River, and rivers of the Korean Peninsula (Fig.1b; Lee and Chough, Reference Lee and Chough1989; Park and Khim, Reference Park and Khim1992; Lee and Chu, Reference Lee and Chu2001; Yang et al., Reference Yang, Jung, Lim and Li2003; Li et al., Reference Li, Hu, Wei, Zhao, Zou, Bai, Dou, Wang and Fang2014b). The Yellow River and the Yangtze River annually discharge about 8.8 and 4.3 million tons of suspended sediments into the sea, respectively, and these two rivers are considered the major sediment sources for the Yellow Sea (Yang et al., Reference Yang, Jung, Lim and Li2003; Yang and Youn, Reference Yang and Youn2007), whereas the sediment carried by rivers of the Korean Peninsula mainly deposit on the estuary and the southeastern SYS (Fig. 1b; Chough et al., Reference Chough, Kim, Lee, Shinn, Jin, Suh and Lee2002; Yang et al., Reference Yang, Jung, Lim and Li2003). In addition, the SYS is a region strongly influenced by the East Asian monsoon (Fig. 1a; Yancheva et al., Reference Yancheva, Nowaczyk, Mingram, Dulski, Schettler, Negendank, Liu, Sigman, Peterson and Haug2007), which has made a great contribution to the local circulation development (Fig. 2).
Maps of research area. (a) The locations of Yellow Sea, East China Sea, and the sphere of the Asian monsoon (East Asian summer monsoon, East Asian winter monsoon, Indian summer monsoon). The red box represents the area shown in b. (b) The main structural units of the SYS. The red dashed outline is the main study area. The major tectonic units from the north to the south include: NYSB, North Yellow Sea Basin; QU, Qianliyan Uplift; NB, Northern Basin; MU, Middle Uplift; SB, Southern Basin; WU, Wunansha Uplift. The major fault systems are WQHf, Wulian-Qingdao-Haizhou fault; SLQKf, Siyang-Lianyungang-Qianliyan-Kaicheng fault; JXf, Jiashan-Xiangshui fault; JSGF, Jiangshan-Shaoxing-Gwangju fault, DHf; Dongyin-Haijiao fault. Information about the basins and faults were derived from Yi et al. (Reference Yi, Ye, Chen, Li, Long, Wang, Du, Zhao and Deng2014). (For interpretation of the references to color in this figure legend, the reader is referred to the web version of this article.)

Map showing the location of high-resolution seismic lines and boreholes and oceanic circulations in the SYS and its adjacent area. The orange lines represent multichannel seismic lines. The blue lines represent the subbottom lines. The red stars represent the cores on seismic lines. Red heavy lines and rectangles denote the selected profiles shown in Figures 3, 5, and 7. The oceanic circulation is marked with gray and dark red arrows. The abbreviations in the figure are SSCC, South Shandong coastal current; NJCC, North Jiangsu coastal current; YSCC, Yellow Sea coastal current; YSWC, Yellow Sea warm current; SKCC, South Korean coastal current. (For interpretation of the references to color in this figure legend, the reader is referred to the web version of this article.)

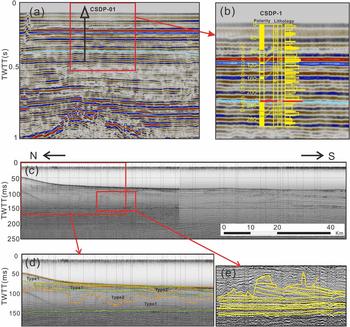
(color online) Interpretation of multichannel seismic (a and b) and subbottom profiles (c–e). (a) The basement of the Quaternary strata on the SYS shelf based on offshore borehole CSDP-01. (b) The sedimentary stratigraphy and magnetostratigraphy characteristics of CSDP-01. The boundary of Quaternary strata in SYS is recognized by the location of Matuyama/Gauss revealed by borehole CSDP-01. (c) The seismic data and (d and e) the interpretation section. Two types of seismic units (SU), which alternately appeared in the vertical direction of the subbottom profiling, were identified in the subsurface sedimentary strata. Type 1 units shows transparent or semitransparent parallel and subparallel reflections with a conformable surface, while type 2 units shows chaotic seismic reflection with a bottom boundary with U- or V-shaped geometry. TWTT, two-way travel time.

The SYS basin belongs to the Mesozoic–Cenozoic graben basin, which has been undergoing complicated geologic evolution since ~27 Ma (Qin et al., Reference Qin, Zhao and Chen1989; Niu and Tang, Reference Niu and Tang2016). Tectonic movement tended to be stable until the Quaternary, and the tectonic framework presents five secondary structural units, including three uplifts and two basins (Fig. 1b; Qin et al., Reference Qin, Zhao and Chen1989). The Zhe–Min Uplift (ZMU) is considered to be the boundary between the SYS and East China Sea (Yi et al., Reference Yi, Ye, Chen, Li, Long, Wang, Du, Zhao and Deng2014), and it extends northeastward from the Zhejiang–Fujian coastal zone, crossing Cheju Island, to the southeastern Korean Peninsula (Fig. 1b). This uplift was amplified by the Yanshan movement in the late Mesozoic, which temporarily prevented seawater from entering the Yellow Sea and Bohai Sea due to high topography (Yi et al., Reference Yi, Ye, Chen, Li, Long, Wang, Du, Zhao and Deng2014). The ZMU underwent multistage tectonic uplift/subsidence processes during the Quaternary and stabilized at about 0.2 Ma (Yi et al., Reference Yi, Ye, Chen, Li, Long, Wang, Du, Zhao and Deng2014), making the water-level changes in the SYS consistent with global sea-level changes.
MATERIALS AND METHODS
Borehole core YS01 (30.09 m deep, 35°30′N, 122°30′E; Fig. 2) was drilled at the western CM in the SYS during the cruises of R/V K407 in 2006. The total drilling length was 30.1 m, and the recovery of the sediment was 97% on average. The core was split lengthwise and subsampled in the laboratory.
Subsamples for benthic foraminifera identification were spaced at 4 cm, and a total of 574 samples were analyzed. The >63 µm fraction was examined under a stereoscopic microscope for foraminifera, and the taxonomy of benthic foraminifera follows the standard treatment method (Wang et al., Reference Wang, Min, Bian and Wang1985; Wang et al., Reference Wang, Zhang, Zhao, Min, Bian, Zheng, Cheng and Chen1988; Loeblich and Tappan, Reference Loeblich and Tappan1994). This analysis was conducted at Ocean University of China, Qingdao, China.
Grain size samples were spaced at 1 cm with a total of 2038 samples. Particle size analysis was conducted at the First Institute of Oceanography, Ministry of Natural Resources, Qingdao, China, using a Malvern Mastersizer 2000 laser particle-size analyzer. The detrital fraction of the sediment was isolated from bulk sediment after removing the organic matter using 5 ml of 30% hydrogen peroxide and the carbonates using 5 ml of 10% hydrochloric acid. Then all samples were soaked with neutral distilled water and washed three times with a centrifuge. The treated samples were dispersed by an ultrasonator for 50 seconds and then examined with the particle-size analyzer. The particle-size analyzer was used for grain size analysis with a range between 0.02 and 2000 µm and an error less than 3%.
Seven dating samples were obtained from 14C-accelerator mass spectrometry (AMS) dating on shells of mixed benthic foraminifera, and the analyses were carried out at Woods Hole Oceanographic Institution, Woods Hole, Massachusetts, USA and Beta Analyses Company, Miami, Florida, USA. The depth-age model for core YS01 was established based on corrected calendar years using Calib Rev 7.0.4 software, the marine calibration curve Marine 13, and a reservoir correction for the SYS of approximately −100 ± 36 years (Southon et al., Reference Southon, Kashgarian, Fontugne, Metivier and Yim2002).
High-resolution seismic profiles were used in the present study, comprising 1417 km subbottom profiles and 4414.47 km multichannel seismic profiles (Fig. 2). Subbottom profiles were acquired using the French SIG subbottom profiling system in 2012 and 2014 during the cruises of R/V Runjiang. The subbottom profile measurement system was a SIG 2mille sparker seismic source with an average frequency of about 1000 Hz and a GeoAcoustics 5210A data acquisition system. All data were integrated with differential GPS, and the digital data were postprocessed with the GeoPro 2 software using a vertical resolution of about 0.4 m. In addition, we obtained a 4414.47-km-long multichannel seismic survey line from the Qingdao Institute of Marine Geology, China. The seismic grid was made up of 15 seismic profiles, out of which six main profiles trended north-southward and nine connecting profiles trended west-eastward. The seismic source system was a sleeve gun assembly with a filtering frequency range from 3 to 218 Hz.
To compare core data with seismic profiles, sound velocity in seawater of 1500 m/s was used for the water-depth estimation (Qin et al., Reference Qin, Zhao and Chen1989). The bulk sound velocity of 1600 m/s was used as the mean formation velocity in the Quaternary strata acquired from the correlations of CSDP-01 core and seismic data (Liu et al., Reference Liu, Zhang, Mei, Zhao, Guo, Zhao, Liu, Satio, Wu and Li2018). A deep hole (CSDP-1, 300.1 m deep, 34°18′N, 122°22′E) was used to determine the bottom boundary of Quaternary strata in this study (Fig. 2). Based on the magnetostratigraphic characteristics of core CSDP-1, Liu et al. (Reference Liu, Liu, Zhang, Liu, Wu, Mei, Shi and Zhao2016a) proposed that the base of the Quaternary (~2.6 Ma, Gauss– Matuyama boundary) in the Yellow Sea occurs at a depth of 227.16 m (Fig. 3a and b). Based on the time–depth conversion, the bottom boundary of Quaternary strata revealed by the borehole was identified on seismic profiles.
Marine isotope stages (MIS) deduced from oxygen isotope data reflect changes in temperature and global ice volume derived from deep-sea sediment and represent warm (stages with even numbers) and cold (stages with odd numbers) paleoclimate periods. The MIS time scale is widely used for dating in the Quaternary period (Aitken et al., Reference Aitken and Taylor1997; Andrews, Reference Andrews, Noller, Sowers and Lettis2000), so we used this standard in the establishment of a stratigraphic chronological framework to correlate with other climate records.
RESULTS
Depositional units from YS01: lithofacies and age dating
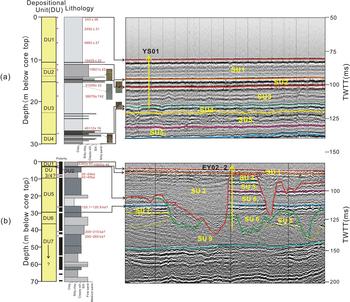
Considering the corresponding relationship between the strata revealed by boreholes and the seismic stratigraphy revealed by seismic profiles, the sedimentary succession can be divided into four depositional units (DU; Figs. 4 and 5) based on the sedimentary characteristics (e.g., lithology, structure, micropaleontology) of the borehole core YS01.
Variation of the environmental proxies recorded in YS01 core (see Fig. 2 for location). (a) Component content of clay, silt, and sand (%). (b) Medium size (μm). (c–o) Relative abundance of common benthic foraminifera (%). (p) The depth–age model of core YS01. The number represents deposition rate (cm/yr). The red point represents the age control points. The black line represents the linear interpolation of age control points. (For interpretation of the references to color in this figure legend, the reader is referred to the web version of this article.)

Explanation of crossline seismic profiles and comparison of seismic units and sedimentary units. (a) Lithology and depositional unit division of core YS01 (left), and seismic data and interpretation of line marked in Figure 2 (right). (b) Lithology and depositional unit division of core EY02-2 (left), and seismic data and interpretation of line marked in Figure 2 (right). Red heavy crosses represent the age control point of AMS14C and paleomagnetic dating. TWTT, two-way travel time. (For interpretation of the references to color in this figure legend, the reader is referred to the web version of this article.)

DU1 (0 to 1110 cm) is separated from the underlying DU2 by an abrupt lithological composition change, which is characterized by finer sediment grain size (Fig. 4). This unit is characterized by gray or taupe clayey silt with horizontal bedding, and organic matter spots and shell fragments are scattered throughout this unit (Figs. 4 and 5a). Thin shelly layers, organic matter strips, and silty clay layers are common within DU1. Water content is relatively high in sediment and can reach up to 59.6%. The benthic foraminiferal species change from a shallow-water euryhaline assemblage (e.g., Bulimina marginata, Bulimina subula) to a shallow-water marine assemblage (e.g., Astrononion tasmanensis, Ammonia ketienziensis) (Fig. 4). Four AMS14C ages in this depositional unit ranged from 10,821 ± 22 to 243 ± 36 cal yr BP (Fig. 5).
With an erosional contact with the underlying DU3, DU2 (1110 to 1518 cm) is characterized by coarser grain size than overlying and underlying strata (Fig. 4). This unit is divided into three intervals in terms of sedimentary characteristics, with boundaries at 1210 cm and 1346 cm. The upper interval (1110–1210 m) is composed of dark gray or taupe clay with thin silt and fine sand layers. Dwelling burrows and gray-white shell fragments are widely distributed within this subunit at the core depth of 1123–1130 cm. This subunit exhibits horizontal bedding and vesicular structure. The middle part (1210–1346 cm) is dominated by gray to grayish-brown silty clay and is intercalated with brown silty clay lenses and scattered with shelly and plant fragments. A few rusty speckles are visible in this subunit, and unconsolidated calcareous concretions are found at a core depth of 1315–1321 cm. The lower part (1346–1518 cm) of DU2 contains yellowish-gray to gray silt and silty sand with rhythmic stratification, and calcareous concretions and brown rusty speckles are scattered throughout the subunit (Figs. 4 and 5). Yellowish-gray clayey silt and fine sand layers are intercalated with dark gray silty clay and lenticular bedding. The abundance of benthic foraminifera in DU2 is lower than that of DU1, and the assemblage is dominated by shallow-water euryhaline species (e.g., Ammonia beccarii var., Protelphidium tuberculatum, etc.). The lower interval does not contain benthic foraminifera. Two AMS14C ages were determined, yielding results of 10,429 ± 22 cal yr BP at 1132 cm and 10,821 ± 22 cal yr BP at 1267 cm (Fig. 5a).
DU3 (1518 to 2736 cm) is separated from DU4 by a denudation plane, and it is characterized by fine-sediment grain size (Fig. 4). The upper part (1518–2220 cm) of DU3 is dominated by grayish-yellow or gray clayey silt with silty and fine silty lenses. Carbonized plant roots and dwelling burrows filled by shelly fragments are developed in basal layer. Benthic foraminifera are present in this subunit at low diversity and abundance, with dominant shallow-water euryhaline species (Ammonia beccarii var., Quinqueloculina spp., etc.). The lower part (2220–2736 cm) contains dark gray clayey silt with horizontal bedding, with moderate to strong bioturbation and scattered shelly fragments. The abundance of benthic foraminifera in this subunit exhibits relatively large fluctuations, and its assemblages are dominated by shallow-water marine species and cold-water species (Elphidium magellanicum, Buccella frigida, etc.). Two AMS14C ages obtained at 1521 cm and 1861 cm were 31,026 ± 22 cal yr BP and 38,079 ± 742 cal yr BP, respectively. One AMS14C age obtained at 2723 cm of the core YS01 was 40,112 ± 19 cal yr BP (Fig. 5).
DU4 (2736 to 3009 cm) corresponds to the upper part of SU4, and the sediment grain size in this unit is significantly coarser than in DU3 (Fig. 4). This unit is dominated by gray or taupe silty clay and taupe clayey silt with mica, and it exhibits horizontal bedding, lenticular bedding, and wave bedding (Fig. 5). The upper part is characterized by a brown, rusty, oxidized surface and carbonaceous concretion, and the lower part contains scattered shelly fragments. This unit does not contain benthic foraminifera.
Seismic stratigraphy
Seismic stratigraphy framework
As shown in Figure 3d, several unconformable and conformable stratigraphic interfaces that can be continuously tracked were identified in the subbottom profiles. The contact characteristics between strata, including onlap, downlap, toplap, and erosional truncation, were also identified in subbottom profiles (Fig. 3e). Based on the major bounding discontinuities and internal seismic reflections, we identified two types of seismic unit (SU) in the subsurface sedimentary strata, and they alternately appeared in the vertical direction of the subbottom profiling (Fig. 3d). The type 1 unit is characterized by transparent or semitransparent parallel and subparallel reflections. Its base interface shows a conformable surface that is characterized by onlap or downlap reflection termination, reflecting a flooding surface (Fig. 3d). There is no abrupt change in the stratigraphic thickness of these units in the study area. On the other hand, chaotic seismic reflection occurs in type 2 units, whose base interface is characterized by truncation and toplap reflection termination and always presents U- or V-shaped geometry caused by fluvial erosion (Fig. 3d). The recognizable bounding discontinuities were laterally extrapolated from stratigraphic units aligning parallel to each other. Based on the major acoustic characteristics mentioned earlier, the upper six seismic units (SU1–SU6, named from top to base) were studied in detail in this paper. In these seismic units, SU1, SU3, and SU5 correspond to the type 1 unit, while SU2, SU4, and SU6 correspond to the type 2 unit (Figs. 3d and 5). In addition, the sound velocity was calculated using the data from core YS01 with seismic units SU1, SU2, SU3, and SU4 of 1525, 1657, 1568, and 1609 m/s, respectively.
Seismic units: distribution characteristics
Two adjacent seismic units were combined to identify sedimentary sequences, and the type 1 unit, such as SU1, SU3, SU5, was separated from their adjacent underlying unit with a flooding surface, and their internal acoustic reflection is continuous. These units display acoustically transparent and/or acoustically translucent. Although the interface between adjacent seismic units is diachronous, each unit is considered to be contemporaneous deposition on orbital time scale based on interfacial properties.
SU1 is the youngest sediment layer in the study area, and it has a maximum depositional thickness of 30.02 m near the Shandong Peninsula with average thickness of 5.86 m (Fig. 6, SU1). According to the internal reflection characteristics, SU1 can be subdivided into three substrata, SU1a, SU1b, and SU1c. Among these, SU1a is characterized by partially visible parallel reflection layers, and it distributes in the central part of the study area (Figs. 2 and 7a). Compared with SU1a, SU1b has an internally visible high-angle progradational reflection layer, distributes in the southwestern part of the study area, and thins out southward to the central SYS (Figs. 2 and 7b). SU1c is a semitransparent sigmoid progradational reflection layer with good continuity, and it is found in the northwestern part of the study area (Figs. 2 and 7c).
(color online) Isothickness maps of the seismic units from SU1 to SU6.

(color online) Internal reflection configuration of seismic units. The location of these lines are marked in Figure 2. SU1 is divided into three substrata: muddy sedimentary body (SU1a), tide-formed sand body (SU1b), and Shandong Peninsula muddy wedge (SU1c). B0–B53 represent sequence stratigraphic boundaries.

SU2 is generally characterized by chaotic seismic facies, with U- or V-shaped valleys (Figs. 5b and 7). Transparent seismic facies usually appear in the upper valley, with subparallel reflection and progradational reflection. As shown in Figure 6, SU2 has an incised trough aligned east-west near 35°N, and a cutting center in northeast orientation shows strong incision east of 123.5°E, with maximum deposit thickness of 66 m (35°N, 123.92°E).
SU3, with an average thickness of 5.62 m, has a depositional center located in the northwest of the study area (Fig. 6, SU3). According to the internal reflection characteristics of this unit, SU3 can be subdivided into two subsequences from the top down, SU31 and SU32 (Fig. 7a). SU31 is characterized by low-angle progradational reflection layer with a semitransparent interior, and its base boundary is a downlap surface. SU32 has internally visible, parallel and subparallel seismic reflection interfaces, characterized by coastward onlap, and its base interface is traceable to the underlying maximum flooding surface.
SU4, with a maximum thickness of 30.86 m, cuts the underlying strata and has a strong down-cutting action in the southwest of the study area (Fig. 6, SU4). This unit is similar to SU2, and the internal reflection characteristics are manifested as chaotic seismic facies with poor continuity of reflection configuration. In general, this unit is relatively thin in the study area.
SU5 is widely distributed throughout the area, with maximum sedimentary thickness of 51.37 m in the southwest region and average sedimentary thickness of 16.54 m. As shown in Figure 6, two depocenters are located in the central and southwest of SYS. Based on the internal reflection features, this unit can be subdivided into three subunits from the top down, as shown in Figure 7. The base boundary of SU53 is the maximum marine flooding surface with strong reflection, and this subunit is characterized by internally visible, parallel and subparallel reflection structures. SU53 has an average thickness of 6.8 m but is thicker in the south and thinner in the north (Fig. 6, SU53). The base interface of SU52 exhibits a strong reflection, with internally visible, parallel/subparallel reflection patterns. The depositional center of this subsequence is located in the northern basin of the SYS (13.48 m; Fig. 6, SU52). SU51 shows that the reflection configuration gradually shifted from progradational reflection to parallel reflection, and the basal interface is characterized by a downlap face with a moderately strong reflection. This subunit with a maximum thickness of about 33.34 m gradually thins out from southwest to northeast.
SU6 manifests as an incised valley filled with chaotic reflection facies, and the scale of the incision is smaller than SU2 in the study area. This unit has three cutting centers located in the southeast, north-northeast, and northeast-east of the study area (Fig. 6, SU6), with a maximum downcut depth of 48.25 m. In addition, SU6 is missing in many areas, and the bottom interface shows a denudation surface in seismic profiles.
Distribution of strata revealed by SU1–6 and Quaternary strata
The boundary of the Quaternary strata in the SYS was revealed by the borehole core CSDP-01, and based on this, we obtained the distribution of Quaternary strata thickness by analyzing the shallow strata of multichannel seismic profiles (Fig. 3a and b). The depocenter is located in the two sub-sags (North Basin and South Basin, abbreviated as NB and SB, respectively), with an average thickness of approximately 226 m, which is coincident with the Tertiary depositional centers (Fig. 8a), while the sediment thickness in the central uplift area is relatively thinner (Fig. 8a).
(color online) Distributions of strata thickness in the SYS since the Quaternary (a) and the late Pleistocene (b). The tectonic framework was modified after Qin et al. (Reference Qin, Zhao and Chen1989). NB, Northern Basin; MU, Middle Uplift; SB, Southern Basin.

The distribution characteristic of the strata on the shelf during the recent three transgressions was obtained from the results of the division of the previous seismic units. Figure 8b shows that the maximum thickness of the depocenter is about 144 m. In addition to the sedimentary center mentioned earlier, the formation thickness in most of the study area is uniformly distributed (Fig. 8b). On the other hand, there is almost no stratigraphic deposit in the area east of 124°E.
DISCUSSION
Chronostratigraphic framework
The chronostratigraphic framework has been established by carrying out AMS14C and magnetostratigraphic analyses on the cores YS01 and EY02-2. According to the seismic reflection principle (Nanda, Reference Nanda2016), strong reflection appears at the interface where lithological changes occur between two adjacent strata, and this can be recognized directly by the grain-size changes. Based on the time–depth conversion method, we correlated the seismic units with the depositional units, whose division is mainly based on the sedimentary characteristics of the boreholes (Figs. 4 and 5). Eventually, the correlation of lithofacies revealed by the boreholes with seismic facies characteristics was established to construct the regional chronostratigraphic framework of the SYS strata.
Based on the sedimentary characteristics mentioned earlier, DU1 exhibits small variation of sediment grain size and is interpreted to be a shallow shelf environment. The base of this unit, which corresponds to seismic surface B1, is estimated to have an age of 10,178 cal yr BP based on the average sedimentation rate (Fig. 5a). Therefore, DU1 is correlated with SU1, which represents a high sea-level marine deposit (water depth > 40 m) at the location of core YS01 during the middle–late period of MIS 1 (14 ka to the present). DU2 (31,030–10,178 cal yr BP) is characterized by coarser sediment grain size, and the upper two subunits and the bottom subunit are interpreted as subtidal–intertidal deposits in a shallow shelf environment and floodplain deposits in a fluvial environment, respectively. The basal sedimentary interface exhibits an erosional surface, corresponding to B2 in the subbottom seismic profiles (Fig. 5a). Thus, SU2 shows a terrestrial environment and a shallow shelf environment at the location of core YS01 with a tidal influence during MIS 2 (29–14 ka) and early MIS 1. DU3 ranged from 40,453 to 31,030 cal yr BP, and it corresponded to SU3 in the seismic profile, which is interpreted as having been deposited in shallow water at the location of core YS01 during MIS 3 (57–29 ka). Considering the distribution of SU2, the lack of this seismic unit in the eastern part of the study area is mainly due to the incision of its overlying strata (Fig. 6). DU4 corresponded to the upper part of SU4 in the subbottom profile (Fig. 5a), which is interpreted as a fluvial deposit environment at the location of core YS01. This unit is completely devoid of foraminifera in sediments at the corresponding location in core YS01. Owing to the lack of age control, we speculate that this unit was formed in the early stage of MIS 3 or MIS 4 (71–57 ka) according to the dating of overlying and underlying units. B4 is considered to be the basal boundary of SU4, corresponding to 8.5 m positions of core EY02-2 (~42 ka), and it is characterized by a significant change in grain size (Ge et al., Reference Ge, Shi, Zhu, Liu, Yin and Liu2006). This depositional unit above B4 revealed by core EY02-2 is dominated by gray clay to clayey silt with a shallow-water assemblage (e.g., Elphidium magellanicum; Zhuang et al., Reference Zhuang, Chang, Li and Yan2002), indicating a proximal shallow-water deposit at the location of core EY02-2 during MIS 4. SU5 corresponded to the sedimentary formation of borehole EY02-2 from 8.5 to 26.5 m below the core top (Fig. 5b). This depositional unit is dominated by light-gray or grayish-green fine sand to gray clay and silt, and the foraminifera species mainly included the assemblage of Elphidium magellanicum and Ammonia beccarii var. (Zhuang et al., Reference Zhuang, Chang, Li and Yan2002). Magnetostratigraphic results for EY02-2 recorded the Blake event (120.9–120.1 ka), ranging from 26.11 m to 26.40 m below the core top (Ge et al., Reference Ge, Shi, Zhu, Liu, Yin and Liu2006). It is interpreted as the shallow shelf deposit at the location of core EY02-2 during MIS 5 (130–71 ka). Despite the low chronological resolution of SU5, we hypothesized that SU51, SU52, and SU53 may correspond to the substages MIS 5a, MIS 5c, and MIS 5e, respectively. SU6 corresponded to the core EY02-2 from 26.5 to 32.5 m below the core top (159–130 ka, linear interpolation from magnetic age control points), and it is characterized by light gray-green fine sand layers with scattered shelly and carbonized plant fragments (Zhuang et al., Reference Zhuang, Chang, Li and Yan2002; Ge et al., Reference Ge, Shi, Zhu, Liu, Yin and Liu2006). This unit is interpreted as fluvial deposit at the location of core EY02-2 during MIS 6 (191–130 ka) and littoral shelf deposit during the early stage of MIS 5. In short, six seismic units identified in this study revealed the sedimentary strata in the central SYS since the late Pleistocene.
The extent of transgression and development of paleochannels
In this study, we used high-resolution seismic profiles and drilling cores to reveal the characteristics of the central SYS strata distribution during the late Pleistocene and found three complete sets of stratigraphic sequences that are distinguished by a regional unconformity, U- and/or V-shaped downward erosion interfaces (Fig. 3d). These sedimentary discontinuities are mainly induced by the weathering and/or denudation of strata and stream trenching (Chough et al., Reference Chough, Kim, Lee, Shinn, Jin, Suh and Lee2002; Jin et al., Reference Jin, Chough and Ryang2002). For each sequence, the upper (SU1, SU3, and SU5) and lower strata (SU2, SU4, and SU6) are separated by the flood surfaces, and the upper part shows continuous internal acoustic reflection (Figs. 3 and 7). Meanwhile, the sedimentary characteristics exhibit a large range of littoral–neritic deposit, so the upper strata (SU1, SU3, and SU5) are confirmed as a high-stand system tract that corresponds to three stages of transgression, HI, HII, and HIII, respectively. On the other hand, the lower strata exhibits a terrestrial deposit with a rusty oxidized surface and scattered calcareous concretions at the bottom and a tidally influenced nearshore deposit at the top. These strata are interpreted as the lowstand sea-level deposit at the late stage of sea-level drop and/or the early stage of sea-level rise, named LI, LII, and LIII from top to bottom. The typical environmental factors related to the development of upper and lower strata in a sedimentary sequence are sea-level changes and channel erosion, respectively. We discuss in the following sections the scale of the transgression and the development of paleochannels revealed by sedimentary strata during the three stages of sea-level fluctuations.
Responses of transgressive strata to sea-level changes
Based on the distribution characteristics of SU1 (Fig. 6) and lithological characteristics revealed by the boreholes (Fig. 4), the depocenter in the central SYS identified from the seismic profiles was regarded as the central muddy sedimentary area (Yang and Youn, Reference Yang and Youn2007; Li et al., Reference Li, Li, Liu, Qiao, Ma, Xu and Yang2014a; Wang et al., Reference Wang, Li, Zhang and Dong2014). The stratum distribution is characterized by thinning from the center to the surroundings (Fig. 6). Simulation results have indicated that whether the CM develops or not, its boundary range can reflect the eustatic sea-level changes (Zhou et al., Reference Zhou, Dong and Li2015). Based on the limitation of the vertical resolution of the seismic stratigraphy (~0.4 m), a 3 m isopleth of thickness was used as the effective boundary of the CM in this study (Fig. 9).
Schematic of environmental evolution of the SYS since the late Pleistocene. (a, c, e, f, and g). The transgressive strata distribution, current development, and provenance direction at three transgressive stages. The gray line represents current. The red line represents the possible source direction. The blue dotted line represents the range of CM. (b, d, and h) The possible paleochannel distribution on the shelf at three shelf-exposure periods. The gray line in b shows the paleochannels identified in previous studies (Korea Institute of Geoscience and Mineral Resources, 1992; Li et al., Reference Li, Liu, Yang and Yue2005; Liu et al., Reference Liu, Saito, Kong, Wang, Wen, Yang and Nakashima2010). The red solid line and dashed line represent identified and presumed paleochannels, respectively, based on this study. Each map is accompanied by δ18O records from stalagmites (gray line; Wang et al., Reference Wang, Cheng, Edwards, Kong, Shao, Chen, Wu, Jiang, Wang and An2008; Li et al., Reference Li, Shen, Huang, Jiang, Yang, Mii, Lee and Lo2014c), 10Be record from loess (Beck et al., Reference Beck, Zhou, Li, Wu, White, Xian, Kong and An2018), and sea-level changes (Waelbroeck et al., Reference Waelbroeck, Labeyrie, Michel, Duplessy, Mcmanus, Lambeck and Labracherie2002) at the top left. (For interpretation of the references to color in this figure legend, the reader is referred to the web version of this article.)

Comparing SU1, SU3, and SU5, it is obvious that SU5 has stratigraphic distribution characteristics similar to those of SU1, but the depocenter that appeared in SU1 is absent in SU3 (Figs. 6 and 9). SU3 shows that the depocenter is mainly distributed in the west of the SYS (Fig. 6). The stratigraphic lithology of SU3 for core YS01 is characterized by clayey silt (Figs. 4 and 5) and is consistent with the lithological characteristics of the muddy sediment in the modern central SYS, whereas the spatial distribution characteristics of this depocenter show that its sedimentary boundary in this study is integrated with the boundary of the paleo–Yellow River delta recognized by Liu et al. (Reference Liu, Saito, Kong, Wang, Wen, Yang and Nakashima2010), indicating a pro-delta muddy deposit. This means that the temporal sedimentary environment was unlike the present state, indicating a low sea level with no circulation system development in the study area during the period. Lambeck and Chappell (Reference Lambeck and Chappell2001) also proposed a sea level around −55 m relative to modern mean sea level with small-scale and short-period fluctuations during this period. SU5 has similar features, with the sediment deposited in the central SYS during the latest transgression. The sediments at core EY02-2 in this stratum are mainly composed of fine sand to gray clay and silt, and the benthic foraminiferal assemblage is dominated by cold-water species and shallow-water marine species during this period (Zhuang et al., Reference Zhuang, Chang, Li and Yan2002; Mei et al., Reference Mei, Li, Zhang, Liu, Liu, Wang, Lan, Liu and Sun2016; Liu et al., Reference Liu, Zhang, Mei, Zhao, Guo, Zhao, Liu, Satio, Wu and Li2018), which is similar to the sediment characteristics of the modern central muddy deposit. The spatial distribution of the sedimentary deposit in the central SYS revealed by the seismic unit also shows the sedimentary characteristics of thinning from the middle to the surroundings (Fig. 6, SU5), and this feature is more obvious in SU53 and SU52 (Fig. 9f and g).
When the range of the CM in HI and HIII is examined, the distribution range of the CM at stage III is seen to be larger (Fig. 9). It reveals a wider range of weak hydrodynamic environment (Zhou et al., Reference Zhou, Dong and Li2015), indicating a relatively higher sea level during the stage of transgression III. Previous studies on sea-level changes also have proposed that the sea level was 3–4 m higher at MIS 5 than at present (Lambeck and Chappell, Reference Lambeck and Chappell2001; Waelbroeck et al., Reference Waelbroeck, Labeyrie, Michel, Duplessy, Mcmanus, Lambeck and Labracherie2002) and that part of the coastal area was submerged by rising seawater (Zheng, Reference Zheng1991; Yi et al., Reference Yi, Yu, Ortiz, Xu, Chen, Ge, Hao, Yao, Shi and Peng2012; Liu et al., Reference Liu, Liu, Zhang, Liu, Wu, Mei, Shi and Zhao2016a). Hence, the scale of the three transgressions during the late Pleistocene is HIII, HI, and HII in descending order.
Response of river paleochannels to sea-level changes
As tectonic movement of the SYS went into a relatively stable stage during the late Quaternary, the development of channels on the shelf was generally controlled by the base level (e.g., Schumm and Ethridge, Reference Schumm and Ethridge1994; Zaitlin et al., Reference Zaitlin, Dalrymple and Boyd1994; Talling, Reference Talling1998; Blum and Törnqvist, Reference Blum and Törnqvist2000). In addition, channel development also depends on river discharge, which is closely related to the monsoon rainfall (Bookhagen et al., Reference Bookhagen, Thiede and Strecker2005; Dai et al., Reference Dai, Yang, Gao, Liu, Li and Li2007; Clift et al., Reference Clift, Giosan, Blusztajn, Campbell, Allen, Pringle and Tabrez2008). The 10Be records on loess and δ18O records on stalagmites revealed a high rainfall amount during the glacial period (Beck et al., Reference Beck, Zhou, Li, Wu, White, Xian, Kong and An2018), such as in MIS 2, MIS 6.3, and MIS 6.5 (Fig. 9), indicating that the rivers had larger runoff volume and extended to the shelf in spite of cold periods. By contrast, these records also exhibited an arid climate condition that is unfavorable for the development of rivers during MIS 4, MIS 6.2, and MIS 6.4 (Fig. 9; Wang et al., Reference Wang, Cheng, Edwards, Kong, Shao, Chen, Wu, Jiang, Wang and An2008; Li et al., Reference Li, Shen, Huang, Jiang, Yang, Mii, Lee and Lo2014c).
The SYS was completely exposed and characterized by a series of terrestrial sedimentary strata during MIS 2 (Ge et al., Reference Ge, Shi, Zhu, Liu, Yin and Liu2006; Liu et al., Reference Liu, Liu, Zhang, Liu, Wu, Mei, Shi and Zhao2016a, Reference Liu, Zhang, Mei, Zhao, Guo, Zhao, Liu, Satio, Wu and Li2018). Kong et al. (Reference Kong, Liu, Du, Wen and Xu2011) identified the buried channel systems in the western SYS (Fig. 9b), which means that the west-eastward deep channel identified in the central study area can be considered an extension of the ancient Yellow River to the SYS at the end of MIS 3 and MIS 2. Previous research have confirmed that the sea level was ~120–130 m lower than present during the LGM (Lambeck and Chappell, Reference Lambeck and Chappell2001; Peltier and Fairbanks, Reference Peltier and Fairbanks2006; Lambeck et al., Reference Lambeck, Rouby, Purcell, Sun and Sambridge2014), indicating that the base level of erosion on the continental shelf moved downward with great amplitude. And the channel further extended to the shelf and finally reached the Yellow Sea Trough due to the strong river discharge during this period (phase LI).
During phase LII, the coastline retreated farthest, to the middle of the SYS, based on the present submarine topography. The central and western areas of SYS underwent strong weathering and denudation during that period (Yang, Reference Yang1994; Liu et al., Reference Liu, Saito, Kong, Wang, Wen, Yang and Nakashima2010, Reference Liu, Zhang, Mei, Zhao, Guo, Zhao, Liu, Satio, Wu and Li2018), and 10Be recorded in the loess indicates an arid climate condition with decreased river runoff (Beck et al., Reference Beck, Zhou, Li, Wu, White, Xian, Kong and An2018). Even though the base level of erosion was raised due to sea-level fall, large channels were not developed in the SYS during this period. Only several small channels were distributed in the western part of 123°E during this period (Fig. 9d).
Although the amplitude of base level that descended during MIS 6 is similar to that of the LGM (Lambeck and Chappell, Reference Lambeck and Chappell2001; Waelbroeck et al., Reference Waelbroeck, Labeyrie, Michel, Duplessy, Mcmanus, Lambeck and Labracherie2002), previous studies have reported a prevailing Asian summer monsoon with high rainfall during the MIS 6.3 and MIS 6.5 in northern China (Fig. 9; Wang et al., Reference Wang, Cheng, Edwards, Kong, Shao, Chen, Wu, Jiang, Wang and An2008; Li et al., Reference Li, Shen, Huang, Jiang, Yang, Mii, Lee and Lo2014c; Beck et al., Reference Beck, Zhou, Li, Wu, White, Xian, Kong and An2018). This means that rivers extended to the shelf during phase LIII due to large runoff volume, but no paleochannel was found in the study area (Fig. 9). Based on the geochemical characteristics of core NT2, the sediments were mainly derived from the Yellow River during this period (Lan et al., Reference Lan, Zhang and Zhang2005, Reference Lan, Zhang, Li and Ding2010; Liu et al., Reference Liu, Saito, Kong, Wang, Wen, Yang and Nakashima2010). Combined with the distribution feature of SU6 (Figs. 6 and 9h), a nearly east-west channel was developed to the south of 34°N. We hypothesize that the ancient Yellow River developed in the southern part of the study area and extended to the Yellow Sea Trough during this period. Figure 9h shows that the paleochannel extended eastward in the SB, indicating that the topography of the middle uplift is higher than the SB during this time.
Major factors controlling the distribution of SYS strata
The uplifting of the Tibetan Plateau caused the topographic reversal of eastern China from westward tilt to eastward tilt, and also influenced the development of the river system (Wang, Reference Wang1998). The massive drop in the terrain caused by the Tibetan Plateau uplift resulted in extensive matter and energy exchange and terrigenous materials carried by rivers to the shelf (Zheng et al., Reference Zheng, Wang, Liu, Yang, Wang, Li and Zhou2008). Sedimentation in the shelf region is dominantly controlled by the accommodation space, which depends on sea-level changes and tectonic activities in the long term (McCarthy et al., Reference McCarthy, Katz, Kotthoff, Browning, Miller, Zanatta, Williams, Drljepan, Hesselbo and Bjerrum2013; Miller et al., Reference Miller, Sugarman, Browning, Sheridan, Kulhanek, Monteverde, Wehmiller, Lombardi and Feigenson2013). In addition, sediment supply related to climatic conditions (e.g., monsoon rainfall) also has a significant effect on the development of continental shelf strata. The influence of the Asian monsoon on sedimentation mainly manifested as sediment discharge, which is produced by river runoff and erosion processes in the source area through the precipitation brought by the summer monsoon (Bookhagen et al., Reference Bookhagen, Thiede and Strecker2005; Clift et al., Reference Clift, Giosan, Blusztajn, Campbell, Allen, Pringle and Tabrez2008). Deposition processes in the SYS occur mainly in a marine sedimentary environment (Fig. 7); thus the accommodation space is a prerequisite for the development of continental shelf strata. Although there are many other factors (e.g., tides, currents) controlling the distribution of shelf strata, this study mainly focuses on three main factors: tectonic activity, sea-level change, and the Asian monsoon.
Yi et al. (Reference Yi, Ye, Chen, Li, Long, Wang, Du, Zhao and Deng2014) proposed that seawater began to enter the SYS basin at ~2 Ma due to the ZMU subsidence (Qin et al., Reference Qin, Zhao and Chen1989), and the sedimentary record from the cores (CSDP-01, QC2, EY02-2; Yang et al., Reference Yang, Jung, Lim and Li2003; Ge et al., Reference Ge, Shi, Zhu, Liu, Yin and Liu2006; Liu et al., Reference Liu, Zhang, Mei, Zhao, Guo, Zhao, Liu, Satio, Wu and Li2018) also showed that the SYS experienced multistage transgressions in the Quaternary. Hou (Reference Hou2006) studied the neotectonics in the SYS and found that there were three large subsidence centers and one continuous uplift area during the late Quaternary. Based on the distribution of the Quaternary strata thickness in the SYS, the Quaternary strata thickness is consistent with the basin tectonic base (Fig. 8a), and it is characterized by thicker strata in the basin and thinner strata in the uplift. Comparing the stratigraphic distribution characteristics revealed by the results of Yang et al. (Reference Yang, Li, Liu, Dada, Zhao, Ma and Wen2018) with the results of this study, the stratigraphic distribution before 126 ka shows the same pattern as during the Quaternary (Fig. 8), whereas the features of strata distribution in the study area since the late Pleistocene show no obvious influence of tectonic activities on strata distribution (Fig. 8b). On the other hand, based on the analysis of rare earth elements in the borehole NT2 (Lan et al., Reference Lan, Zhang, Li and Ding2010), the sediments around the paleochannel in SB during the period of LIII mainly originated from Yellow River. This means the old Yellow River may have extended into the SB as a result of the topography. As we noted earlier, the tectonic framework of the middle uplift in the SYS basin still exists based on the paleochannel distribution characteristics at the LIII (Fig. 9e). Therefore, the influence of the SYS basin tectonic activity on the sedimentation of the SYS has ceased, and it has been succeeded by sea-level changes and the Asian summer monsoon since the late Pleistocene.
The accommodation space is directly controlled by sea-level changes when the subsidence rate is stable (Coe, Reference Coe2003). During the late Pleistocene, the ZMU completely subsided (~0.2 Ma; Yi et al., Reference Yi, Ye, Chen, Li, Long, Wang, Du, Zhao and Deng2014). Since then, the strata that formed in the study region, which is characterized by the alternation of marine and terrigenous facies (Fig. 4), have good correlation with sea-level fluctuations. The Asian summer monsoon also has a significant influence on the shelf stratigraphic development on millennial time scale (Bookhagen et al., Reference Bookhagen, Thiede and Strecker2005; Clift et al., Reference Clift, Giosan, Blusztajn, Campbell, Allen, Pringle and Tabrez2008; Hwang et al., Reference Hwang, Van, Choi, Chang and Kim2014; Yuan et al., Reference Yuan, Li, Wang, He and Hirose2017), and such influence is generally through sediment discharge by rivers. We calculated the mean sedimentary flux of transgressive strata (SU1, SU3, and SU5) to reflect the mean intensity of monsoon rainfall. The calculation procedure of formation volume is based on the principle of excavation volume in engineering geology research (Ye and Jiang, Reference Ye and Jiang2008). The burial depth of the bottom boundary of sedimentary strata was mainly obtained by grid interpolation based on the burial thickness of stratigraphic units on each seismic line, and the volume of each seismic unit was eventually obtained by a cut/fill process. Considering the flat terrain of the SYS during the late Pleistocene, the formation volume obtained by this method can be considered reliable, although the interpolation method may cause minor errors. On the other hand, the study results of modern sedimentary dynamic processes revealed that the study area covers the main sink of the SYS (Li et al., Reference Li, Li, Liu, Qiao, Ma, Xu and Yang2014a), indicating that the variation of sedimentary flux in the study area was synchronous with that of the whole continental shelf during the same period. These three transgressive strata (SU1, SU3, and SU5) belong to the highstand sea-level deposit, indicating a sufficient accommodation space in the SYS basin. Therefore, this parameter can roughly reflect the sediment volume carried by rivers during the transgressive period and further reflect the monsoon rainfall.
Based on the chronological framework of core YS01, the duration of sedimentation for the transgressive formations at HI and HII was 10.18 and 9.42 ka, respectively. The duration of sedimentation of transgressive formation HIII was estimated to be approximately 50.18 ka by linear interpolation of magnetic ages during this transgression. We cannot accurately calculate the duration period due to the lack of accurate borehole core dating in this transgression. The mean sedimentary fluxes of the formation that developed during HI, HII, and HIII were 21.2, 16.64, and 12.22 cm3/ka, respectively. Increased monsoon rain can accelerate the erosion and sediment transport in the source area, thereby resulting in increased sediment discharge (Bookhagen et al., Reference Bookhagen, Thiede and Strecker2005; Dai et al., Reference Dai, Yang, Gao, Liu, Li and Li2007; Clift et al., Reference Clift, Giosan, Blusztajn, Campbell, Allen, Pringle and Tabrez2008). Sediment carried by rivers was higher during HI than HII, indicating high rainfall caused by the Asian summer monsoon. This is consistent with the results revealed by Beck et al. (Reference Beck, Zhou, Li, Wu, White, Xian, Kong and An2018). The sediment flux during HIII was the smallest among the three transgression stages, indicating a low mean sediment supply during this period. Absolutely, the estimated duration error caused by the linear interpolation method of magnetic age during this transgression may result in a deviation for this result. In addition, the monsoon rainfall has an influence on the development of paleochannels during the shelf exposure. Paleochannels were found in the LI and LIII, indicating high rainfall in these periods. The 10Be record in loess presents the same characteristics of rainfall variability (Beck et al., Reference Beck, Zhou, Li, Wu, White, Xian, Kong and An2018).
Sediment STS model in the SYS
Sediment STS processes can be subdivided into three spatial zones, including denudation/erosion, transportation, and accumulation/deposition (Romans et al., Reference Romans, Castelltort, Covault, Fildani and Walsh2016). Previous studies on continental margin depositional system revealed that the majority of the depositional processes generally occurred during periods of marine transgression and low stand of sea level (Covault and Graham, Reference Covault and Graham2010). Under the influence of high-frequency and large-scale changes of sea level in the Quaternary period, the shallow shelf environment shows alternating characteristics of marine and continental facies, and two models of sediment STS processes are proposed for the SYS (Fig. 10).
Two models of source-to-sink processes on the SYS shelf. (a) High sea-level model. The red arrow represents currents. The brown area represents the fine sediments sink. (b) Shelf-exposure model. The black dotted line represents paleochannels on the SYS shelf. The grayish-blue area represents the lacustrine sediments sink. (For interpretation of the references to color in this figure legend, the reader is referred to the web version of this article.)

High sea-level model (marine environment)
The vast majority of the sediment deposited in the SYS originates from the sediment carried by rivers in the Chinese mainland and the Korean Peninsula (Chen, Reference Chen1995; Park et al., Reference Park, Lee, Han, Lee, Kim and Yoo2000; Chough et al., Reference Chough, Kim, Lee, Shinn, Jin, Suh and Lee2002; Jin et al., Reference Jin, Chough and Ryang2002; Yang et al., Reference Yang, Jung, Lim and Li2003; Yang and Youn, Reference Yang and Youn2007). According to the survey data from the China coast studied by Chen (Reference Chen1995), the total river sediment discharge is 14.44 × 10⁸ tons per year. These sediments generally originated from the erosion of sediment by monsoon rainfall in the source area (e.g., Bookhagen et al., Reference Bookhagen, Thiede and Strecker2005; Clift et al., Reference Clift, Giosan, Blusztajn, Campbell, Allen, Pringle and Tabrez2008). Besides the river sediment discharge, the resuspended sediment from the abandoned deltas and tidal sand ridges along the coastal zone is another significant “source” in the continental shelf sedimentary system. Yang et al. (Reference Yang, Jung, Lim and Li2003) proposed that the abandoned Yellow River delta experienced significant erosion after the route of the Yellow River shifted northward to the Bohai Sea. Other sources, such as aeolian dust and volcanic materials, also contribute to the formation of the strata in the continental shelf region. Li et al. (Reference Li, Li, Liu, Qiao, Ma, Xu and Yang2014a) also proposed that the debris, aerosol and pozzolana are the modern sediment sources. In this model, river discharge is the main source of the continental shelf sediment.
Depocenters of shelf strata revealed by subbottom profiles are the main manifestation of sediment sink (Fig. 7), including delta and muddy deposit. A series of delta sedimentary bodies developed in transition zones due to their hydrodynamic condition become weak from estuaries to shelf. Great loads of sediment carried by rivers are unloaded at estuaries, and only part of them is transported in suspension by currents to the shelf. Taking the last transgression as an example, the major circulation system of SYS consists of the Yellow Sea coastal current, Yellow Sea warm current, South Shandong coastal current, North Jiangsu coastal current, and South Korean coastal current (Fig. 2). These currents not only carry sediment into the shelf along their pathway, but also provide weak hydrodynamic depositional conditions for fine sediment (Park et al., Reference Park, Lee, Han, Lee, Kim and Yoo2000; Li et al., Reference Li, Li, Liu, Qiao, Ma, Xu and Yang2014a). Muddy zones of the shelf, such as eddy mud areas and coastal muddy sedimentary areas, are another typical type of “sink.”
Shelf-exposure model (terrestrial environment)
The SYS has undergone multiple transgressions and developed a series of marine strata during the Quaternary (Yang, Reference Yang1994; Mei et al., Reference Mei, Li, Zhang, Liu, Liu, Wang, Lan, Liu and Sun2016; Liu et al., Reference Liu, Zhang, Mei, Zhao, Guo, Zhao, Liu, Satio, Wu and Li2018). However, the SYS was exposed in the regression stage, and the marine “sink” migrated toward the Okinawa Trough as the shoreline retreated (Fig. 10b). New constraints on the fluctuation of ice volume reveal that global sea level fell by ~120–130 m during the LGM (Lambeck et al., Reference Lambeck, Rouby, Purcell, Sun and Sambridge2014), and the coastline retreated toward the Okinawa Trough. On the other hand, several lakes developed in the low-lying areas on the shelf due to the accumulation of residual seawater and/or monsoon rainfall, and they provided sufficient accommodation space for sediment deposition. Therefore, it is a typical shelf sink. According to previous studies on sediment STS, the floodplain deposits around rivers are also the main manifestation of a sink. Land rivers extended to the continental shelf (Fig. 9), providing a channel for sediment transport from source to sink. The strata in exposed continental shelf suffered from weathering and denudation, and the products, which are considered as a sediment source, were transported to the low-lying areas of the shelf or adjacent rivers through the process of wind and/or precipitation scouring. Similarly, dust is another main source of sediment on the continental shelf in the model.
CONCLUSIONS
In this study, we used high-resolution seismic and borehole data to examine the response of the SYS strata to sea-level changes during the late Pleistocene. We discussed the distribution characteristics of the strata and paleochannels during the transgression stages and shelf-exposure stages, respectively, and further analyzed the major controlling factors of the SYS stratigraphic distribution. In addition, two STS models were established in the SYS, that is, a shelf-exposure model and a high sea-level model. The final conclusions of this paper follow.
First, based on the seismic reflection configurations and internal reflection characteristics of seismic units, we recognized two types of seismic units in the subbottom profiling and identified three complete sets of stratigraphic sequences during the late Pleistocene.
Second, factors affecting the modern central mud deposit in the SYS were analyzed, and the range of central mud deposit was identified to reflect the transgression scale. According to sedimentary characteristics and sedimentary strata distribution patterns, mud deposition was widely developed in the central SYS in the early-middle stage of MIS 5 and the middle–late stage of MIS 1, while it mainly developed into the inshore delta deposition during the late MIS 5 and MIS 3. Comparing the extent of the vortex argillaceous zones formed at the three transgression stages (HI, HII, and HIII), HIII (~MIS 5) has the largest scale of transgression, followed by HI (the middle–late period of MIS 1). In addition, modern circulation did not develop during the HII (~MIS 3) due to shallow water depth in the SYS.
Third, the development of rivers was not only controlled by the sea-level changes on the shelf but also influenced by river discharge. Increased monsoon rainfall during the glacial periods accelerated erosion in the source areas, resulting in increased river runoff and sediment transportation. Based on the seismic stratigraphic results in this study, we inferred that the river extended to the shelf in LI (~MIS 2 to the early MIS 1) and LIII (~MIS 6), and we propose that the paleochannels are ancient Yellow River extensions. In addition, we found that the old Yellow River eroded the SYS from west to east and eventually extended to the Yellow Sea Trough during the LGM.
Fourth, the distribution of the Quaternary strata is consistent with the SYS basin basement. Sea-level changes, the Asian summer monsoon, and the tectonic framework are significant factors that controlled strata development in the SYS during the Quaternary. Based on the distribution of strata and paleochannels, we infer that the influence of the SYS basin tectonic framework on the sedimentation of the SYS is completely concealed by sea-level changes and the Asian summer monsoon in the early late Pleistocene. The influence of sea-level changes and the Asian summer monsoon variations on sediment flux in the SYS manifested in the accommodation space and sediment supply, respectively, and the former is the prerequisite for controlling the formation of continental shelf strata in the SYS. In addition, sediment flux in the study area reflects the mean Asian summer monsoon intensity at the highstand sea-level period.
ACKNOWLEDGMENTS
This study was jointly funded by the Key Geological Issues in China Sea, the China Geological Survey, and the National Key Research and Development Program of China (Grant No. DD20160147, GZH201100202, GASI-02-PAC-CJ15, and SQ2017YFGH001475), and the Taishan Scholar Project grant to Guangxue Li. We give our heartfelt thanks to all the expedition staff and crew who took part in the field acquisition of seismic profile data, to Zhiqiang Wu of the Qingdao Institute of Marine Geology for providing the multichannel seismic record, and to Siyou Tong and Xueqin Liu of the Ocean University of China for assisting with the data analysis.